
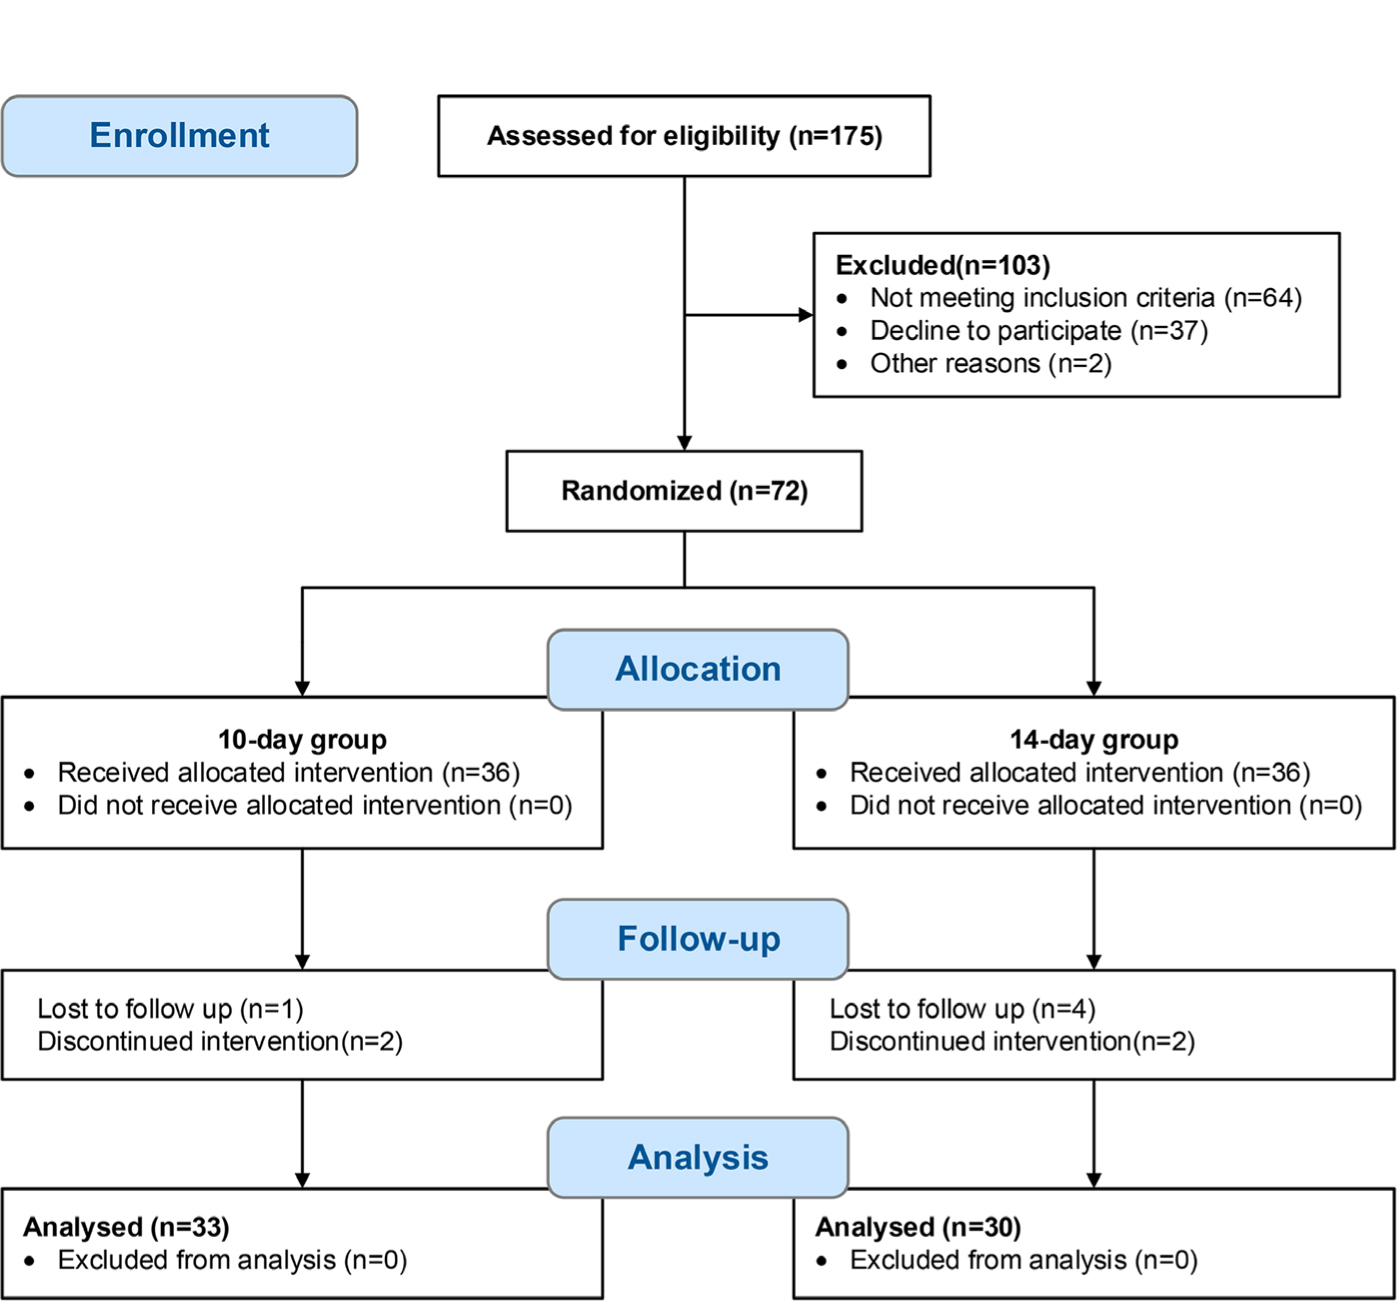
Figure 1.
CONSORT flow chart showing subjects flow during the trial.
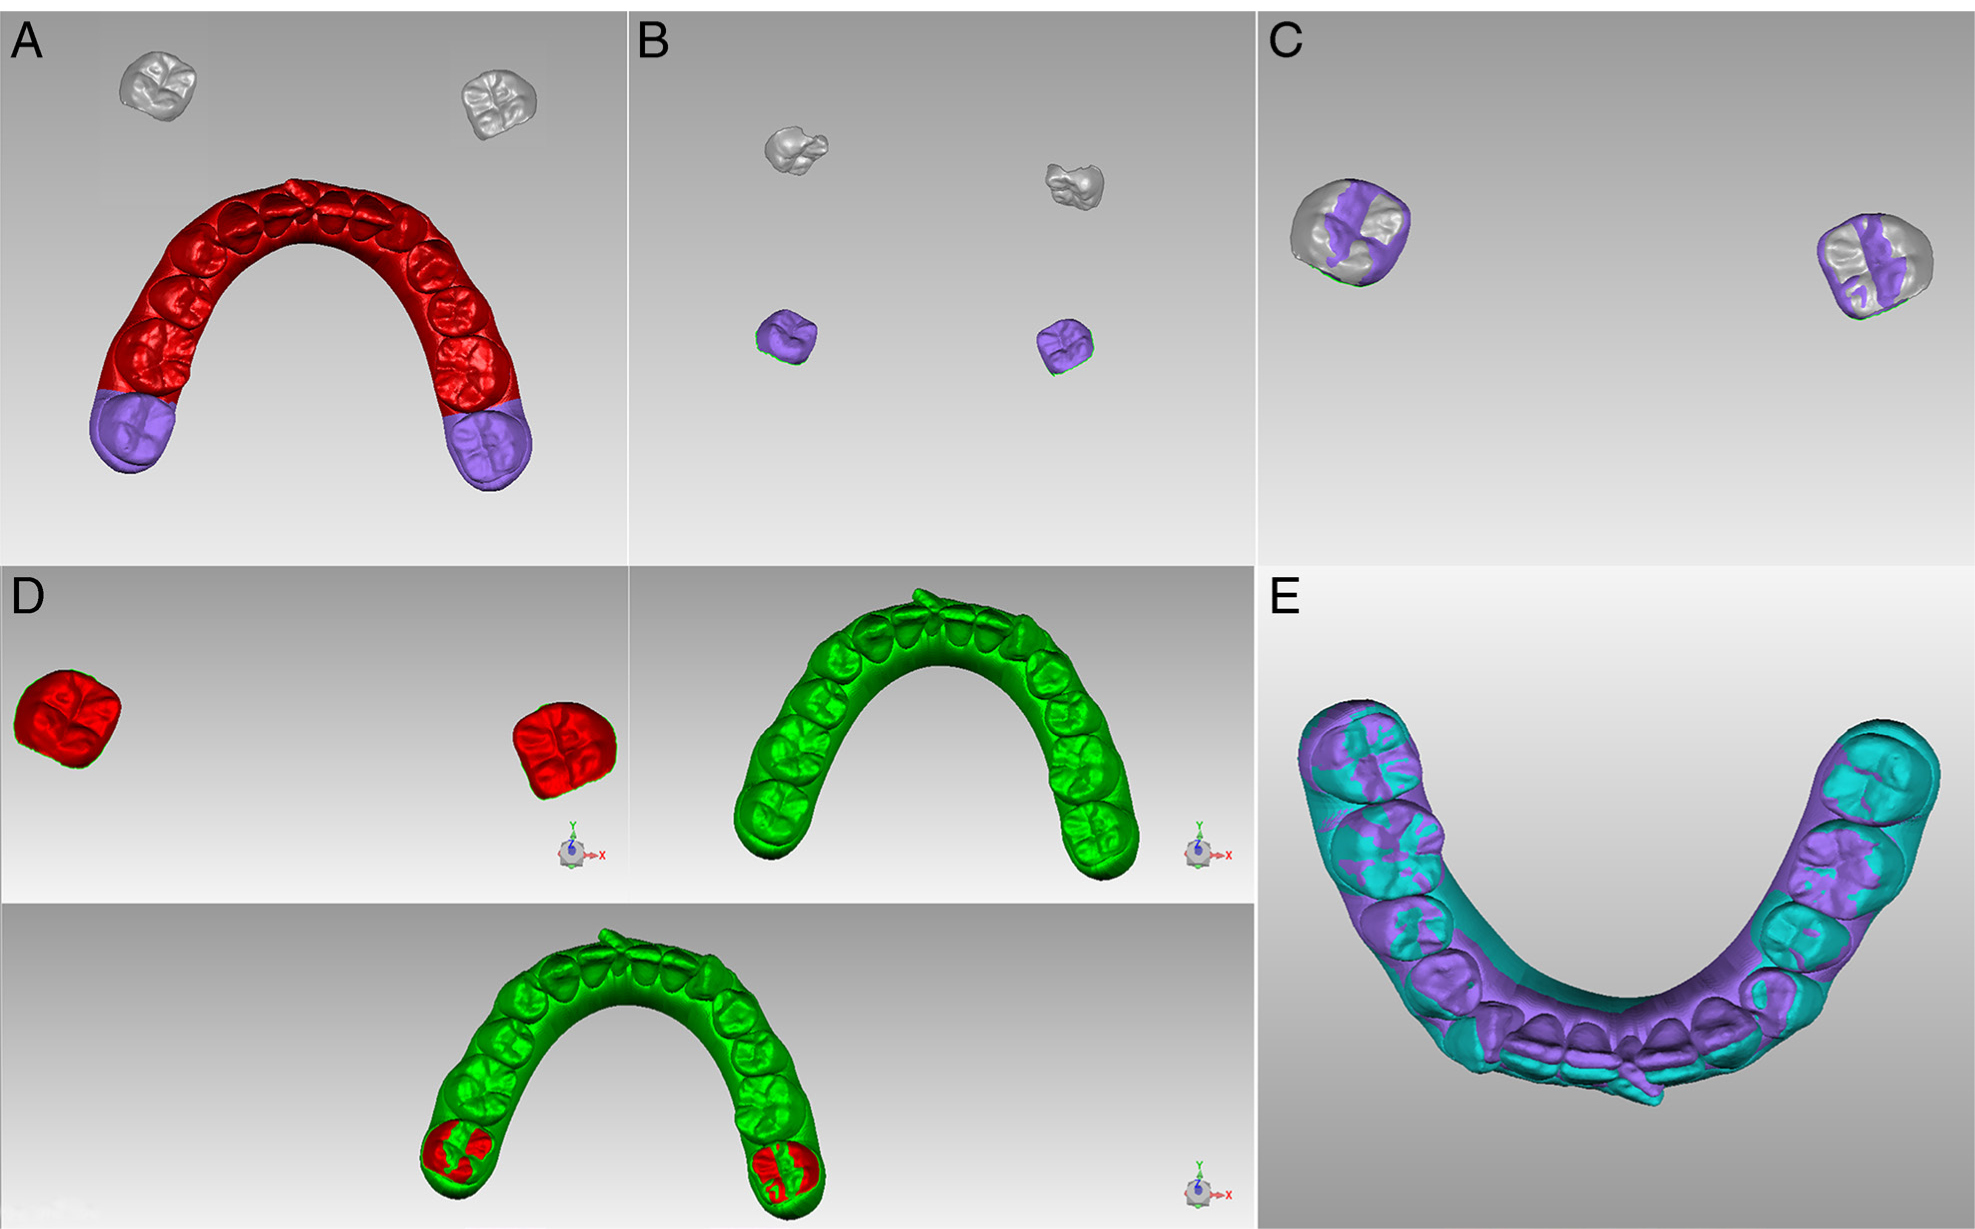
Figure 2.
Superimposition of the initial models and progress models based on the stable structure method (unmoved teeth in the ClinCheck) using the GEOMAGIC studio software. (a) Teeth designed not to be moved in ClinCheck were respectively separated from initial models and progress models (grey and purple coloured the second molars); (b) and (c) Registration of the unmoved teeth (second molars); (d) and (e) Final superimposition using the unmoved teeth (second molars) as reference.
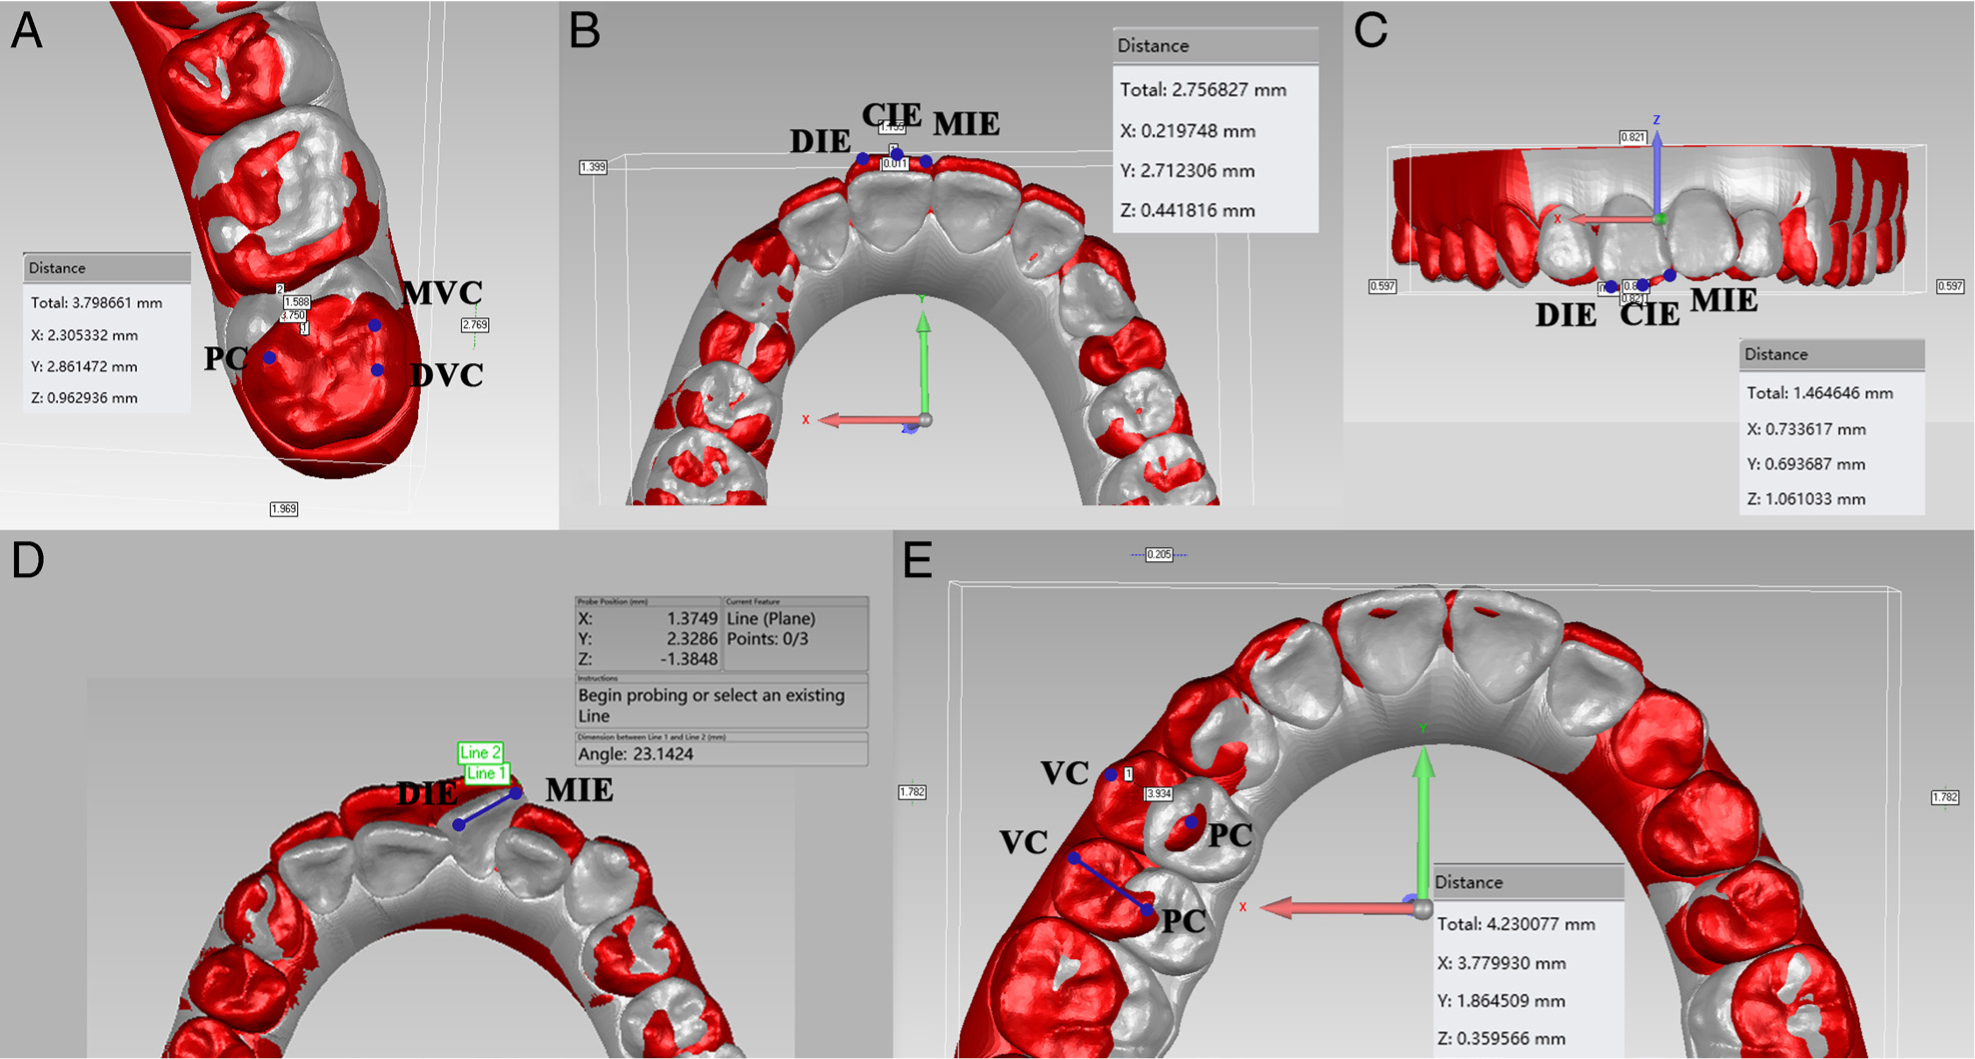
Figure 3.
Measurement of OTM. (a) Molar distalization was measured at points of each cusp tip of molars; (b) Points of incisor edges were used to measure anterior retraction; (c) Measurement of anterior intrusion; (d) Lines of incisor edges were used to measure angle of anterior rotation; (e) Measurement of posterior expansion. CIE: central incisal edge; DIE: distal incisal edge; DVC: distal vestibular cusp tip; MVC: mesial vestibular cusp tip; MIE: mesial incisal edge; PC: palatal cusp tip; VC: vestibular cusp tip.
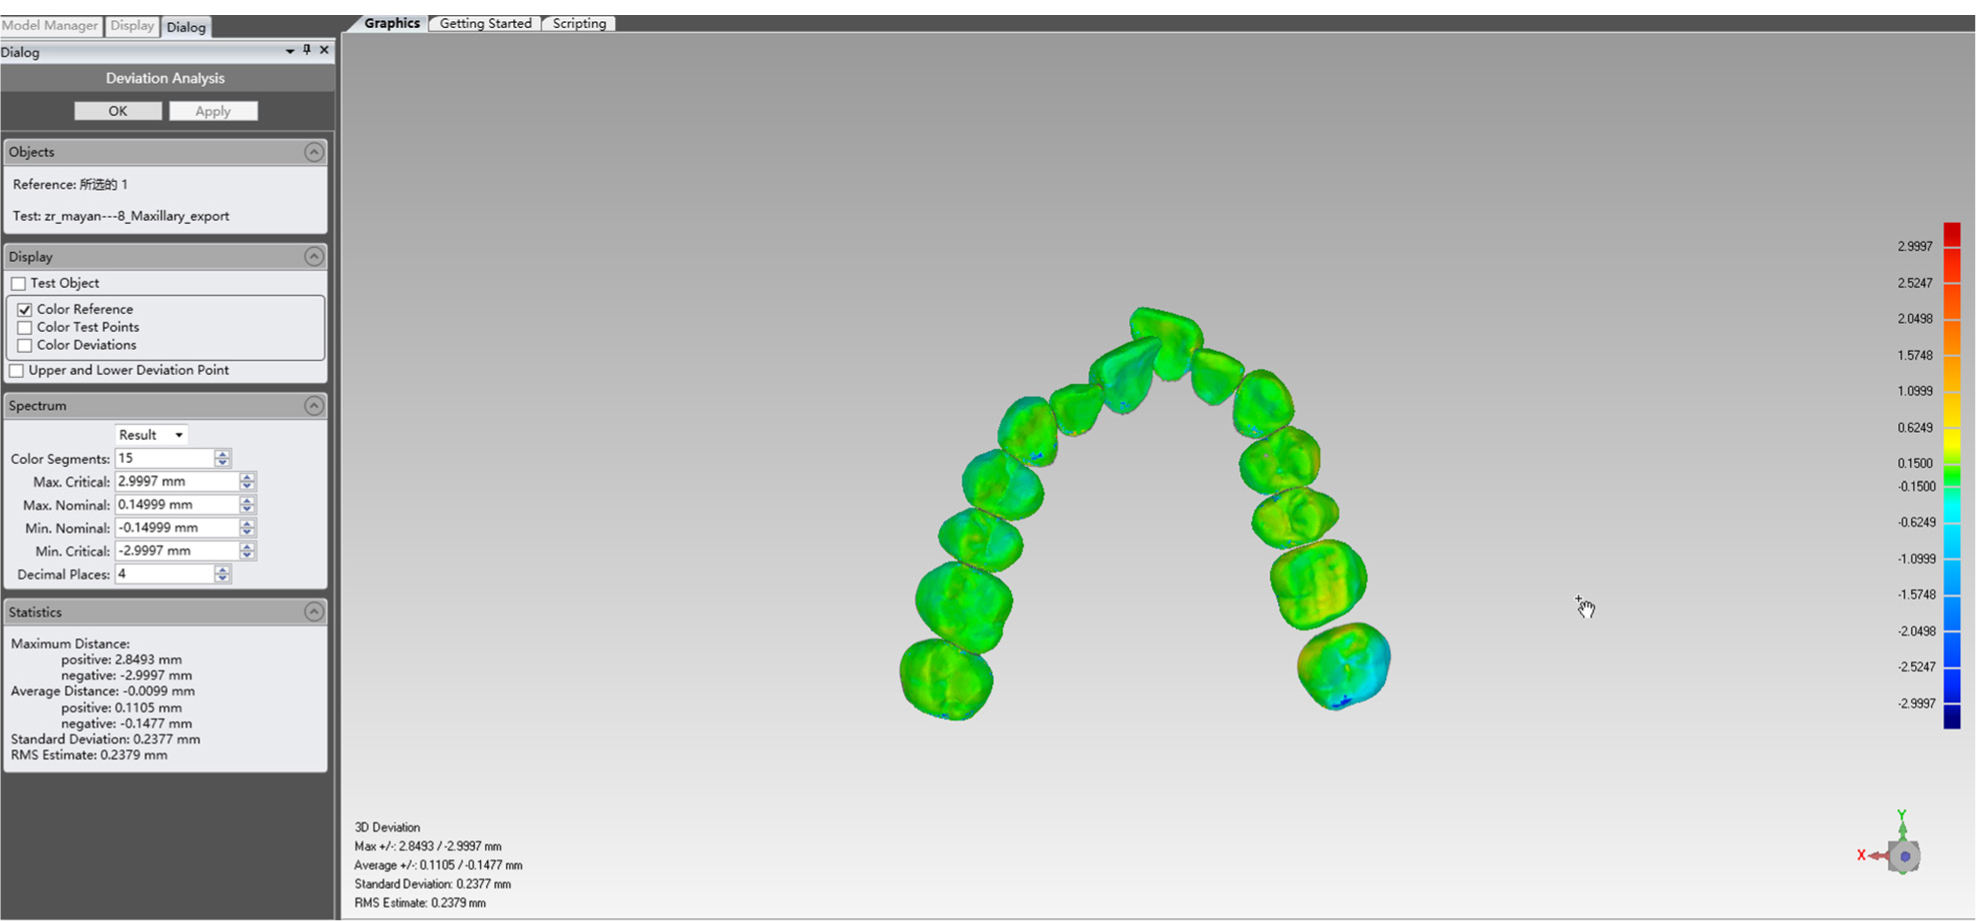
Figure 4.
Shell-to-shell deviation of OTM by using a whole surface best fit algorithm and colour-mapping methods in the GEOMAGIC studio software. Green represents no deviation; red represents a large and positive deviation; blue represents a small and negative deviation. The bigger the deviation is the more OTM stray from the ClinCheck.
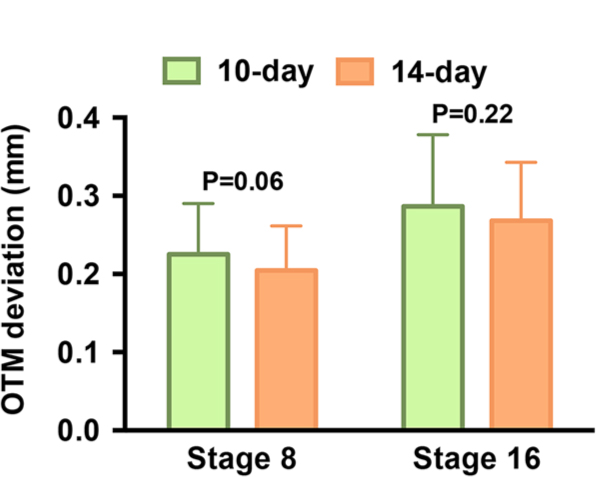
Figure 5.
Shell-to-shell deviation of OTM (mean ± standard error) at Stage 8 (T1) and Stage 16 (T2) of the Invisalign treatment. There was no statistically significant difference between the 10-day group and 14-day group.
Table I.
Baseline characteristics of participants included in the fina analysis.
| 10-day group (N = 33) | 14-day group (N = 30) | |
|---|---|---|
| Gender (N, %) | ||
| Male | 8 (24.24%) | 6 (20.00%) |
| Female | 25 (75.76%) | 24 (80.00%) |
| Age (N, %) | ||
| ≤45 | 32 (96.97%) | 28 (93.33%) |
| >45 | 1 (3.03%) | 2 (6.67%) |
| Malocclusion (N, %) | ||
| Class I | 14 (42.42%) | 11 (36.67%) |
| Class II | 15 (45.45%) | 13 (43.33%) |
| Class III | 4 (12.12%) | 6 (20.00%) |
| Initial incisor irregularity (mean ± standard deviation) | 6.38 ± 2.44 | 6.53 ± 2.08 |
| Visual analog scale (VAS) score (mean ± standard deviation) | 0.06 ± 0.18 | 0.08 ± 0.26 |
Table II.
Comparison of orthodontic tooth movement (OTM) efficacy between 10-day and 14-day groups at stage 8 (T1) of the Invisalign treatment.
| 10-day group | 14-day group | ||||||||||
|---|---|---|---|---|---|---|---|---|---|---|---|
| OTM | N | Predicted OTM | Actual OTM | Mean OTM efficacy | SD | N | Predicted OTM | Actual OTM | Mean OTM efficacy | SD | P-value |
| Anterior intrusion | 76 | 1.78 mm | 1.34 mm | 75.15% | 13.20% | 81 | 1.72 mm | 1.26 mm | 73.42% | 13.92% | 0.43 |
| Anterior extrusion | 17 | 1.69 mm | 1.29 mm | 76.63% | 9.29% | 14 | 1.78 mm | 1.45 mm | 81.26% | 10.14% | 0.19 |
| Anterior proclination | 69 | 7.44° | 6.17° | 82.90% | 9.84% | 63 | 6.81° | 5.75° | 84.46% | 9.63% | 0.36 |
| Anterior retraction | 23 | 1.85 mm | 1.48 mm | 80.10% | 7.81% | 16 | 1.84 mm | 1.53 mm | 83.46% | 8.32% | 0.21 |
| Anterior derotation | 29 | 8.31° | 6.36° | 76.55% | 13.44% | 22 | 7.76° | 5.66° | 72.94% | 10.91% | 0.31 |
| Posterior expansion | 22 | 1.62 mm | 1.25 mm | 77.58% | 12.25% | 18 | 1.57 mm | 1.23 mm | 78.50% | 10.92% | 0.81 |
| Premolar derotation | 11 | 6.74° | 5.65° | 83.78% | 11.92% | 9 | 7.32° | 6.02° | 82.20% | 9.08% | 0.75 |
| Molar distal tipping | 27 | 1.62 mm | 1.3 mm | 80.49% | 9.59% | 23 | 1.64 mm | 1.27 mm | 77.73% | 12.93% | 0.39 |
| Posterior mesial tipping | 8 | 1.52 mm | 1.19 mm | 78.88% | 12.64% | 12 | 1.79 mm | 1.37 mm | 76.71% | 15.80% | 0.75 |
| Posterior intrusion | 17 | 1.18 mm | 0.95 mm | 80.87% | 7.26% | 22 | 1.14 mm | 0.93 mm | 81.34% | 7.48% | 0.85 |
1 The OTM efficacy was calculated as the percentage of the actual OTM distance divided by the predicted OTM distance, N: numbers of teeth measured for each type OTM; Predicted OTM: the distance of predicted OTM in Clincheck plan measured form initial STL model and predicted STL model; Actual OTM: The distance of actual OTM measured form initial STL model and actual STL model; Mean OTM efficacy: the mean value of OTM efficacy; SD: standard deviation of OTM efficacy.
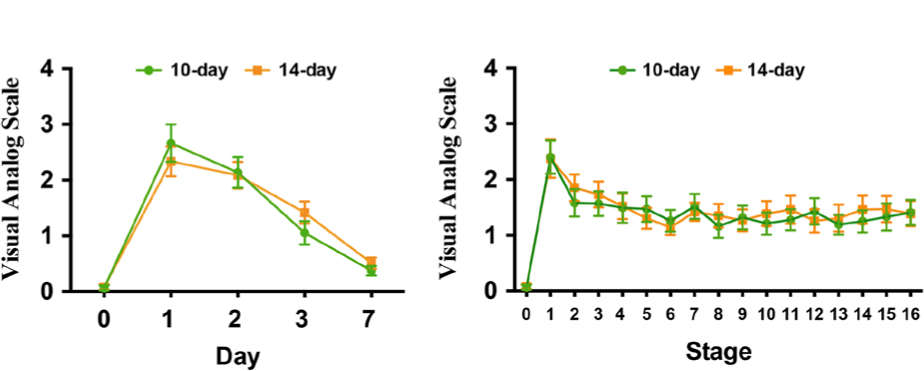
Figure 6.
Pain perception (VAS score, mean ± standard error) of the 10-day and 14-day groups was similar throughout the study.
Table III.
Comparison of orthodontic tooth movement (OTM) efficacy between 10-day and 14-day groups at stage 16 (T2) of the Invisalign treatment.
| 10-day group | 14-day group | ||||||||||
|---|---|---|---|---|---|---|---|---|---|---|---|
| OTM | N | Predicted OTM | Actual OTM | Mean OTM efficacy | SD | N | Predicted OTM | Actual OTM | Mean OTM efficacy | SD | P-value |
| Anterior intrusion | 100 | 2.09 mm | 1.37 mm | 65.66% | 16.46% | 93 | 1.93 mm | 1.33 mm | 69.09% | 12.22% | 0.09 |
| Anterior extrusion | 29 | 2.13 mm | 1.41 | 66.15% | 11.00% | 26 | 2.06 mm | 1.45 mm | 70.25% | 9.91% | 0.15 |
| Anterior proclination | 72 | 11.95° | 9.01° | 75.40% | 12.02% | 66 | 11.42° | 8.93° | 78.23% | 12.87% | 0.18 |
| Anterior retraction | 51 | 2.14 mm | 1.7 mm | 79.58% | 11.75% | 43 | 2.12 mm | 1.63 mm | 76.92% | 11.66% | 0.28 |
| Anterior derotation | 41 | 9.52° | 6.74° | 70.80% | 14.36% | 35 | 9.14° | 6.37° | 69.73% | 10.65% | 0.75 |
| Posterior expansion | 29 | 1.84 mm | 1.39 mm | 75.63% | 11.74% | 38 | 1.97 mm | 1.52 mm | 77.00% | 14.87% | 0.66 |
| Premolar derotation | 16 | 7.57° | 5.65° | 74.66% | 17.20% | 19 | 8.54° | 6.53° | 76.46% | 14.85% | 0.75 |
| Molar distal tipping | 51 | 2.27 mm | 1.76 mm | 77.71% | 11.74% | 48 | 2.06 mm | 1.57 mm | 76.19% | 10.88% | 0.51 |
| Posterior mesial tipping | 12 | 1.83 mm | 1.21 mm | 65.72% | 12.57% | 17 | 1.91 mm | 1.35 mm | 70.92% | 14.17% | 0.32 |
| Posterior intrusion | 24 | 1.42 mm | 1.04 mm | 73.22% | 9.67% | 34 | 1.47 mm | 1.12 mm | 76.01% | 10.11% | 0.30 |
1 The OTM efficacy was calculated as the percentage of the actual OTM distance divided by the predicted OTM distance, N: numbers of teeth measured for each type OTM; Predicted OTM: the distance of predicted OTM in Clincheck plan measured form initial STL model and predicted STL model; Actual OTM: The distance of actual OTM measured form initial STL model and actual STL model; Mean OTM efficacy: the mean value of OTM efficacy; SD: standard deviation of OTM efficacy.