
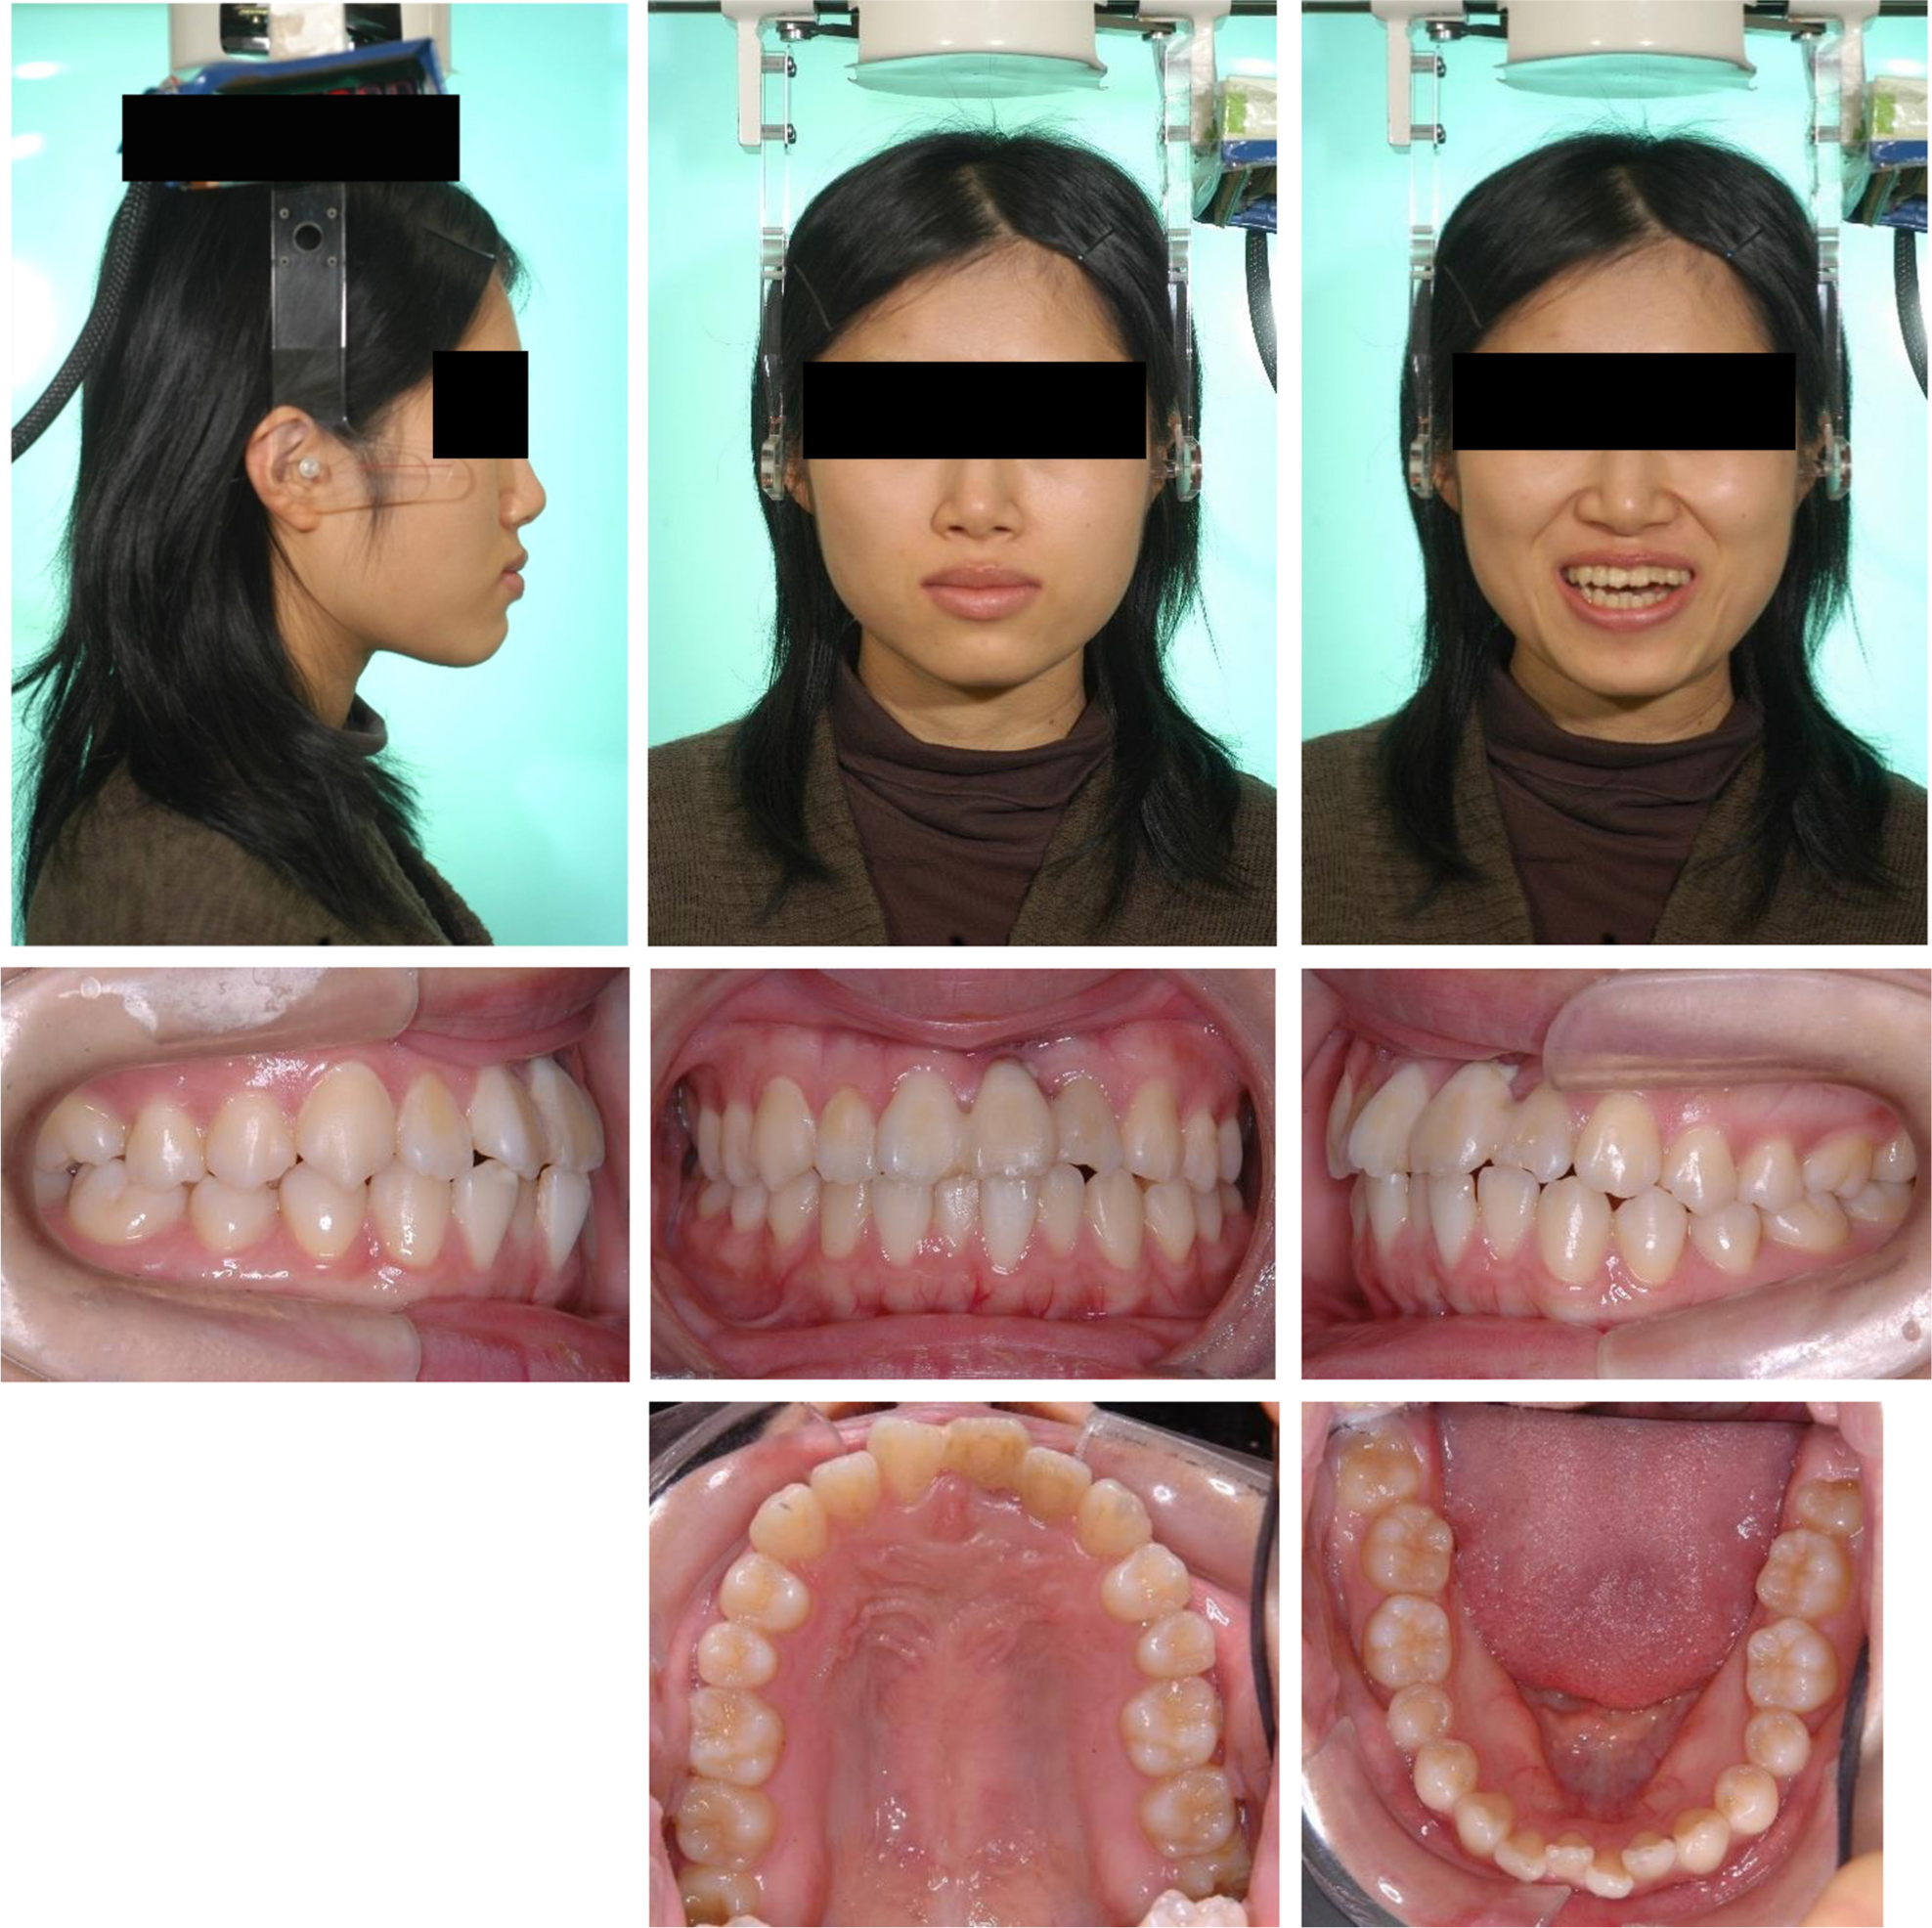
Figure 1.
Pretreatment facial and intraoral photographs.
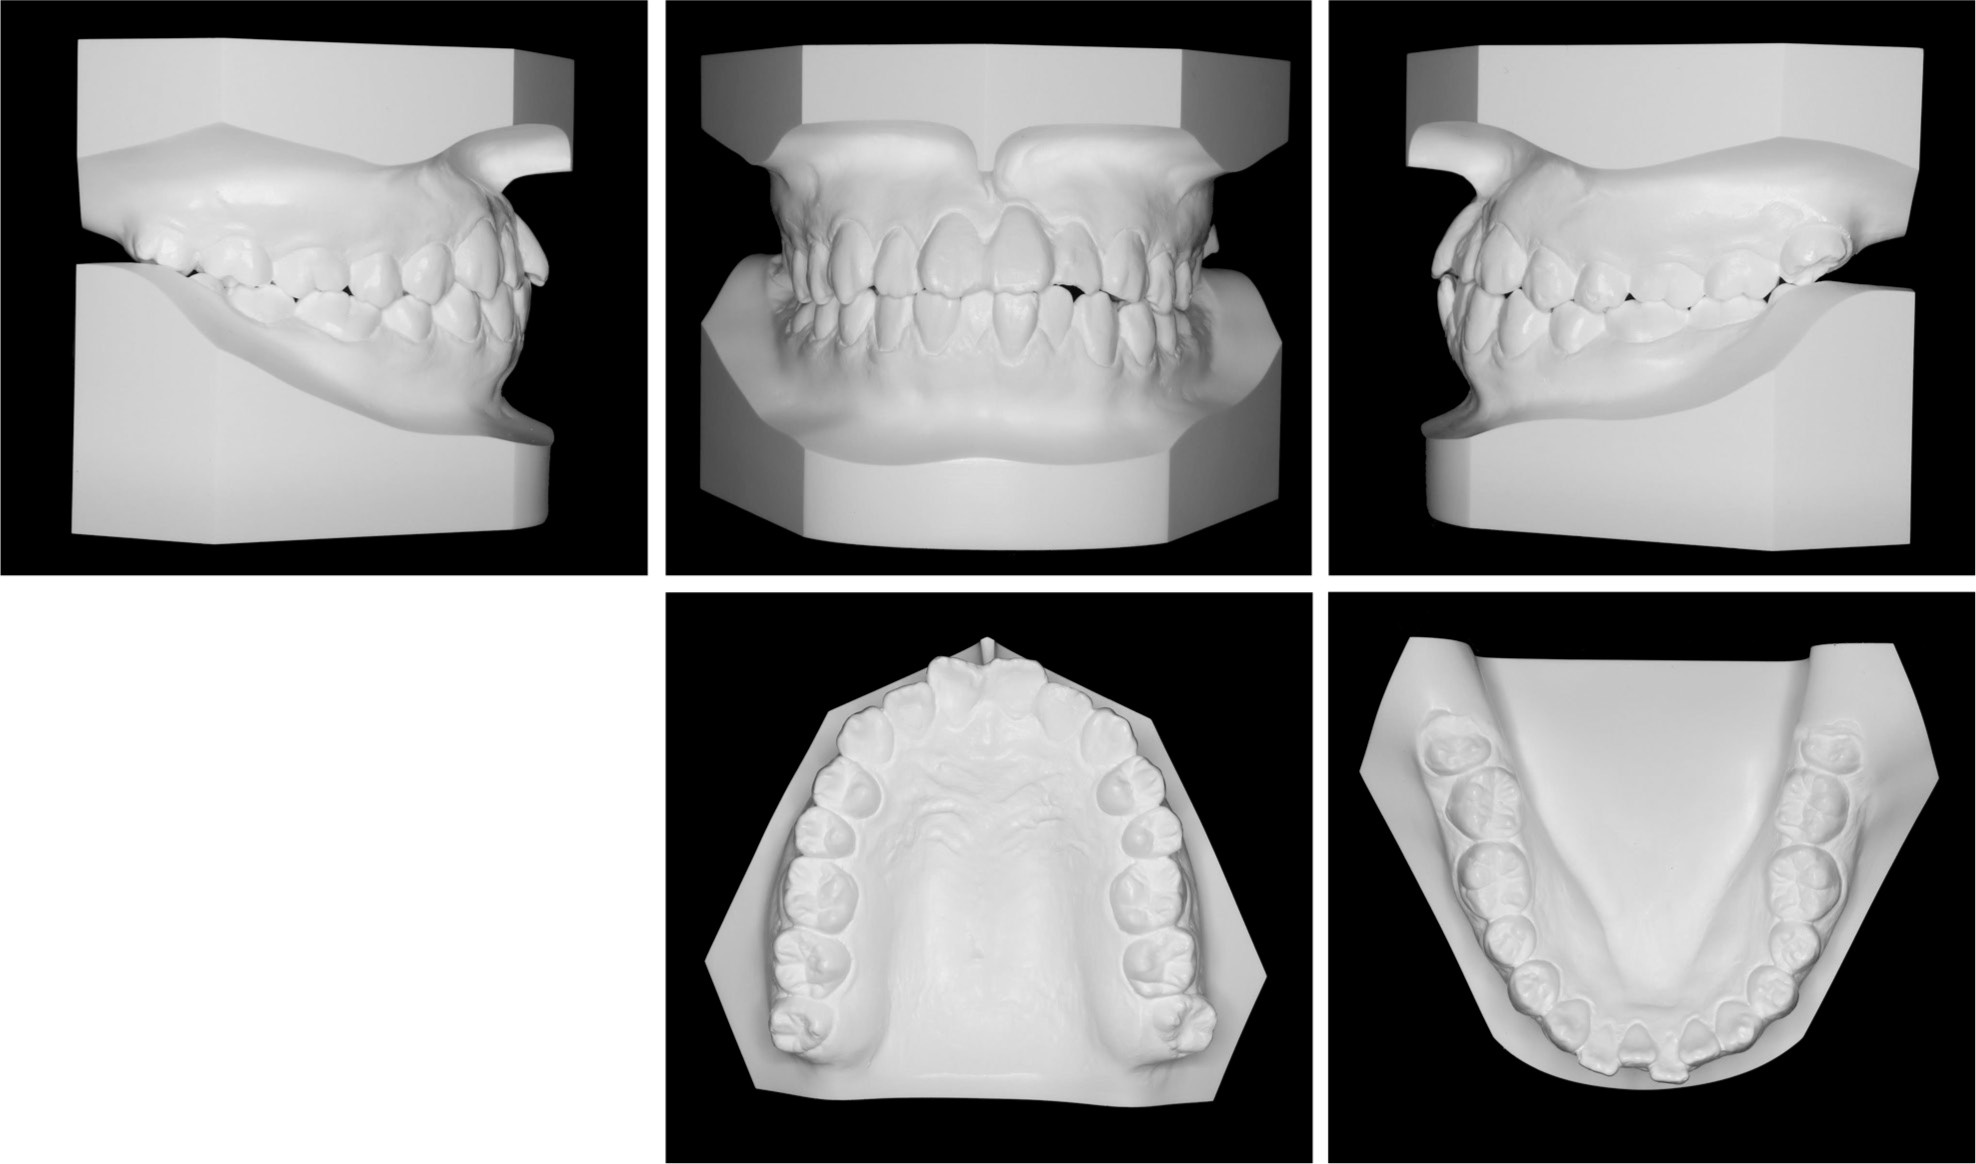
Figure 2.
Pretreatment dental casts.
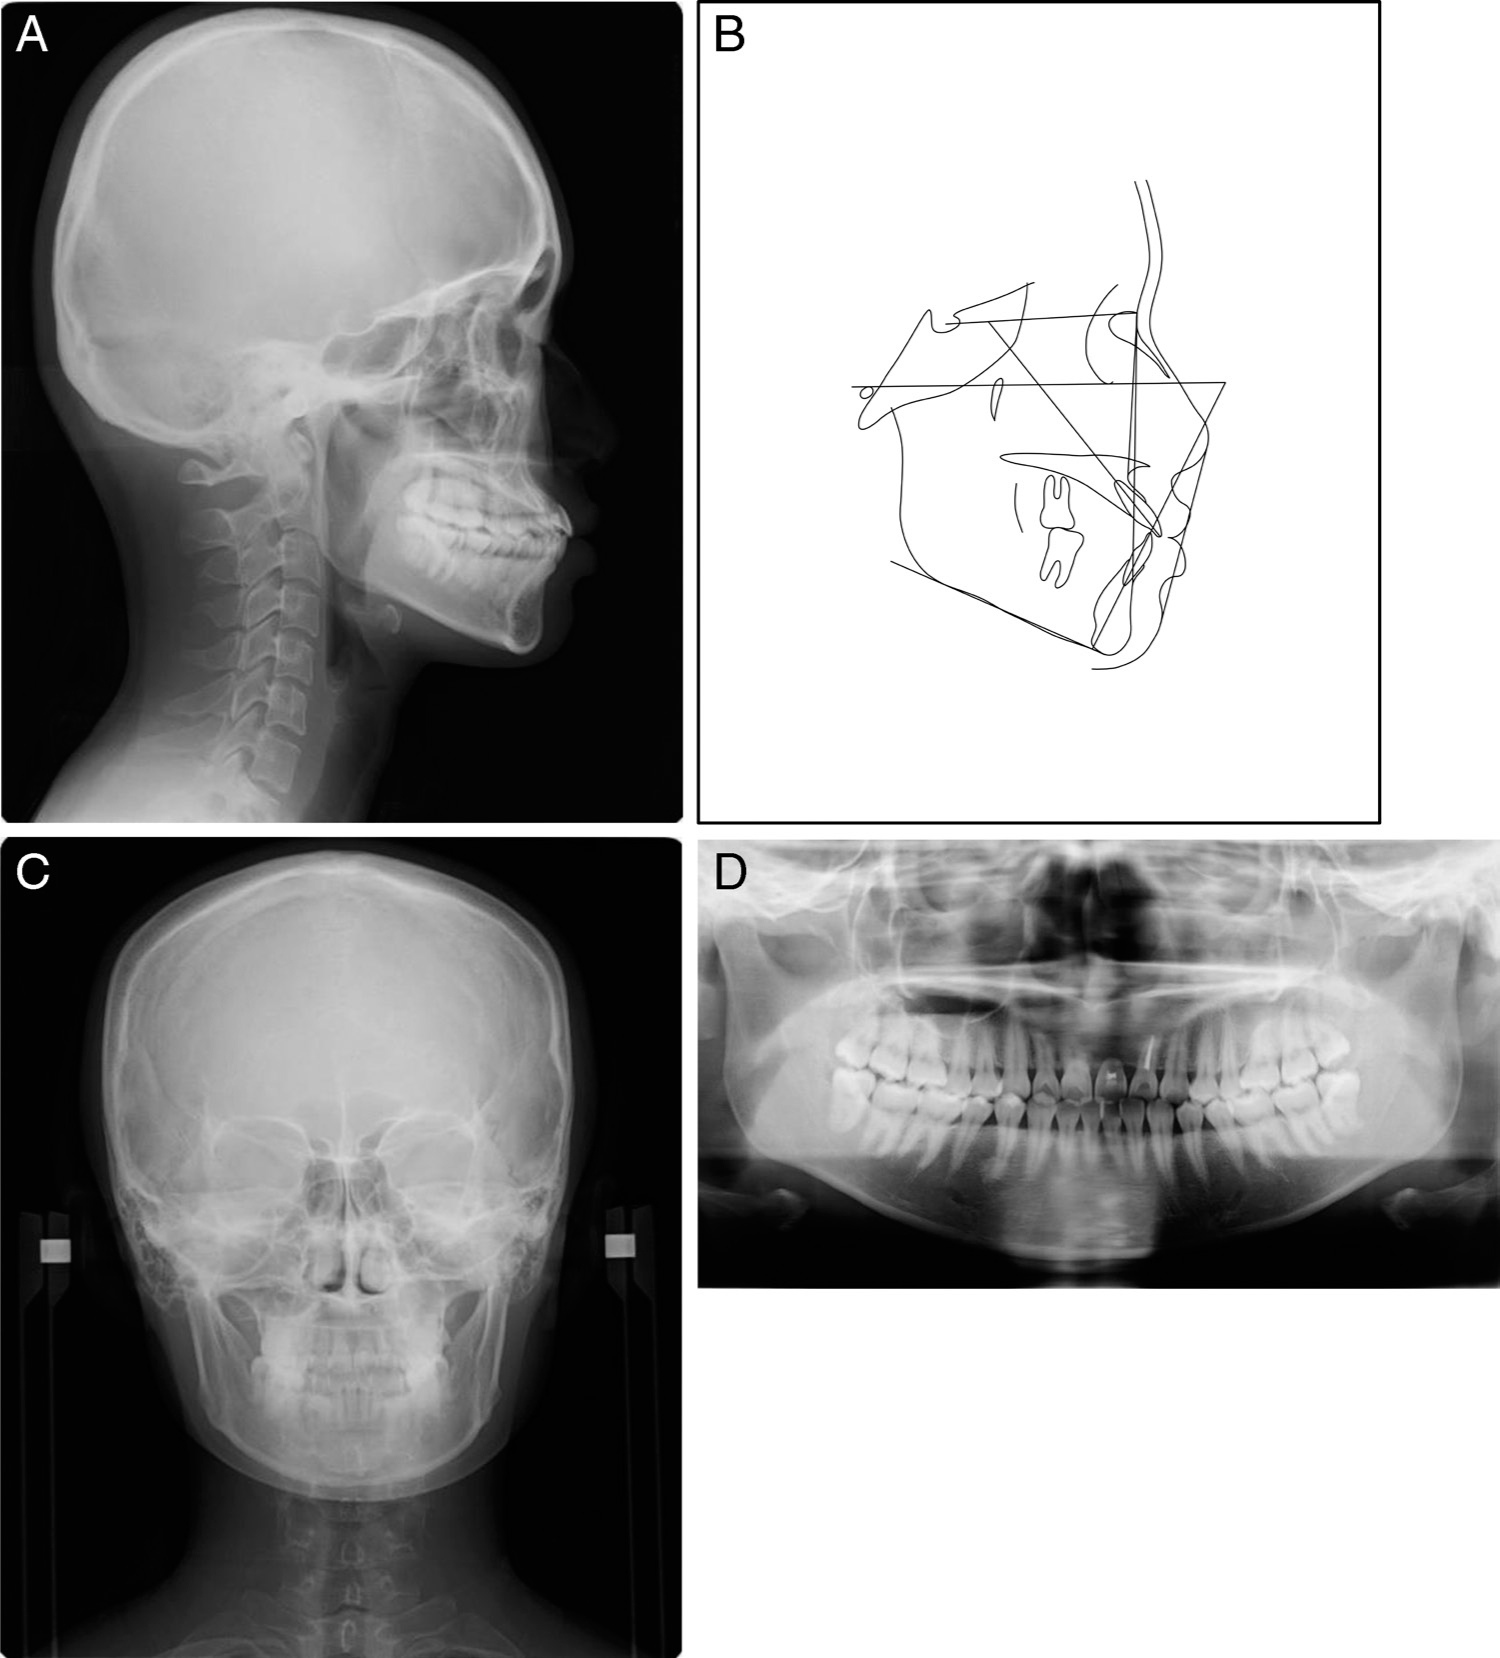
Figure 3.
Pretreatment cephalograms, a tracing of lateral cephalogram and a panoramic radiograph. (A) Lateral cephalogram. (B) Tracing. (C) Posteroanterior cephalogram. (D) Panoramic radiograph.
Table I.
Cephalometric summary.
| Japanese norm* | SD | Pretreatment | Posttreatment | Postretention | |
|---|---|---|---|---|---|
| (Adult female) | (23y1m) | (26y1m) | (28y6m) | ||
| Angular(°) | |||||
| SNA | 80.8 | 3.61 | 83.2 | 83.2 | 83.3 |
| SNB | 77.9 | 4.54 | 85.5 | 85.6 | 85.7 |
| ANB | 2.8 | 2.44 | -2.3 | -2.4 | -2.4 |
| Mp-SN | 37.1 | 4.64 | 26.9 | 25.8 | 25.5 |
| Gonial A | 122.1 | 5.29 | 117.5 | 117.8 | 117.6 |
| U1-SN | 105.9 | 8.79 | 125.1 | 123.1 | 121.4 |
| L1-FH | 56.0 | 8.09 | 63.4 | 71.7 | 69.9 |
| L1-Mp | 9.34 | 6.77 | 92.5 | 85.2 | 87 1 |
| Inter incisal angle | 123.6 | 10.64 | 115.6 | 126.0 | 126.0 |
| Linear (mm) | |||||
| S-N | 67.9 | 3.65 | 69.6 | 69.7 | 69.7 |
| N-Me | 125.8 | 5.04 | 124.7 | 123.2 | 122.9 |
| Me/NF | 68.6 | 3.71 | 69.4 | 67.6 | 67.5 |
| Go-Me | 71.4 | 4.14 | 77.0 | 77.2 | 77.1 |
| Ar-Go | 47.3 | 3.33 | 54.6 | 54.7 | 54.7 |
| Ar-Me | 106.6 | 5.74 | 117.1 | 117.4 | 117.4 |
| U1/NF | 31.0 | 2.34 | 25.3 | 23.5 | 24.4 |
| U6/NF | 24.6 | 2.00 | 24.4 | 24.3 | 24.4 |
| L1/Mp | 44.2 | 2.68 | 47.1 | 45.6 | 44.9 |
| L6/Mp | 32.9 | 2.50 | 36.1 | 33.4 | 33.4 |
| Overjet | 3.1 | 1.07 | 3.8 | 3.1 | 2.1 |
| Overbite | 3.3 | 1 89 | 1.3 | 1.7 | 1.9 |
| E-line to Upper lip | -2.5 | 1.90 | 0.5 | -1.0 | -1.1 |
| E-line to Lower lip | 0.9 | 1.90 | 3.3 | 0.0 | 0.7 |
1 * Japanese norms and standard deviations from Wada et al11.
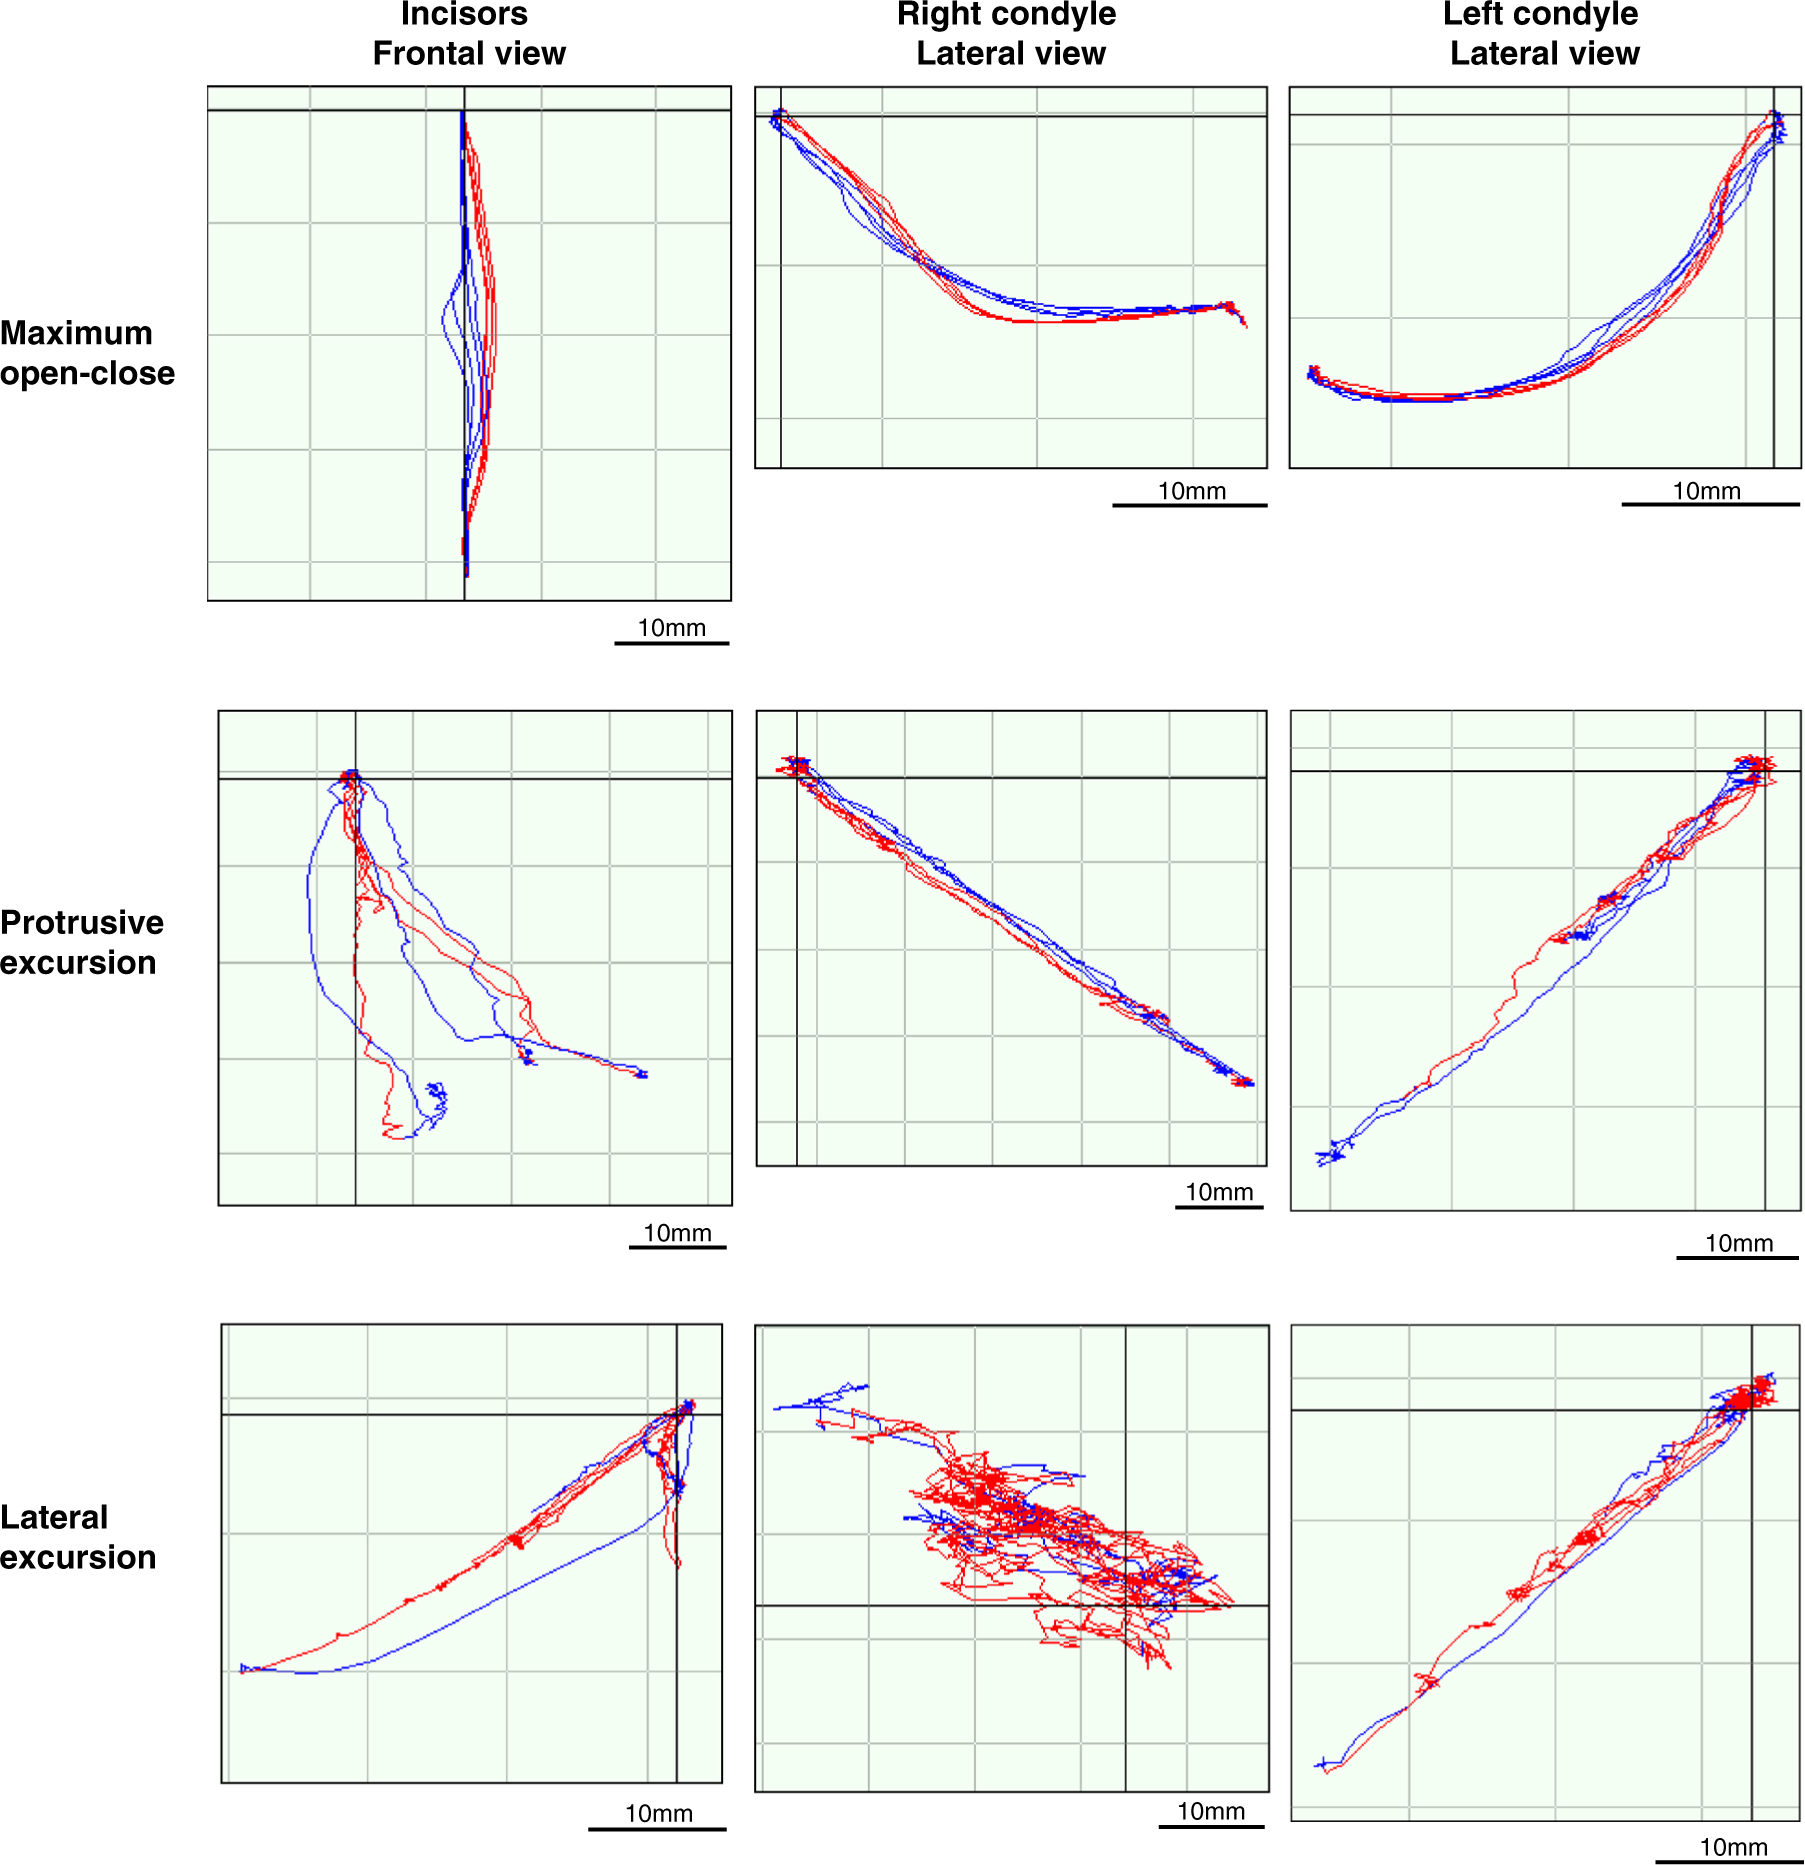
Figure 4.
Pretreatment condylar movements and incisal paths as detected using a 6 degrees of freedom jaw movement recording system. Opening and closing, protrusive, and lateral jaw movements. The red line indicates the opening phase, and the blue line indicates the closing phase.
Table II.
Maximum gap and displacement from the centric occlusion at each point.
| Japanese norm* | SD | Pretreatment | Posttreatment | Postretention | |
|---|---|---|---|---|---|
| (Adult female) | (23y1m) | (26y1m) | (28y6m) | ||
| Maximum gap (mm) | |||||
| at right condyle | 13.1 | 2.7 | 15.2 | 11.7 | 13.4 |
| at left condyle | 13.1 | 3.8 | 15.1 | 14.3 | 14.8 |
| at lower incisor | 44.8 | 6.4 | 55.2 | 54.0 | 46.0 |
| Maximum displacement during protrusive excursive movement (mm) | |||||
| at right condyle | 7.6 | 1.6 | 6.2 | 7.3 | 6.2 |
| at left condyle | 7.6 | 1.6 | 4.9 | 5.9 | 6.0 |
| at lower incisor | 7.2 | 1.5 | 5.4 | 6.3 | 5.8 |
| Maximum displacement during right lateral excursive movement(mm) | |||||
| at left condyle | 9.1 | 2.7 | 3.7 | 4.6 | 5.7 |
| at lower incisor | 8.3 | 2.1 | 3.7 | 3.0 | 4.9 |
| Maximum displacement during left lateral excursive movement (mm) | |||||
| at right condyle | 9.1 | 2.7 | 0.4 | 4.1 | 6.0 |
| at lower incisor | 8.3 | 2.1 | 1.0 | 2.9 | 4.7 |
2 * Japanese norms and standard deviations for the maximum gap based on Miyavvaki et al.12 Japanese norms and standard deviations for maximum displacement based on our unpublished findings.
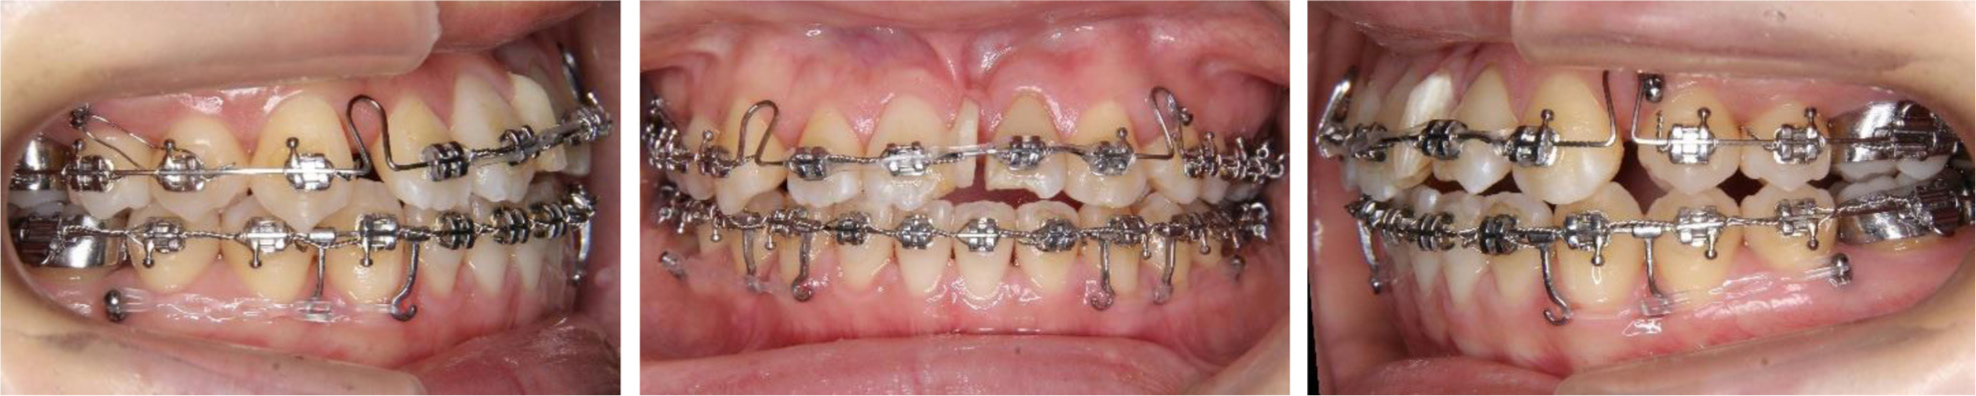
Figure 5.
Intraoral photographs of the treatment progress. Retraction of the maxillary anterior teeth and distalization of the mandibular dentition.
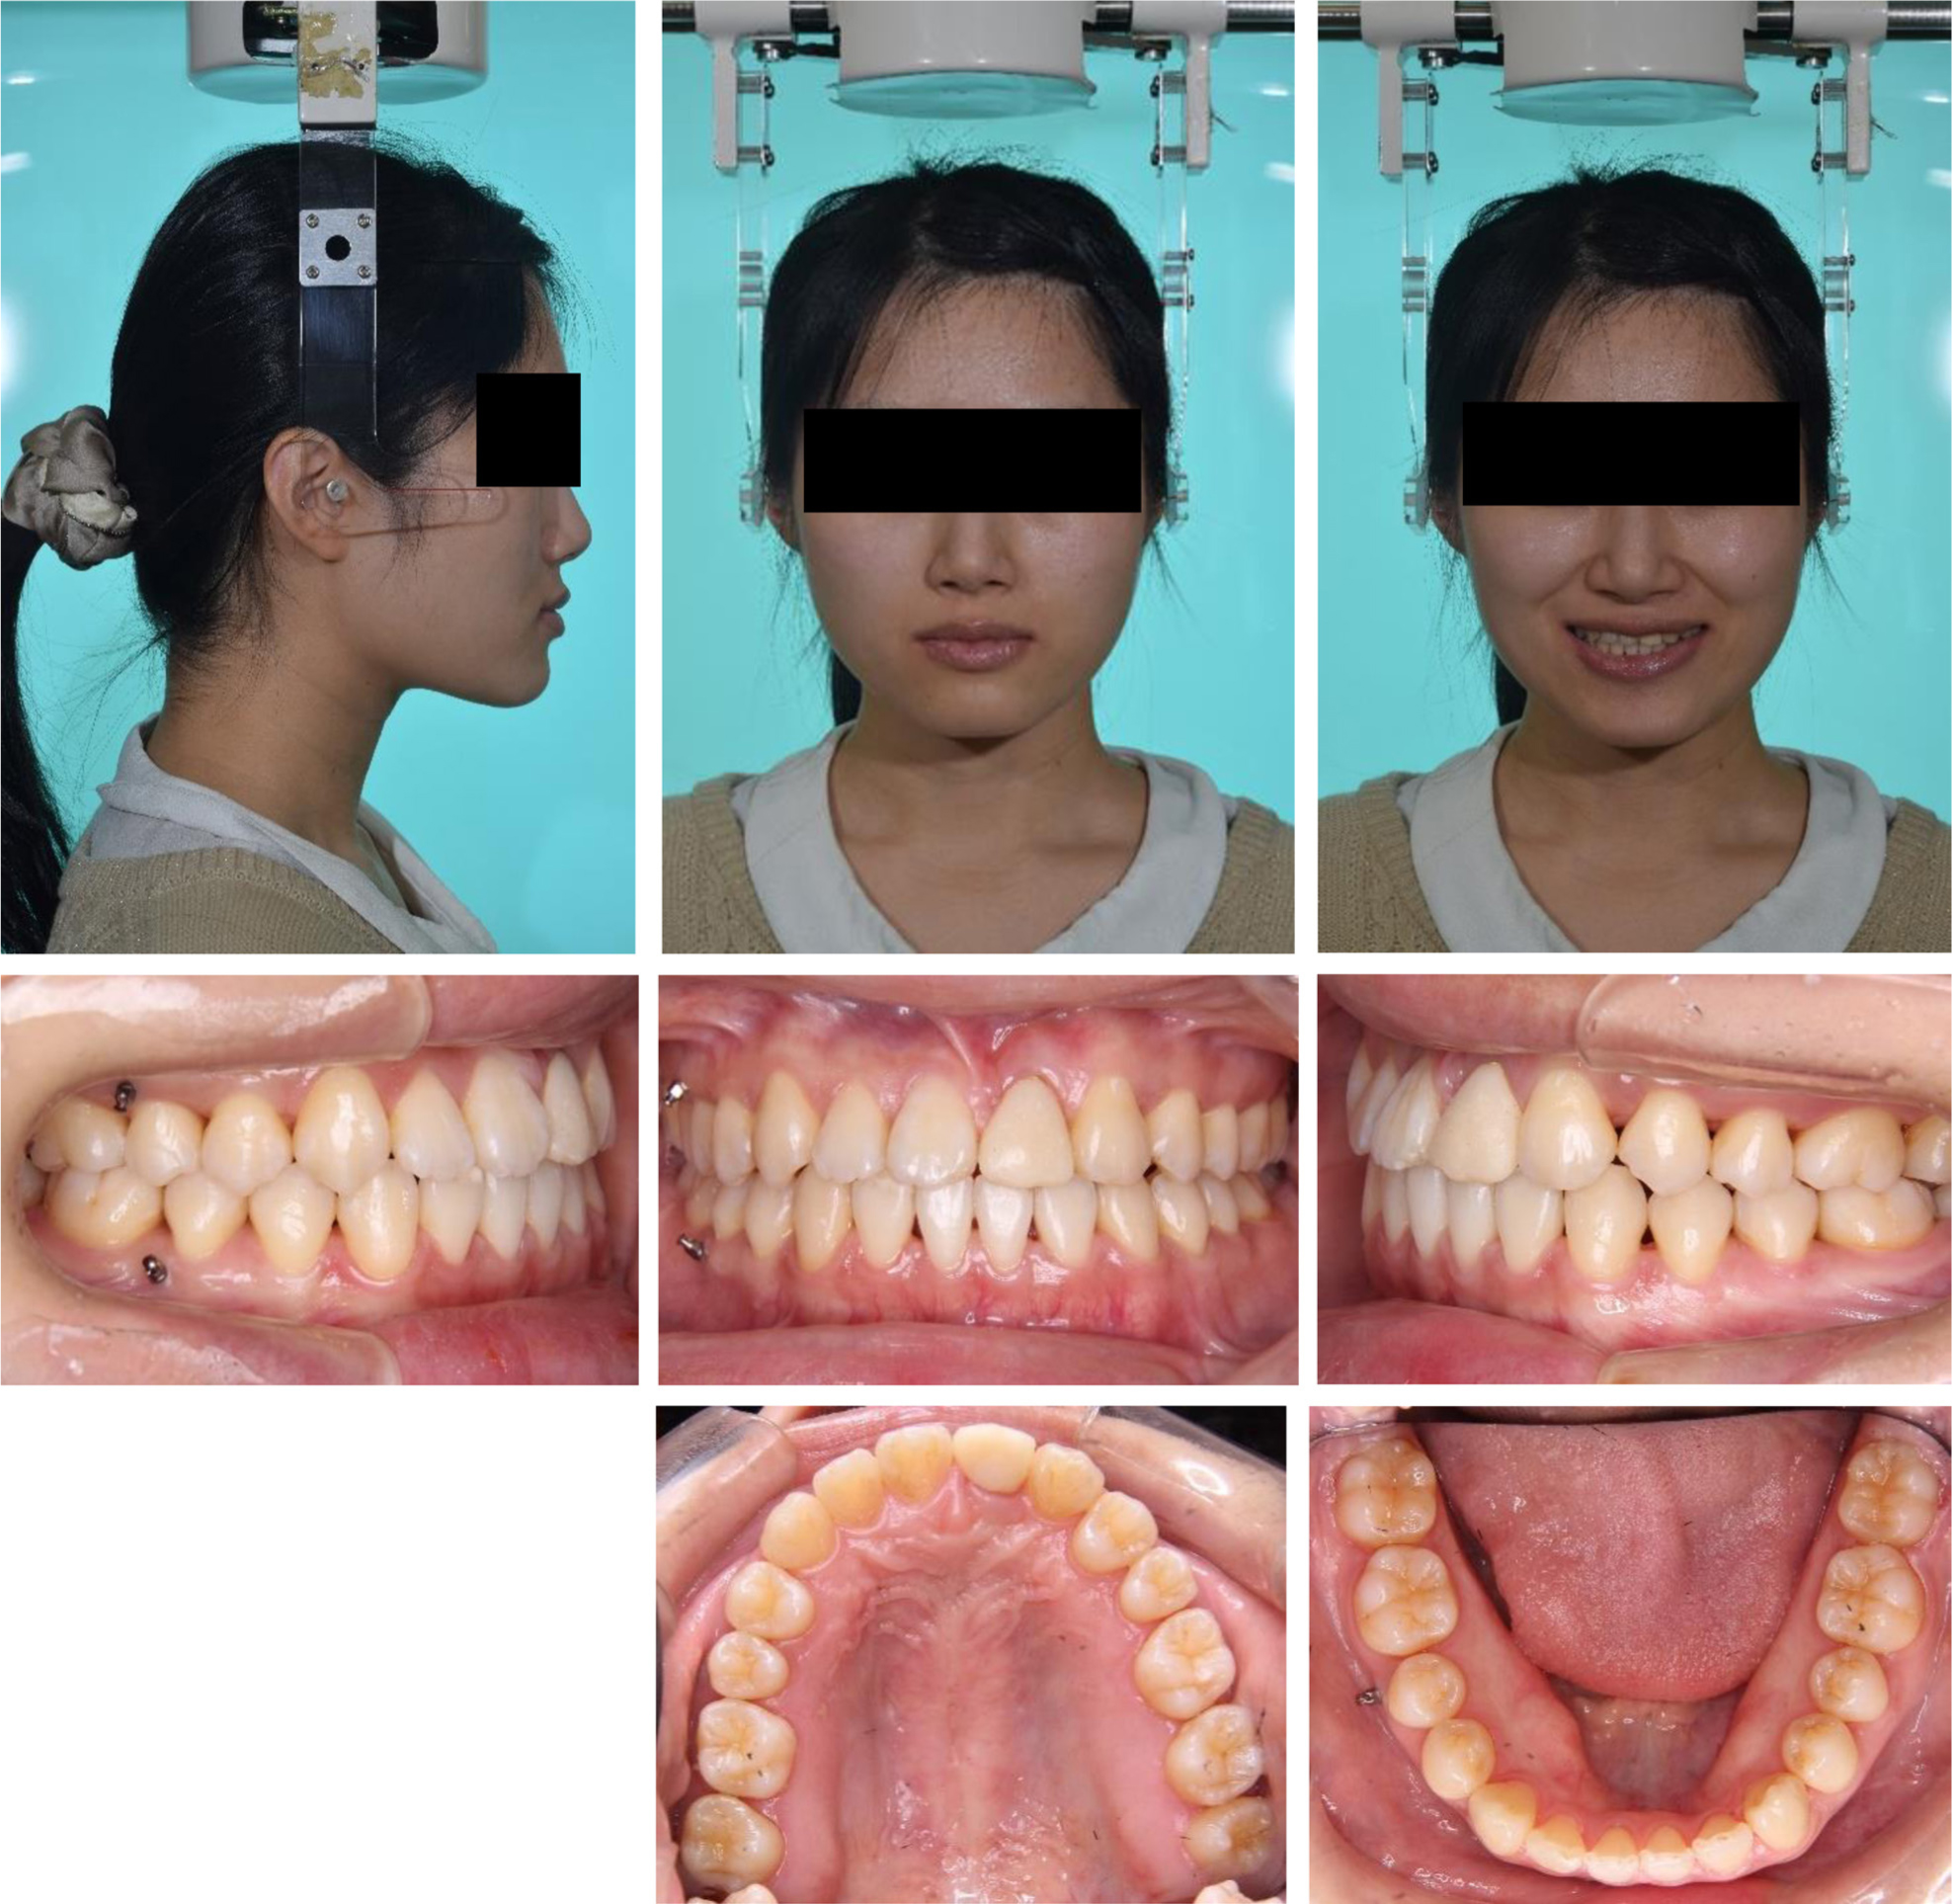
Figure 6.
Posttreatment facial and intraoral photographs.
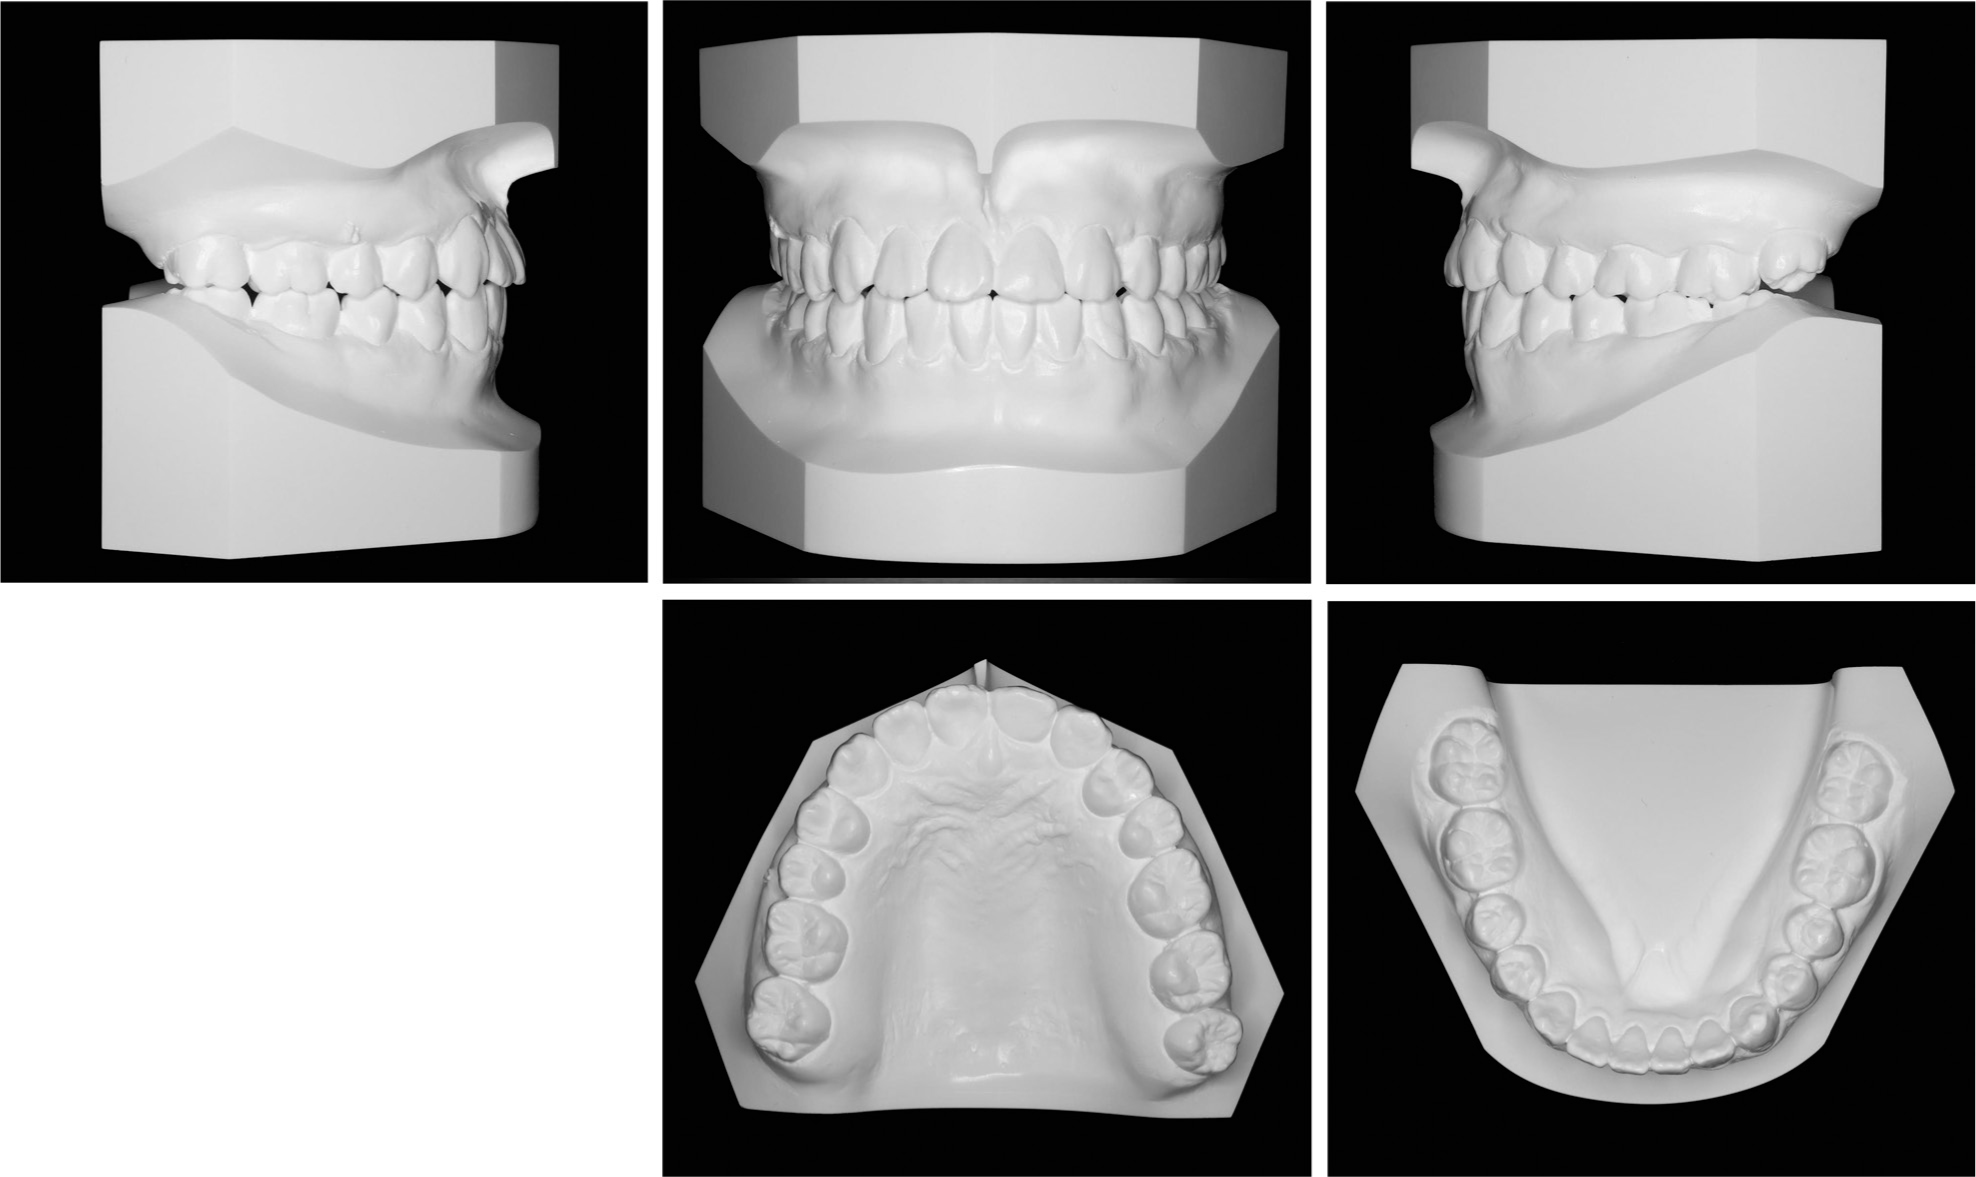
Figure 7.
Posttreatment dental casts.
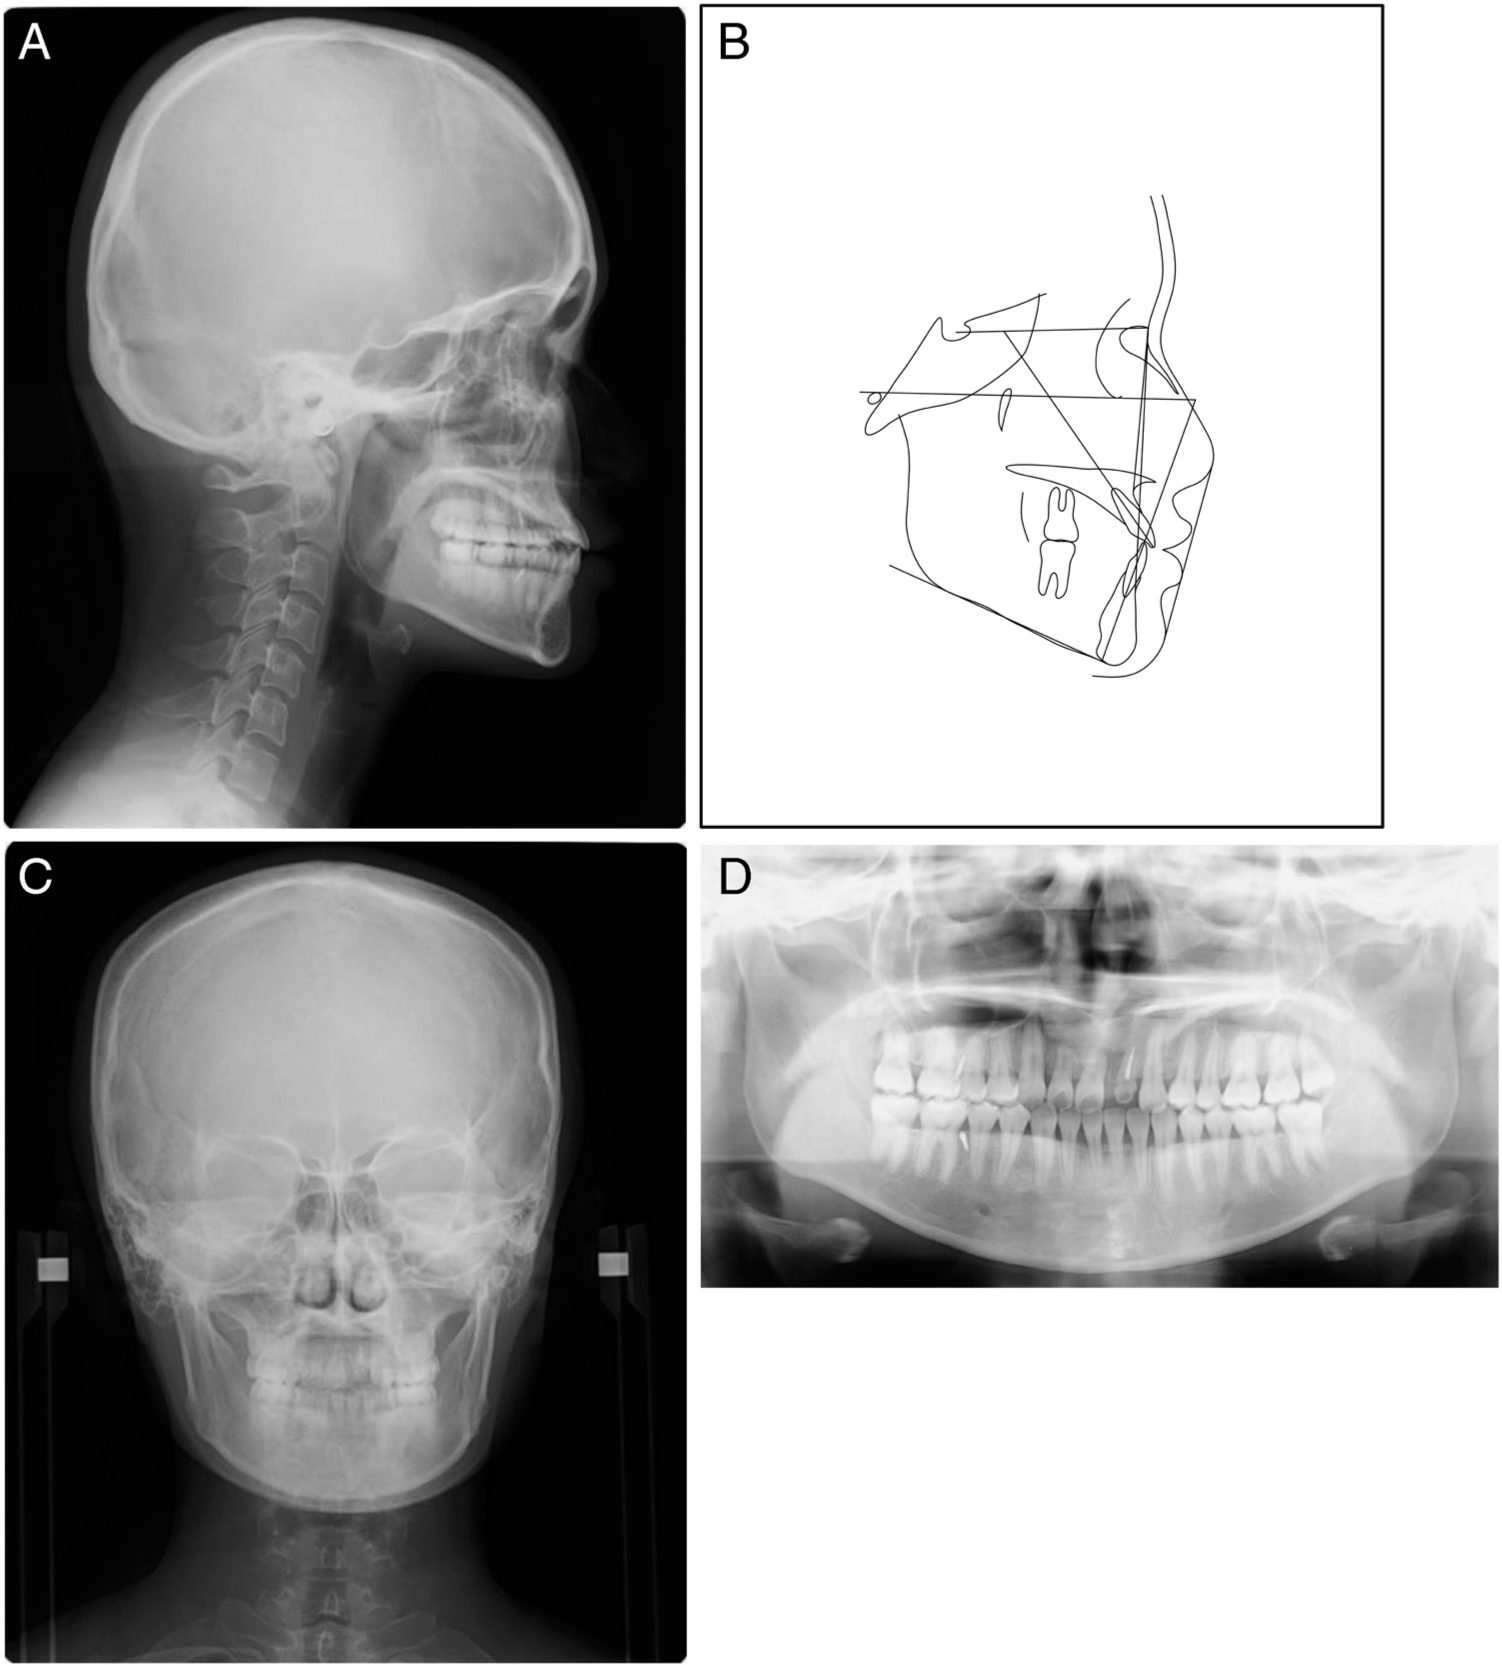
Figure 8.
Posttreatment cephalograms, a tracing of lateral cephalogram and a panoramic radiograph. (A) Lateral cephalogram. (B) Tracing. (C) Posteroanterior cephalogram. (D) Panoramic radiograph.
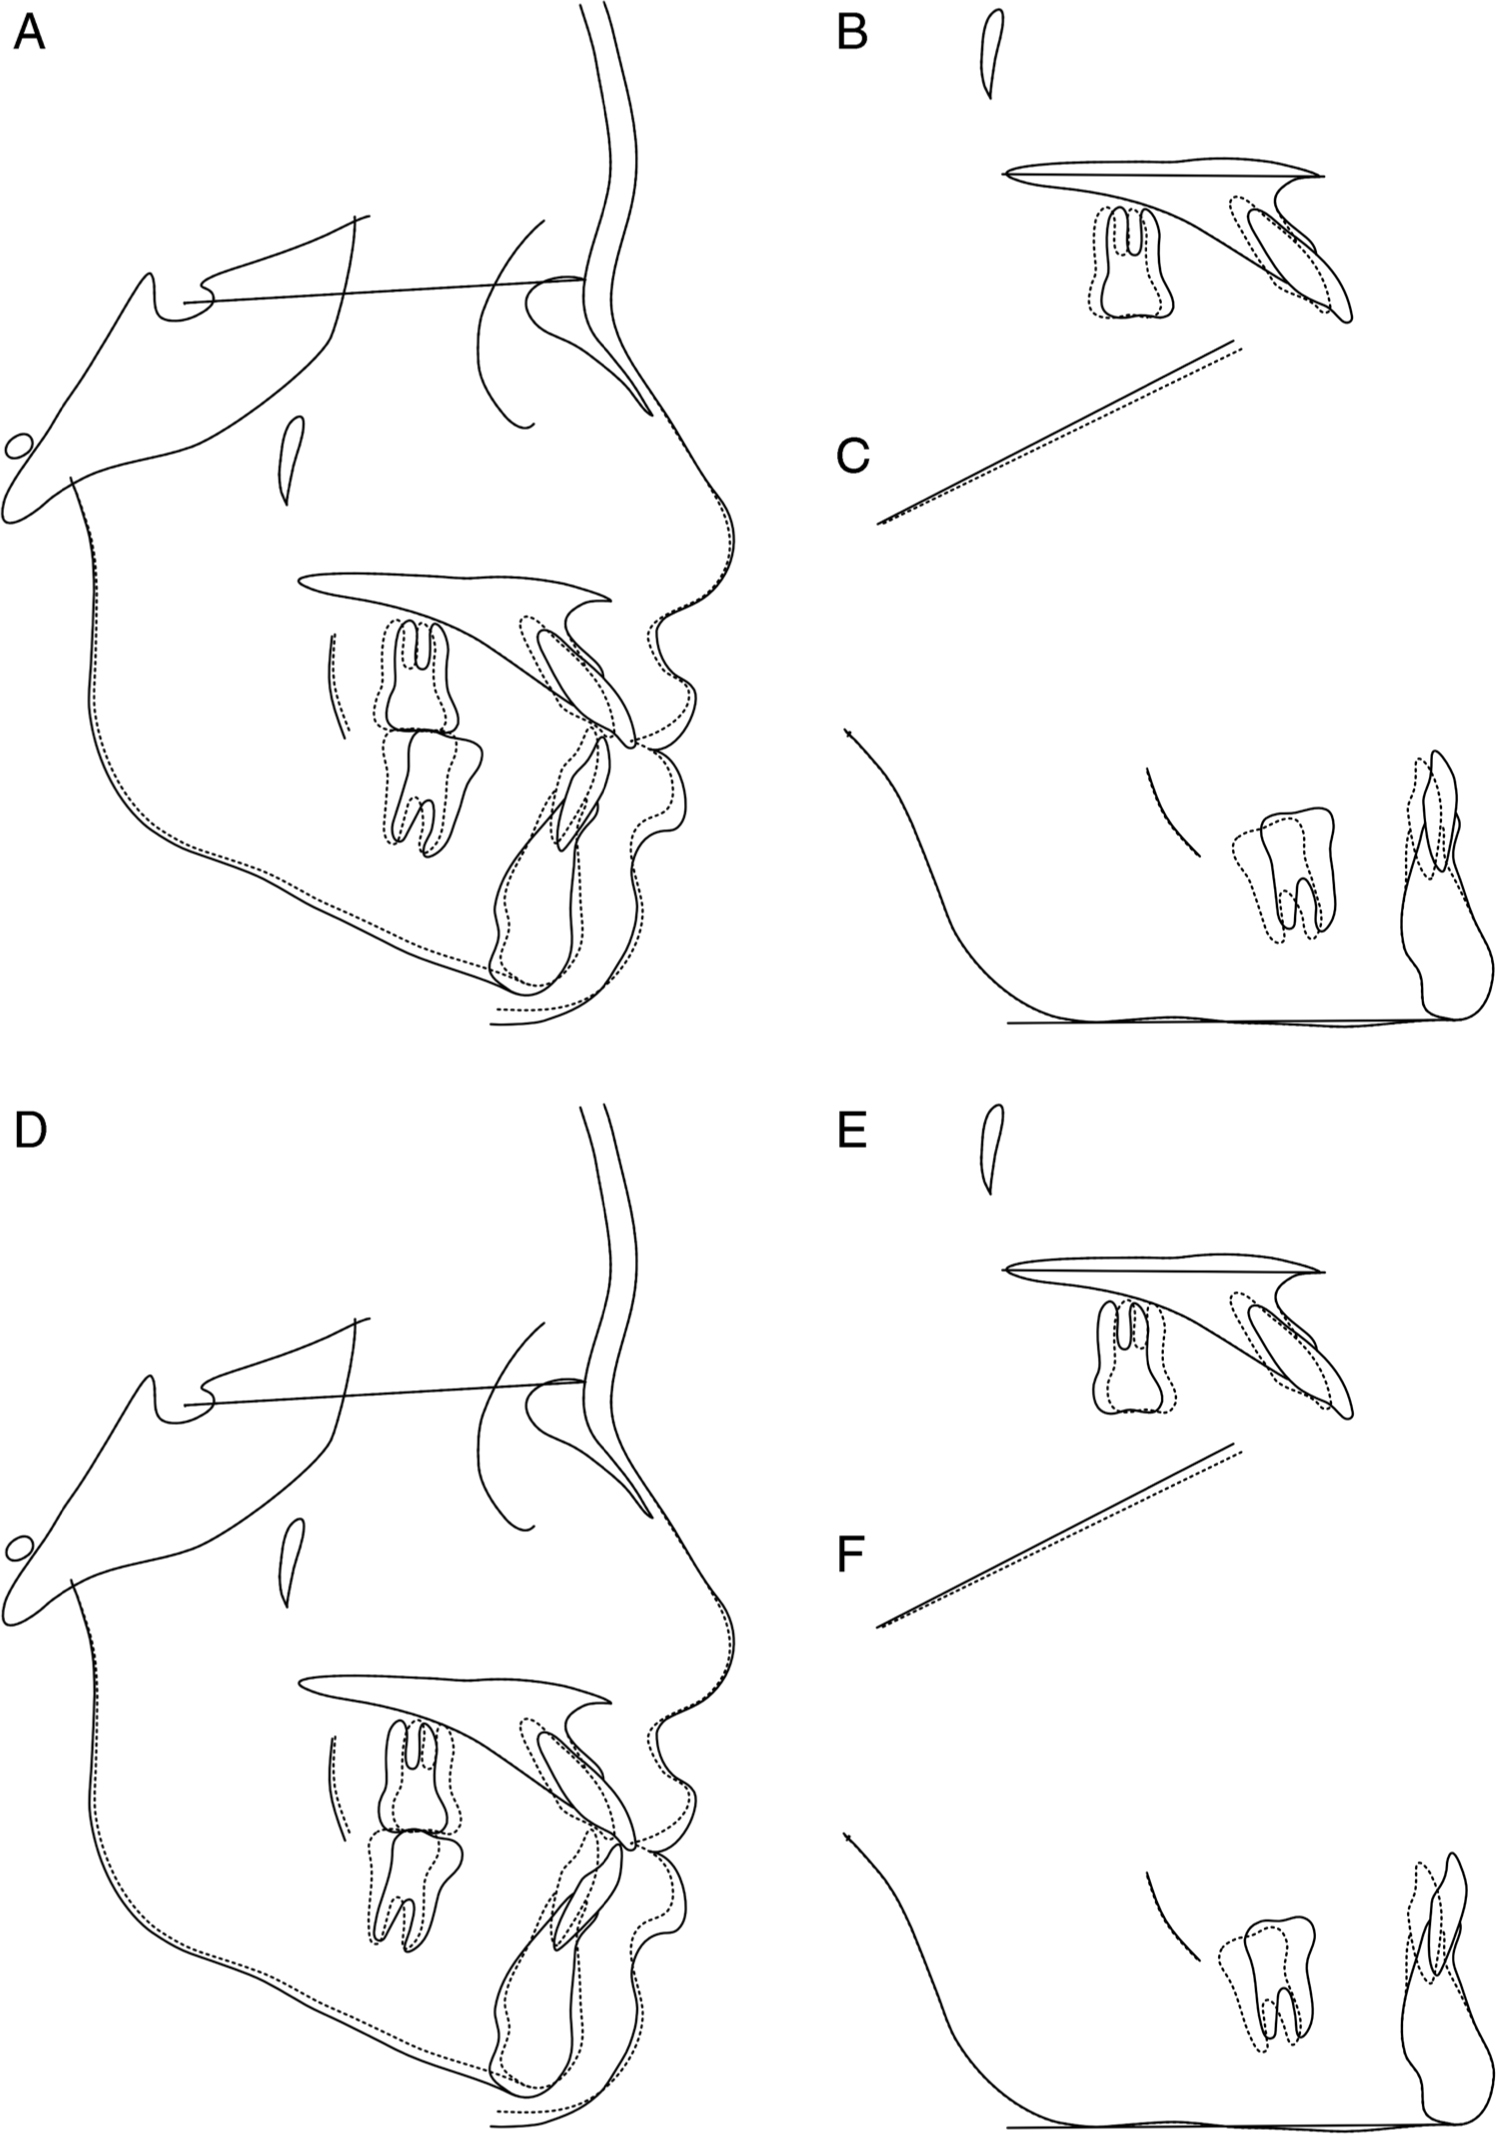
Figure 9.
Superimposition of the cephalometric tracings obtained at pretreatment (solid line) and posttreatment (dotted line). (A, D) The sella-nasion plane at the sella. (B, E) The palatal plane at the ANS. (C, F) The mandibular plane at the menton. (A–C) The right incisors and molars. (D–F) The left incisors and molars.
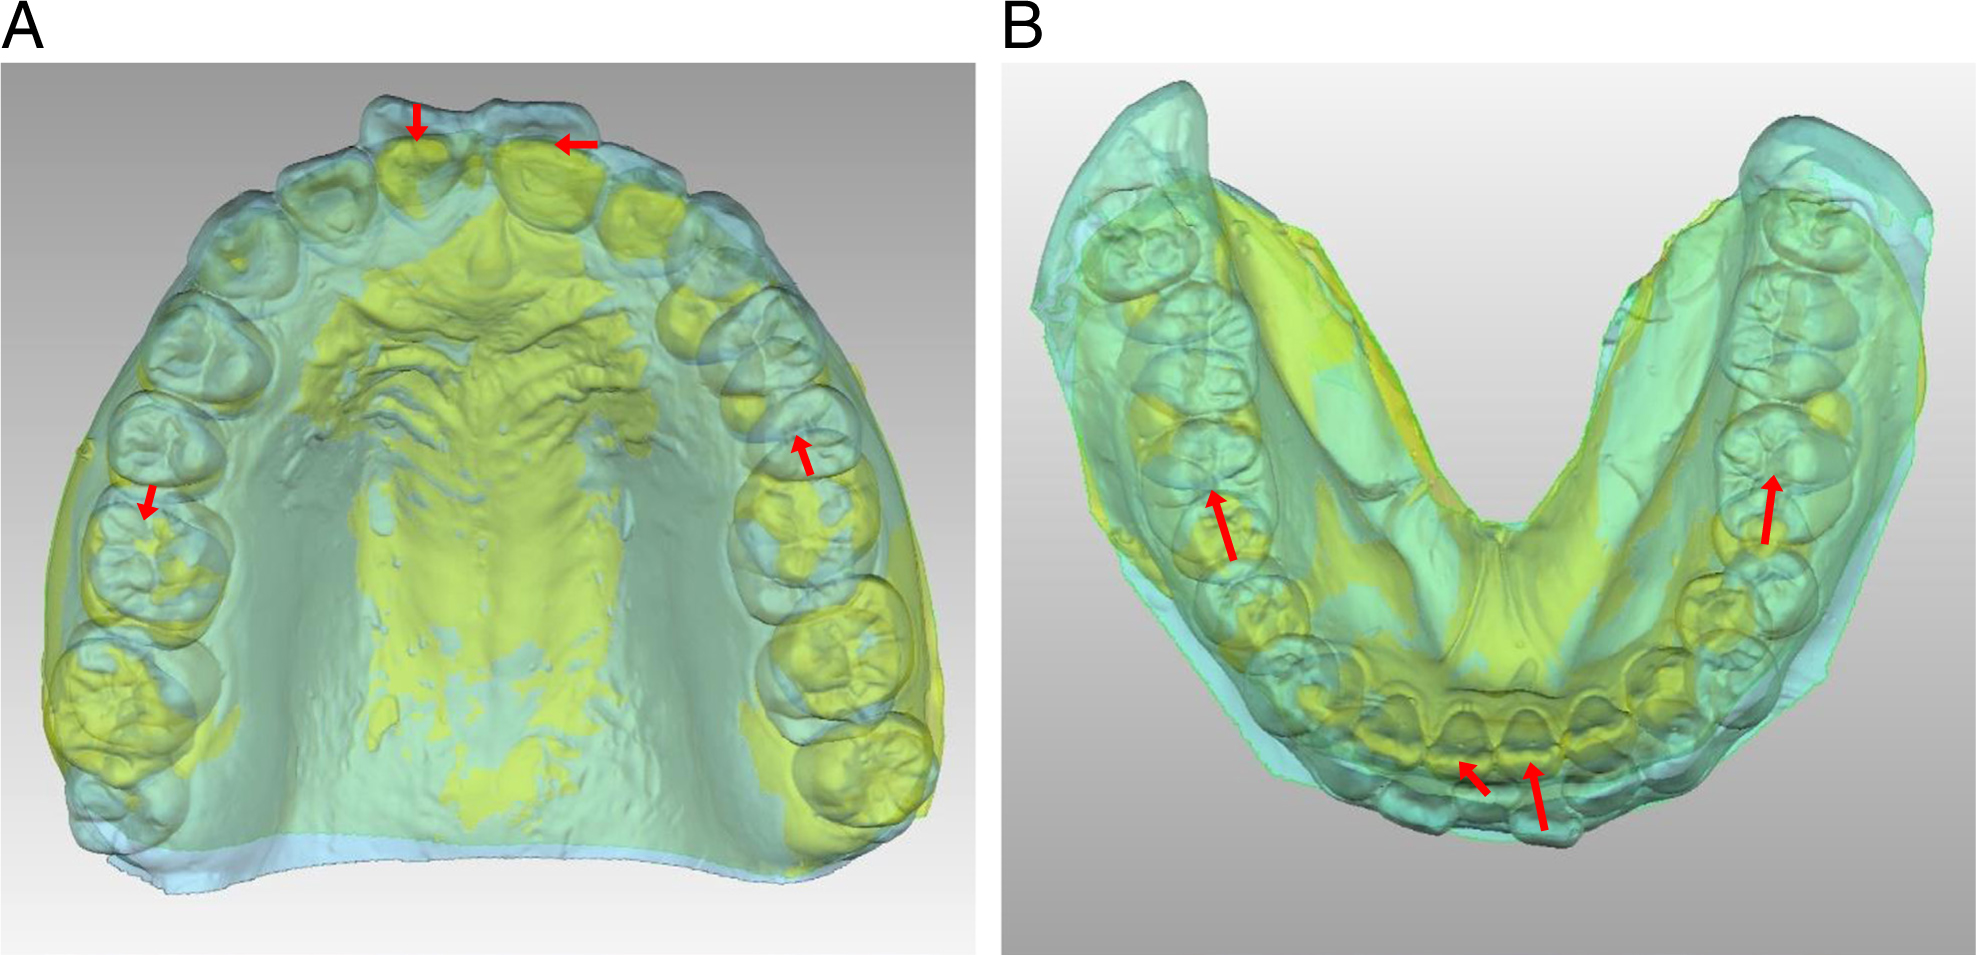
Figure 10.
Superimposition of dental casts at pretreatment (light blue) and posttreatment (yellow-green) captured by a three-dimensional scanner. (A) The maxillary dental casts were superimposed at palate regions including the third palatal rugae.13,14 (B) The mandibular dental casts were superimposed at the mandibular torus.15 Red arrows indicate the movement of the upper and lower incisors and molars.
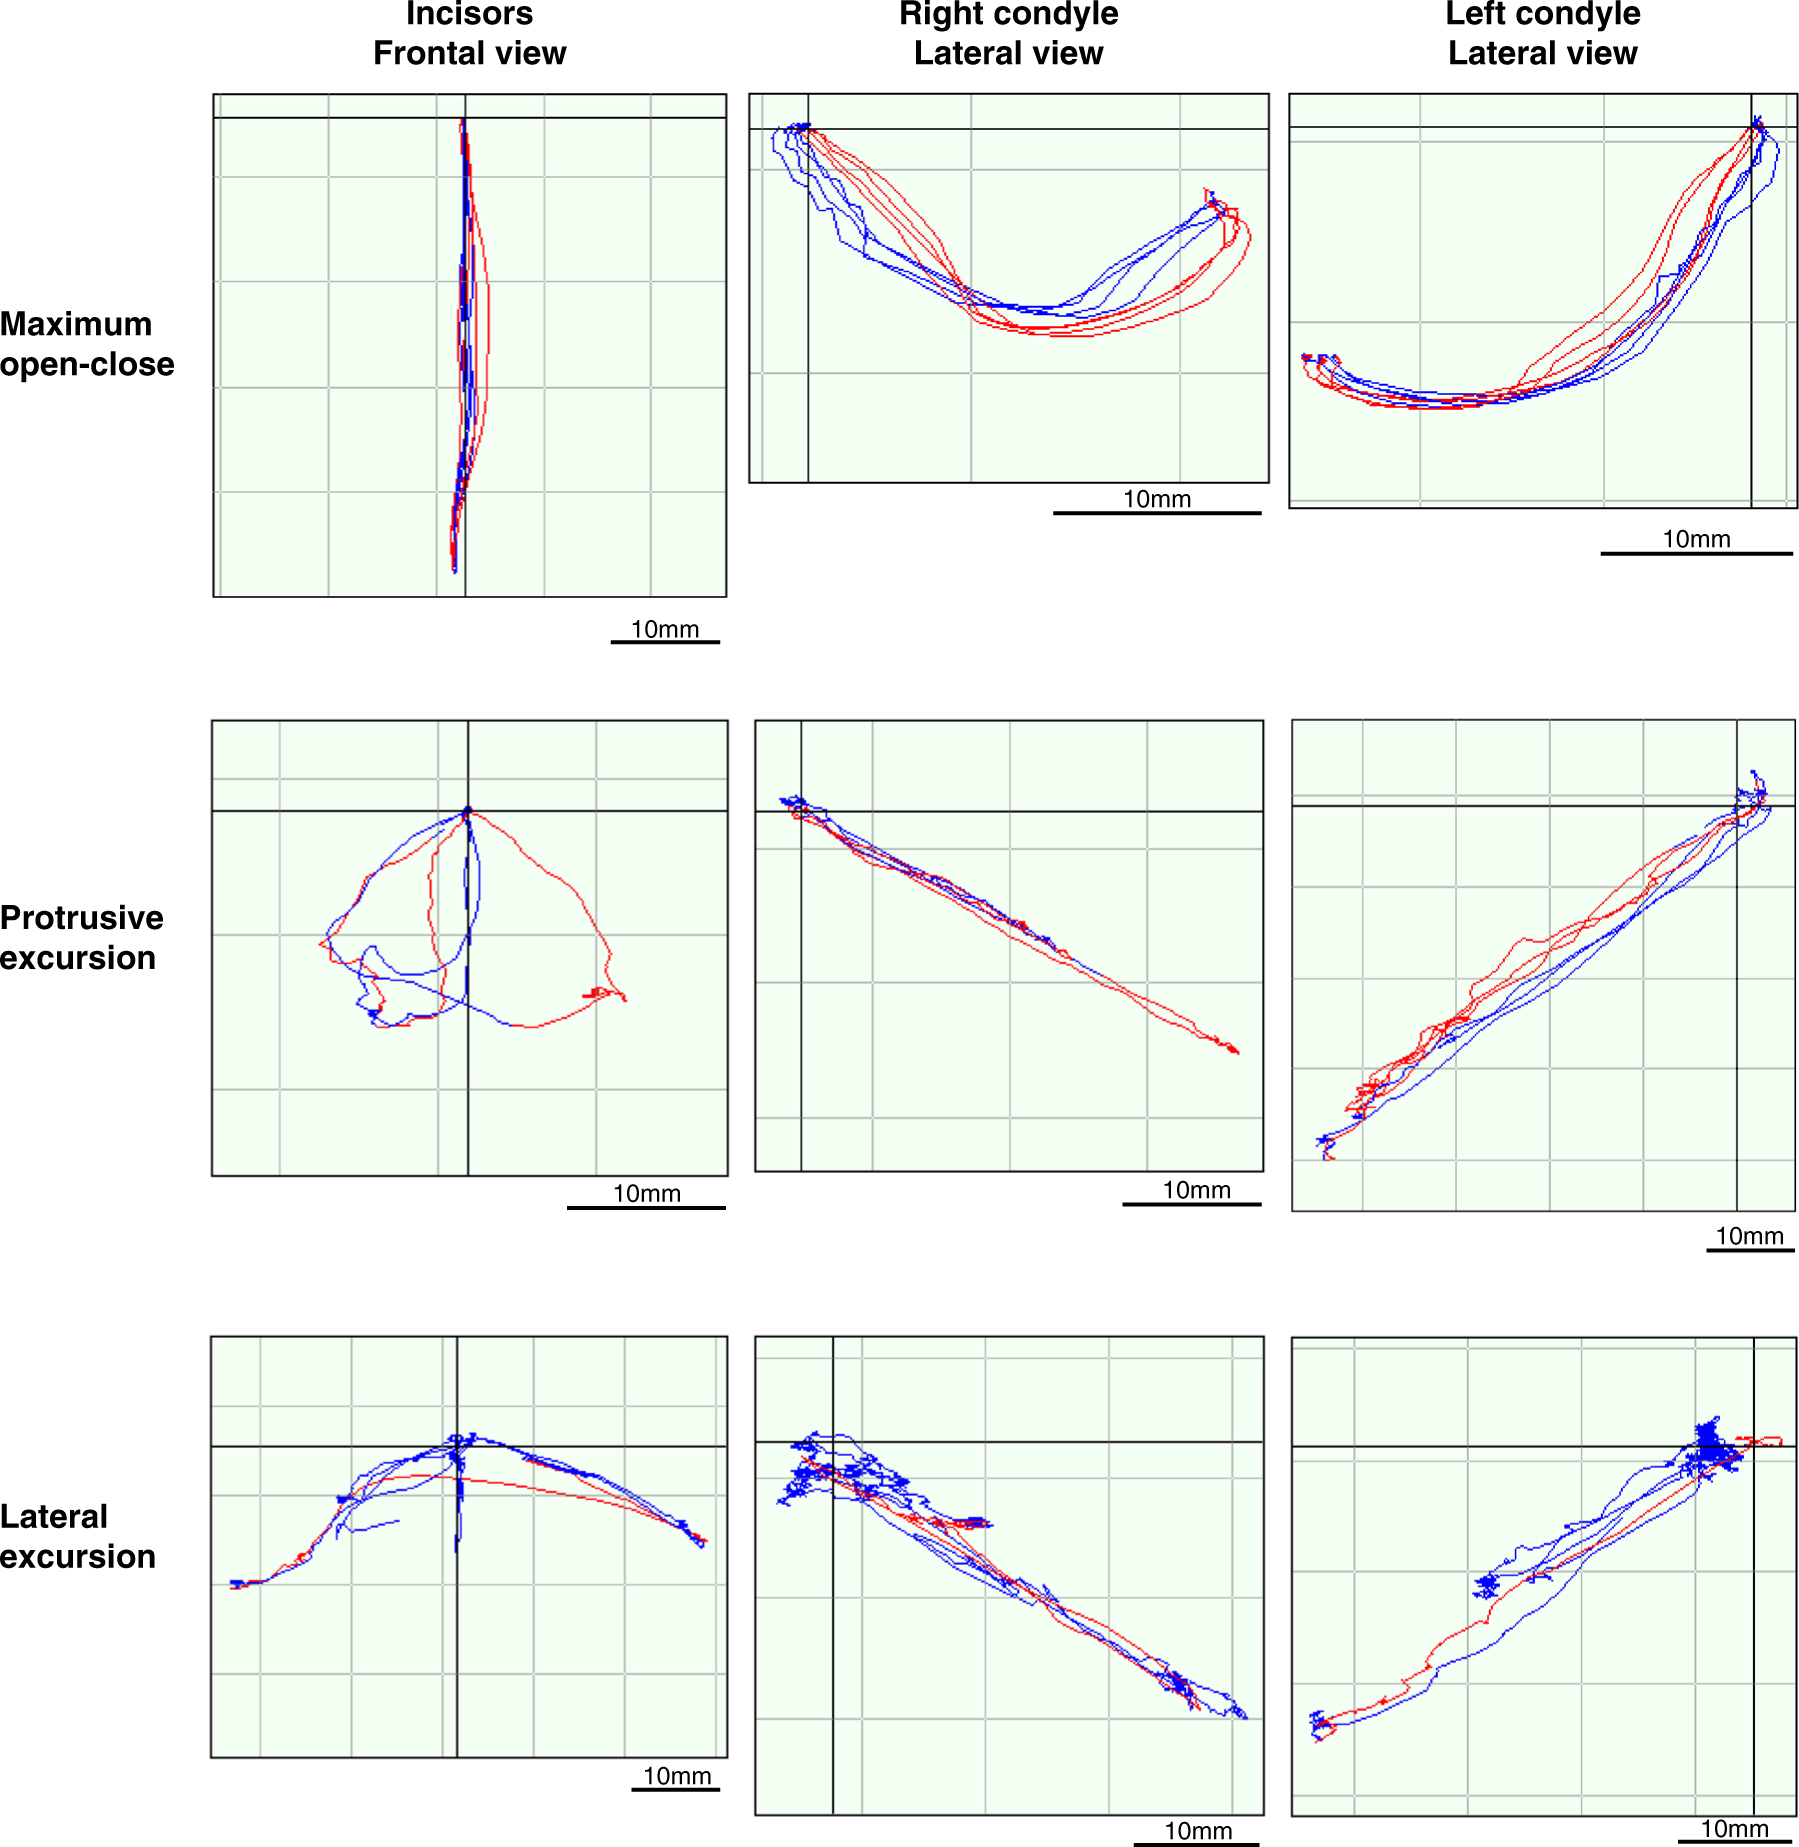
Figure 11.
Posttreatment condylar movements and incisal paths as detected using a 6 degrees of freedom jaw movement recording system. Opening and closing, protrusive, and lateral jaw movements. The red line indicates the opening phase, and the blue line indicates the closing phase.
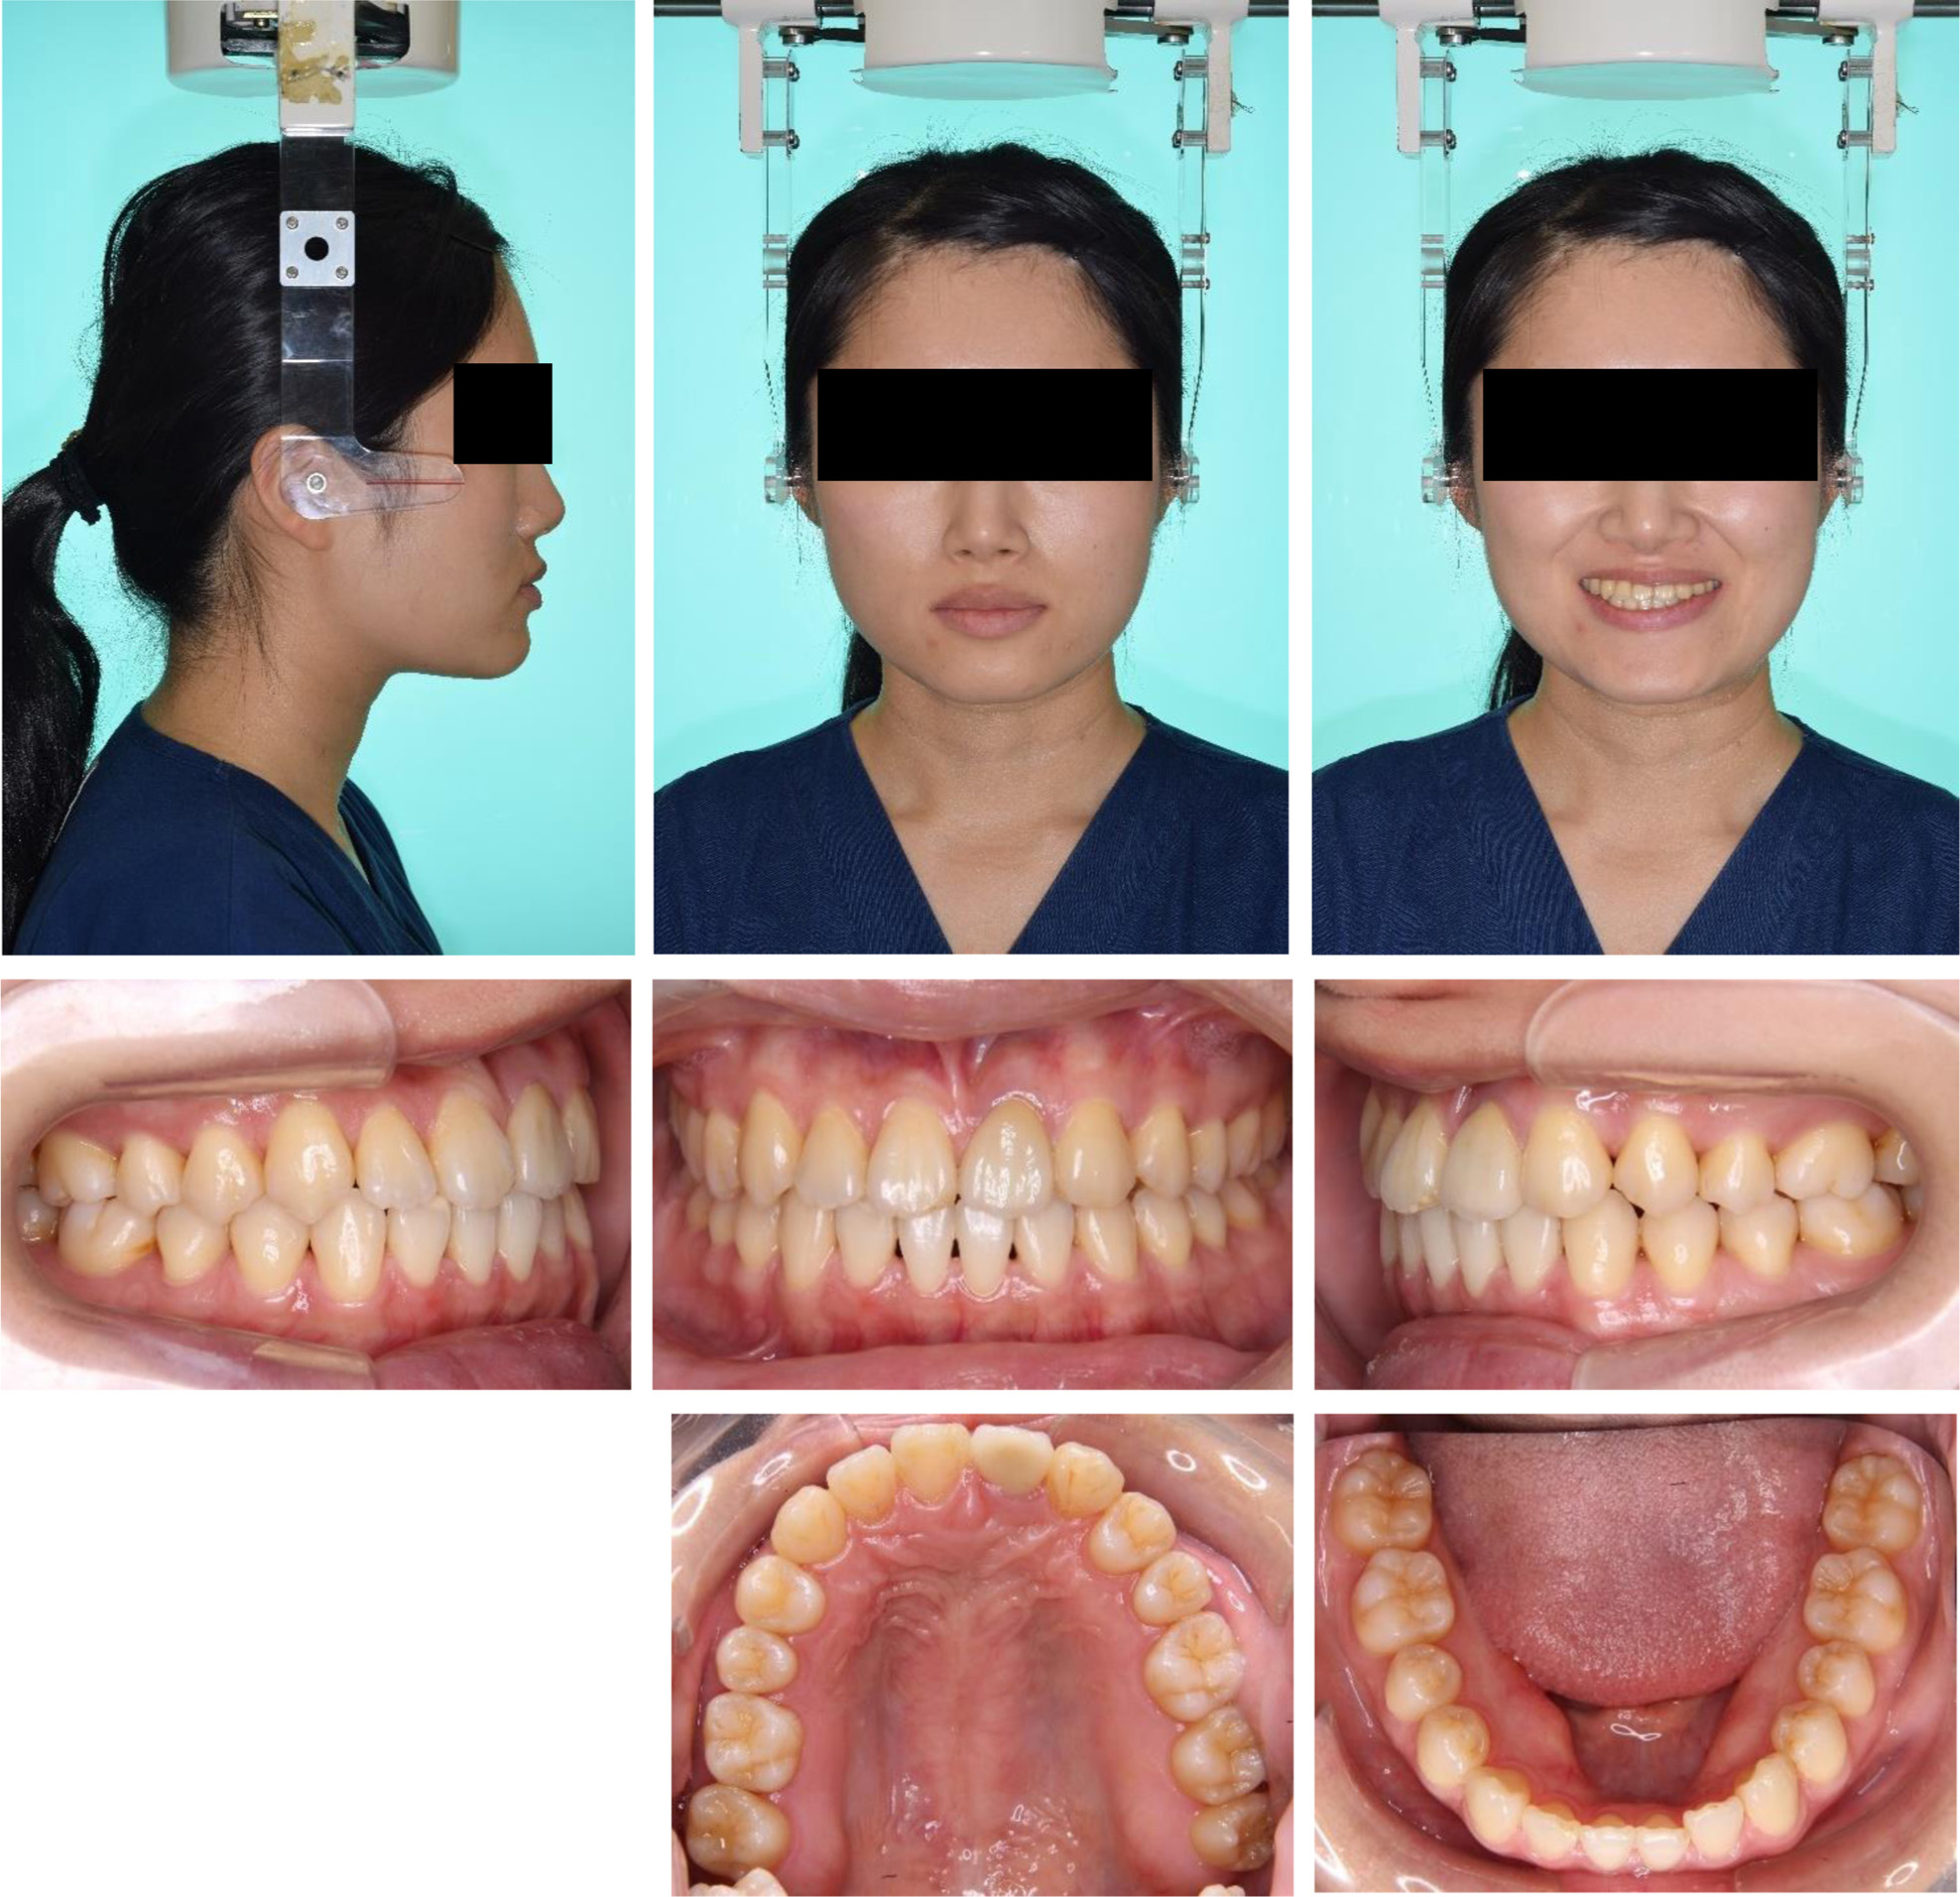
Figure 12.
Postretention facial and intraoral photographs.
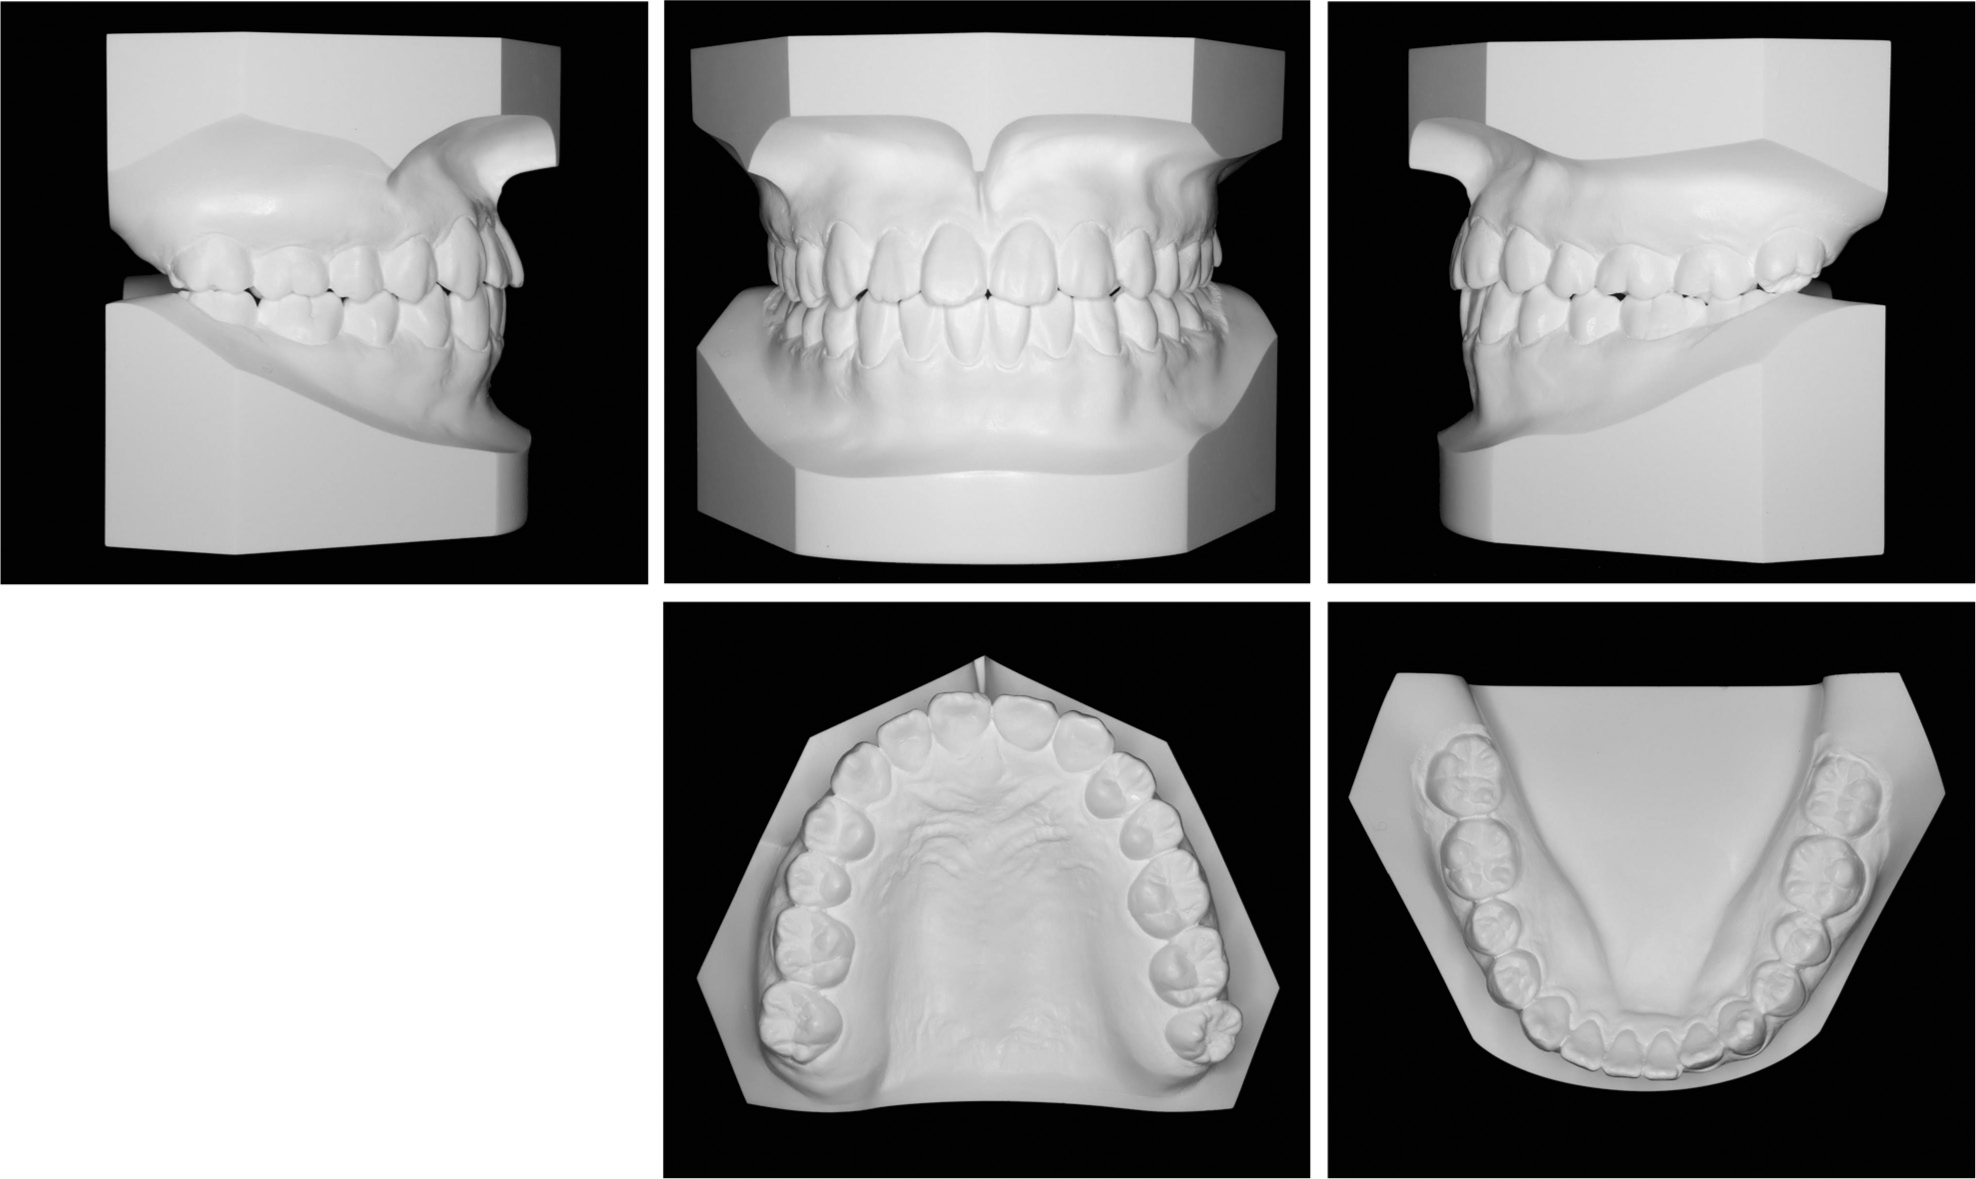
Figure 13.
Postretention dental casts.
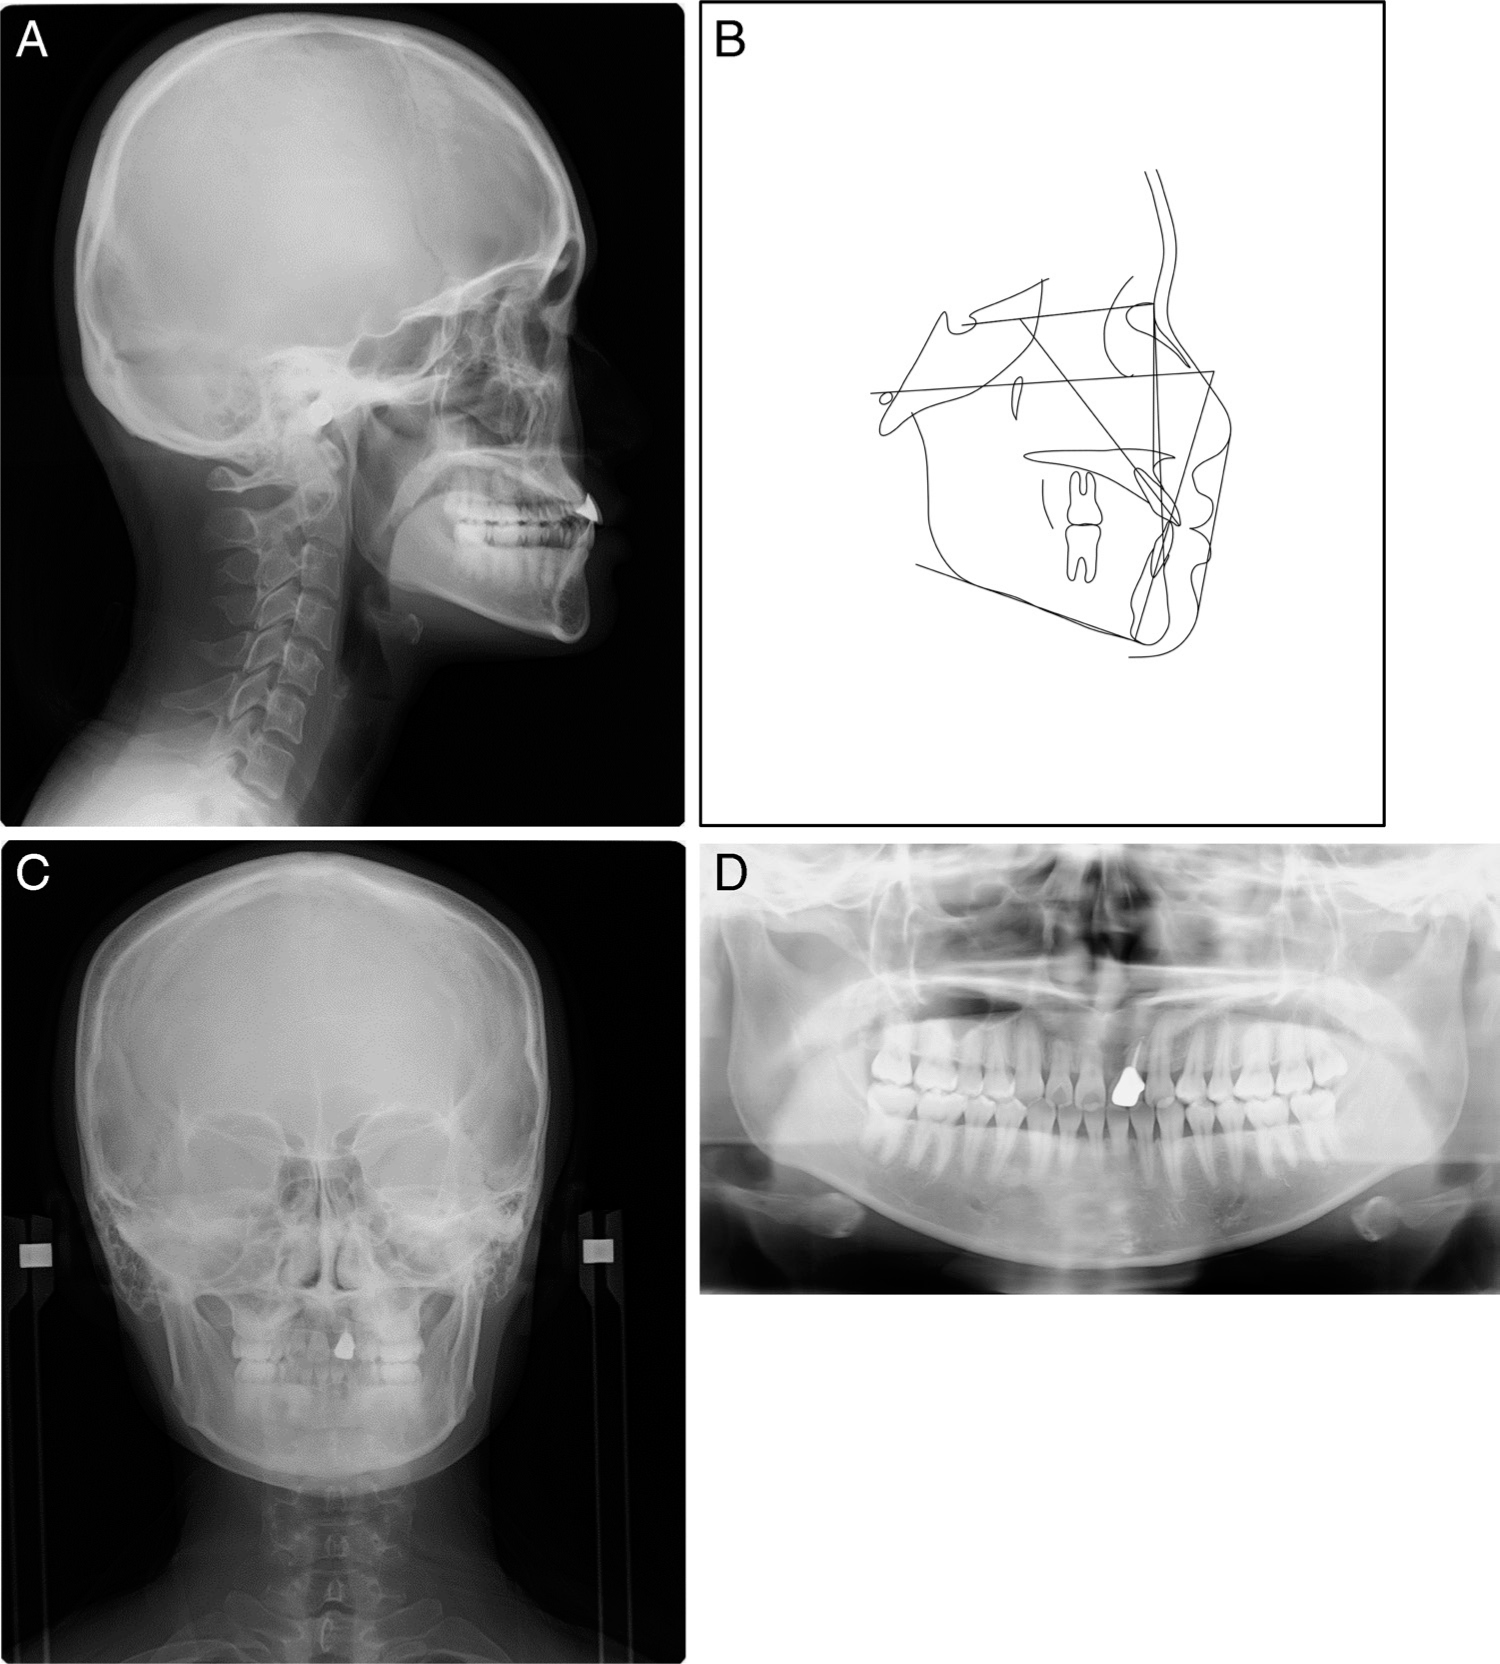
Figure 14.
Postretention cephalograms, a tracing of lateral cephalogram and a panoramic radiograph. (A) Lateral cephalogram. (B) Tracing. (C) Posteroanterior cephalogram. (D) Panoramic radiograph.
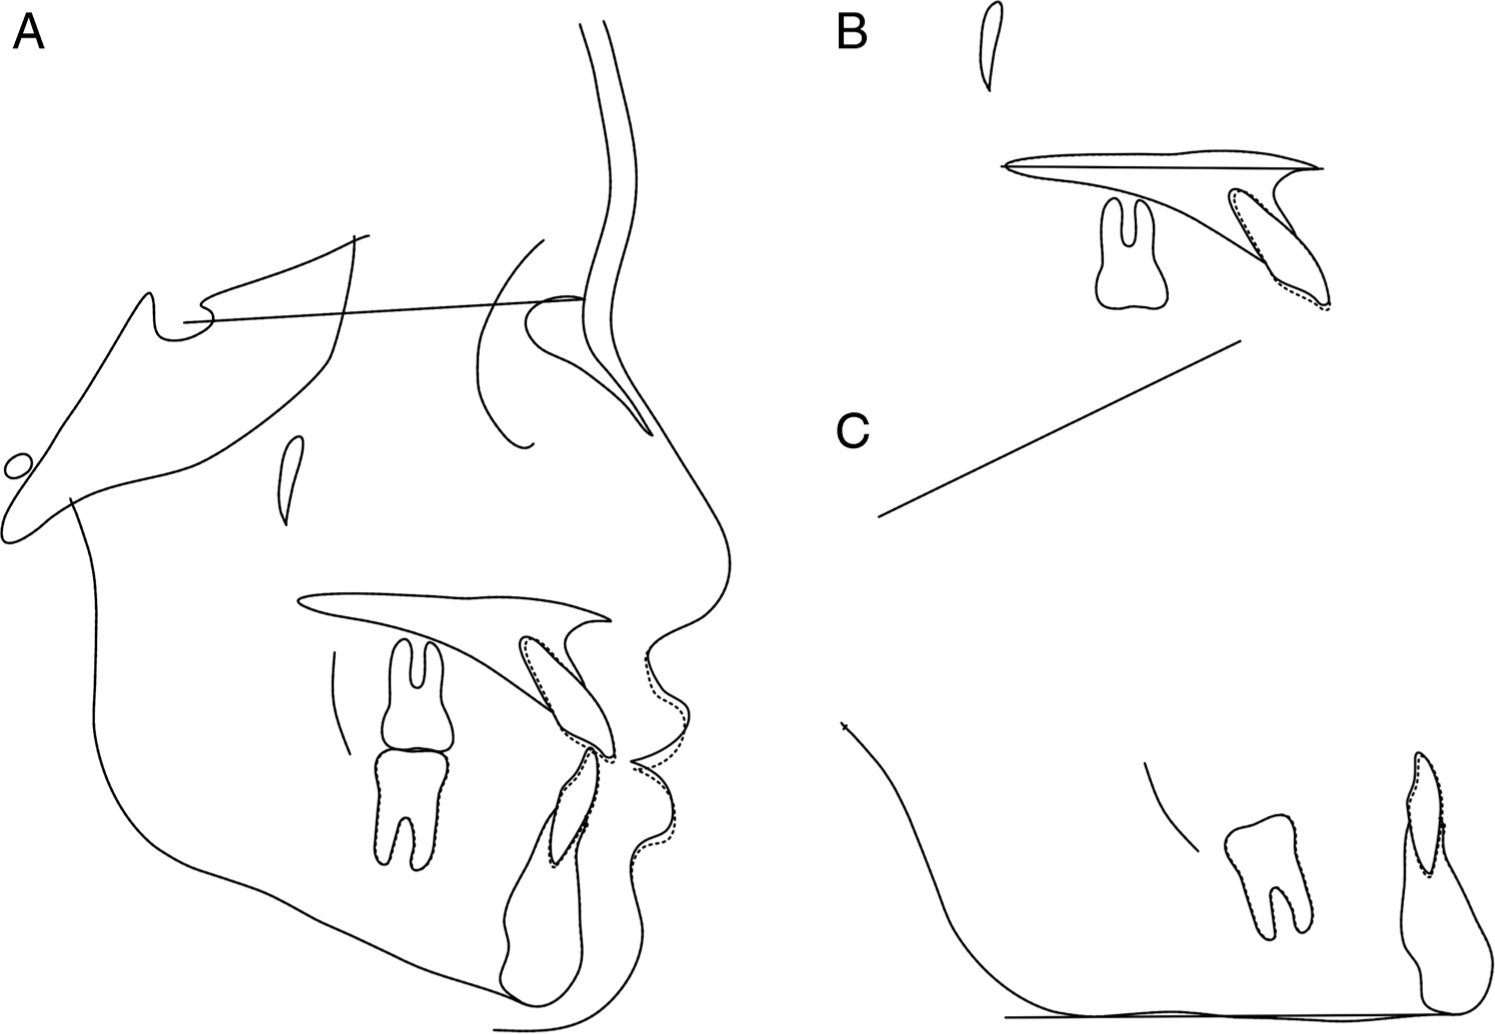
Figure 15.
Superimposition of the cephalometric tracings obtained at posttreatment (solid line) and postretention (dotted line). (A) The sella-nasion plane at the sella. (B) The palatal plane at the ANS. (C) The mandibular plane at the menton.
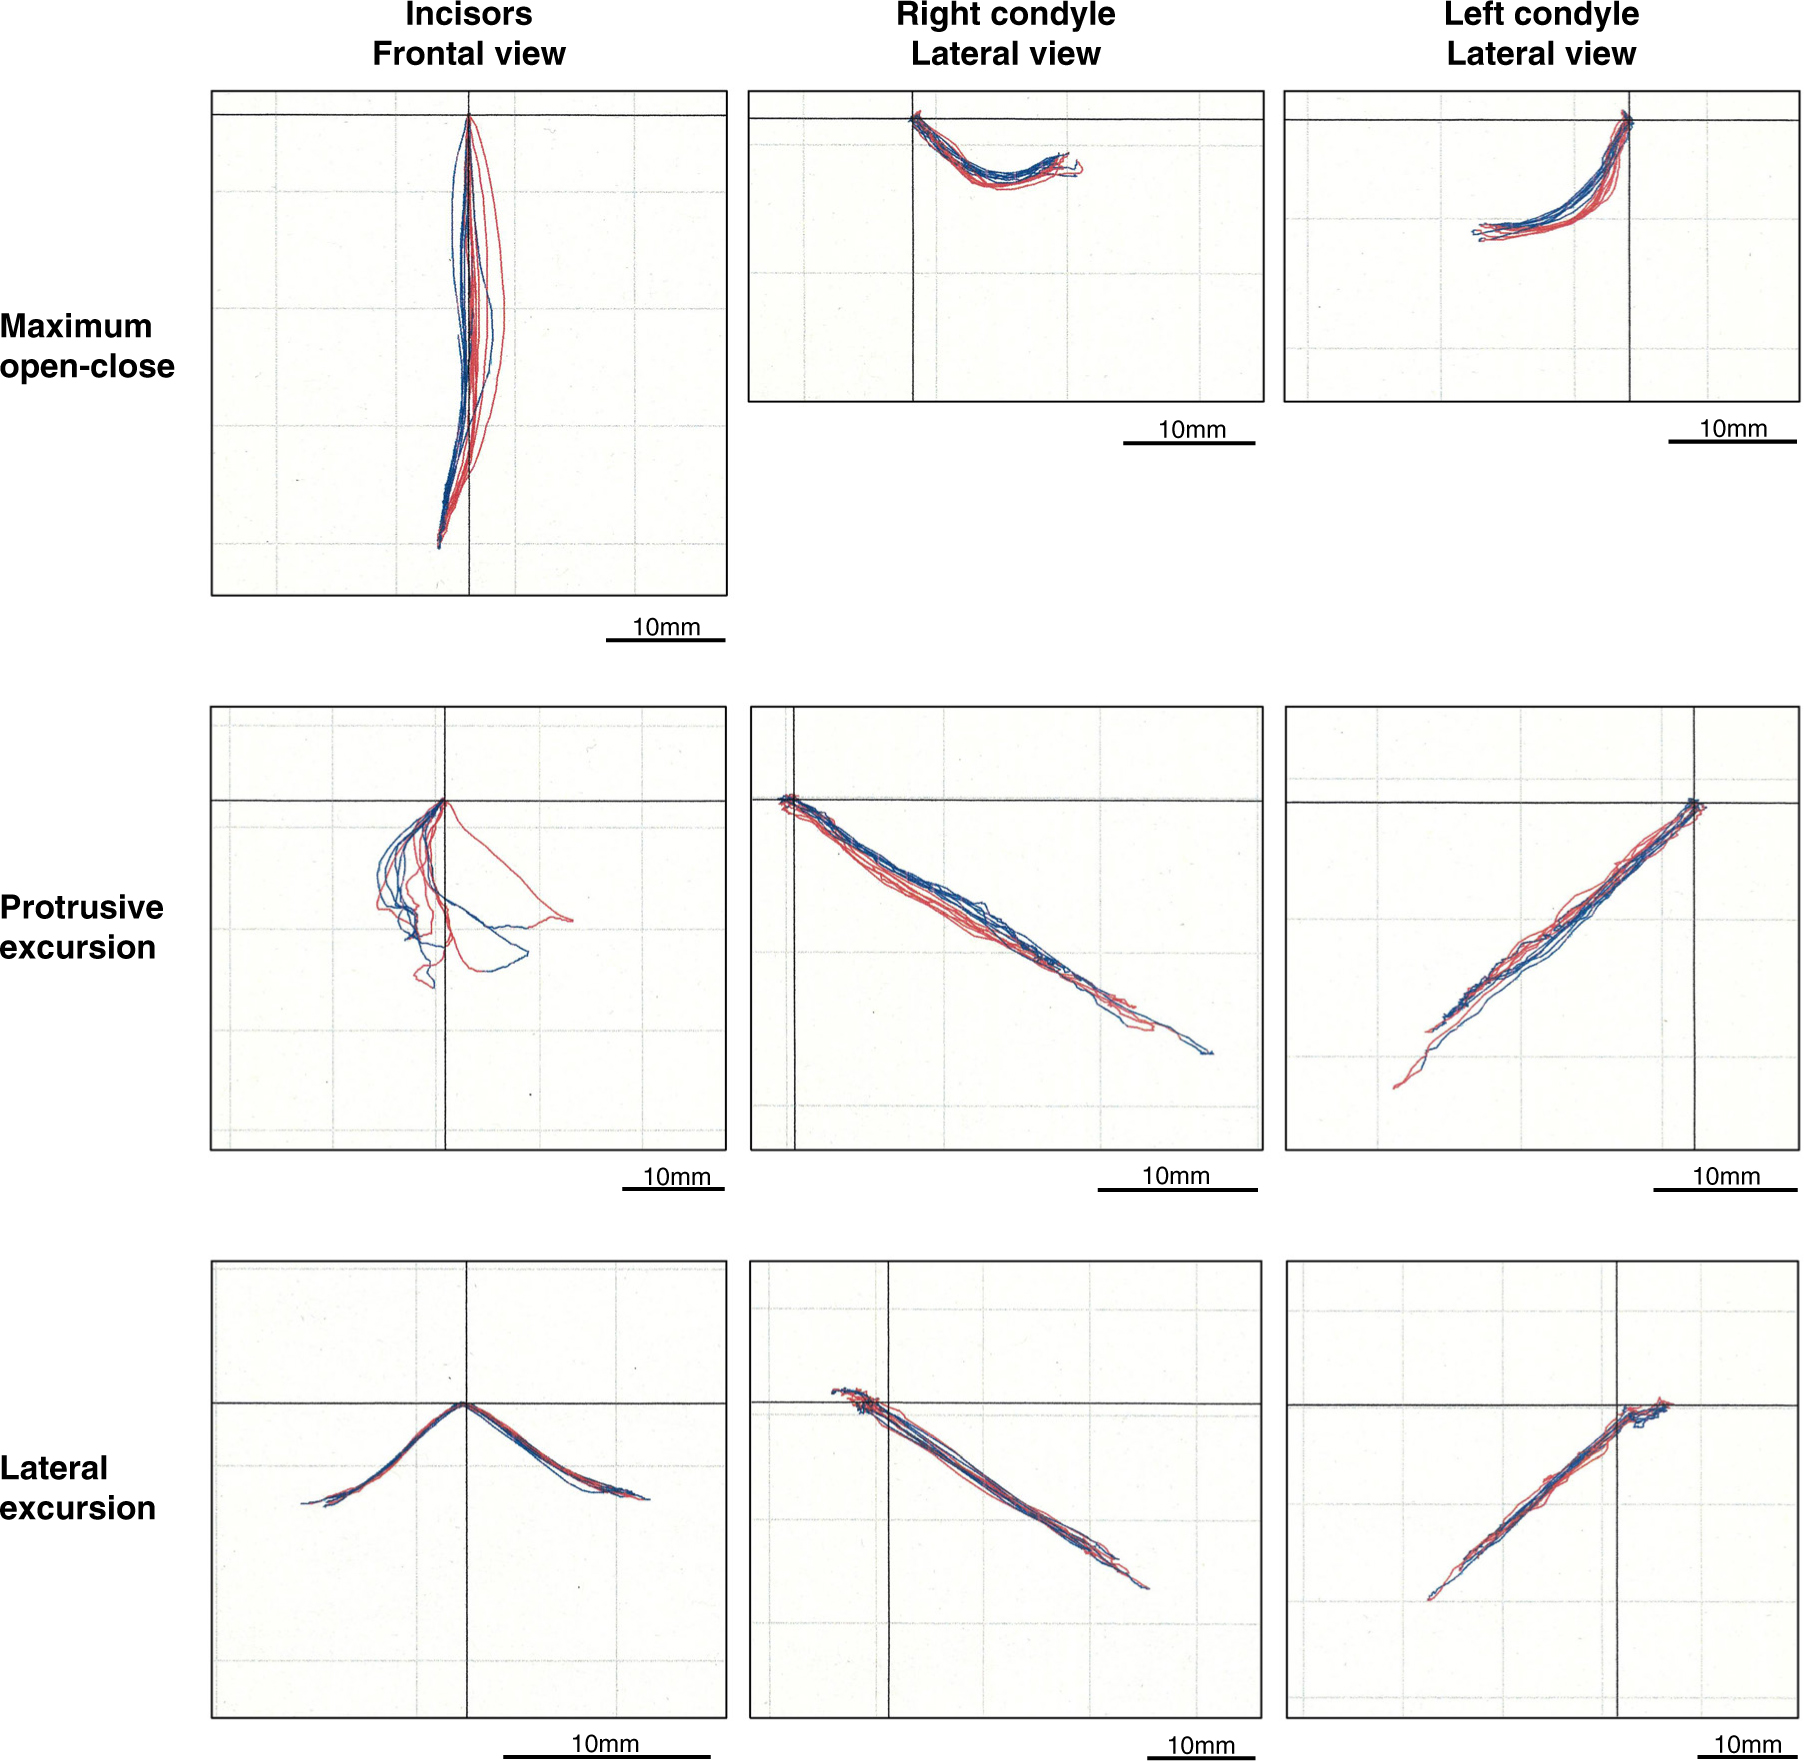
Figure 16.
Postretention condylar movements and incisal paths as detected using a 6 degrees of freedom jaw movement recording system. Opening and closing, protrusive, and lateral jaw movements. The red line indicates the opening phase, and the blue line indicates the closing phase.