
Tilapias are among the most widely cultured fish species globally, particularly in developing countries, due to their adaptability, resistance to disease, and rapid growth rates (Food and Agriculture Organization of the United Nations 2022; El-Sayed, 2020). Despite these advantages, traditional intensive tilapia culture methods often face challenges related to water quality deterioration, high operational costs associated with extensive water exchange, and the use of expensive commercial feeds (Avnimelech, 2012; Boyd & Tucker, 1998). Biofloc technology (BFT) has emerged as a promising production system to address these challenges.
BFT operates by establishing a microbial ecosystem within the water, facilitating the conversion of organic waste and nitrogenous compounds into microbial biomass (“biofloc”). The biofloc then serves as a supplemental natural food source, reducing reliance on commercial feeds and significantly decreasing water exchange requirements (Avnimelech, 2012; Ekasari et al., 2014). Tilapia species, such as Oreochromis mossambicus and Oreochromis niloticus, being effective filter feeders, readily consume these microbial aggregates, thereby benefiting from improved nutrition and water quality through natural biofiltration (Emerenciano et al., 2017; Crab et al., 2012). This makes tilapias particularly suitable candidates for BFT systems.
However, despite these potential benefits, inconsistent results have been reported across various studies, regarding growth performance, feed conversion ratios (FCR), and overall water quality management (Khanjani et al., 2020; García-Ríos et al., 2019). Factors contributing to these inconsistencies have been linked to variations in carbon-to-nitrogen (C:N) ratios, carbon sources, microbial communities, stocking densities, and aeration strategies (García-Ríos et al., 2019; El-Hawarry et al., 2021; Kumar et al., 2024). These inconsistencies highlight the complexity of the application of BFT and emphasize the importance of critically evaluating existing literature to better understand the factors influencing its impact on tilapia culture.
Globally, BFT has been predominantly adopted in countries including China, Brazil, India, Indonesia, Thailand, and Mexico, where intensive aquaculture practices are prevalent and water resource management is critical (Emerenciano et al., 2017; Food and Agriculture Organization of the United Nations, 2022). These countries have demonstrated successful integration of BFT, contributing significantly to advances in sustainable aquaculture practices. In contrast, the adoption of BFT in Africa remains comparatively low. Chambo Fisheries, in Malawi, established one of the largest tilapia BFT farms, achieving favourable FCRs and consistent production of Oreochromis mossambicus and O. shiranus (Kourie, 2017). In Egypt, research has examined BFT in Nile tilapia hatcheries (Abdel-Rahim et al., 2024), as well as its role in improving growth, feed efficiency, and immunity of red tilapia under varying salinity levels (Khanjani & Sharifinia, 2020). Limited work has also been reported in Nigeria, Kenya, South Africa, and Tanzania (Day et al., 2016; Zablon et al., 2022). Despite limited uptake, Africa holds significant potential for BFT application, particularly as tilapias are native to the region. Broader integration of BFT could significantly contribute to improving aquaculture productivity, food security, and ecological sustainability.
Given the global emphasis on sustainable aquaculture development, there is a need to systematically evaluate BFT’s effectiveness and applicability. Thus, the aim of this study is to conduct a comprehensive review and meta-analysis of existing literature on BFT in tilapia culture, quantifying its impact on essential performance indicators, such as growth rate, feed efficiency, and survival. In addition, the effects of BFT on water quality and economic viability are explored. Although previous reviews and meta-analyses have addressed BFT in broader aquaculture systems, none has focused exclusively on tilapia species. This study is therefore the first to systematically synthesize and analyse data specific to tilapia culture under BFT conditions. Thus, providing targeted insights that can better inform species-specific management and optimization of BFT systems.
1. BFT in tilapia culture
1.1. Principles and mechanisms of BFT
BFT operates on the principle of manipulating microbial pathways to convert dissolved nitrogenous waste into microbial biomass. This is achieved by adjusting the C:N ratio in the water. The ratio is typically kept between 10:1 and 20:1 for proliferation of heterotrophic bacteria that assimilate inorganic nitrogen, particularly ammonia and nitrite, into cell biomass (Avnimelech & Kochba, 2009; Emerenciano et al., 2017). The resultant floc, a matrix of microorganisms including bacteria, microalgae, and protozoa, is maintained in suspension through continuous aeration. The key to system stability is sufficient and continuous aeration, which ensures the suspension of flocs, prevents anaerobic zones, and supports oxygen-demanding microbial respiration. Aeration requirements in BFT systems are significantly higher than in conventional systems and can represent up to 60% of the total energy consumption (David et al., 2021; Cala-Delgado et al., 2024).
Carbon inputs such as molasses, rice bran, or jaggery are administered to maintain the C:N ratio and promote bacterial growth. The source and consistency of carbon application are critical, as fluctuations can destabilize the microbial community and impair water quality control (de Lima et al., 2018; Ekasari et al., 2014). Farmers must monitor key parameters, including ammonia, nitrite, dissolved oxygen (DO), pH, alkalinity, and total suspended solids, to maintain system equilibrium.
Biofloc volume and density should be regulated to avoid overaccumulation, which can reduce water clarity and negatively affect fish respiration. Management tools such as sedimentation cones and foam fractionators are used to selectively remove excess solids, though overly aggressive removal may disrupt microbial balance (Emerenciano et al., 2012; Khanjani et al., 2021).
While considerable attention has been placed on managing C:N ratios and aeration in BFT systems, several other environmental and chemical parameters critical to biofloc development have often been overlooked. Temperature, for example, significantly influences microbial metabolism, oxygen demand, and floc stability. Crab et al. (2012), Sallam et al. (2024) and Ekasari et al. (2014) reported that optimal biofloc formation generally occurs between 28 and 32°C in tropical regions. Light availability can also affect microbial succession within bioflocs, especially the balance between phototrophic organisms (microalgae) and heterotrophic bacteria, which in turn impacts floc composition and nutritional value (De Schryver et al., 2008; Xu & Pan, 2012; Jiang et al., 2020). Additionally, the availability of inorganic nutrients like phosphate is essential for supporting microbial growth; low phosphate levels can limit bacterial biomass production even when carbon and nitrogen are adequately supplied (Ebeling et al., 2006; Ekasari et al., 2014). The quality and type of organic matter used as a carbon source can affect floc volume, sedimentation rates, and microbial diversity (Rai et al., 2025; De Schryver et al., 2008; Kumar et al., 2024). Finally, the presence of trace minerals such as calcium, magnesium, and iron support enzymatic activity and microbial aggregation (Hargreaves, 1998; Abakari et al., 2021), yet their role in BFT dynamics remains poorly characterized in most tilapia-focused studies. A more holistic understanding of these interacting variables is needed to optimize BFT systems for consistent performance across diverse environmental settings.
1.2. Nutritional composition of biofloc
The nutritional composition of biofloc is highly variable and depends on several factors, including the carbon source used, microbial community structure, water quality, and floc management practices. Even so, published studies provide a broad picture of its proximate composition. Crude protein levels in biofloc commonly range from approximately 24 to 38% on a dry matter basis. For example, Ibarra Mayorga et al. (2019) reported a protein content of 36.5% in freshwater biofloc, while Ekasari et al. (2014) observed protein levels of 27.8% in biofloc particles larger than 100 µm. These values suggest that under well-managed conditions, biofloc can serve as a meaningful supplementary protein source in tilapia culture. However, not all systems yield equally high protein levels, and some reports show values closer to 20–25%, reflecting the influence of environmental and operational variability (Crab et al., 2012).
The protein requirements of tilapia vary significantly with developmental stage. Tilapia fry (≤1 g) generally require high-protein diets ranging from 40 to 45% crude protein (El-Sayed & Teshima, 1992), while fingerlings (1–10 g) require 35–40% protein. As fish grow, their dietary protein demand decreases; juveniles (10–25 g) typically require 30–35% protein, and grow-out fish (>50–100 g) require 28–32% protein, depending on energy availability and feed quality (Ng & Romano, 2013; Novodworski et al., 2024). Given that BFT can provide crude protein levels approaching 30–36%, it may partially fulfil the dietary protein requirements of juveniles and grow-out tilapia, especially when used to complement formulated diets. However, for early stages such as fry and fingerlings, BFT alone is unlikely to meet the high protein demands, and supplementation with high-quality feeds remains essential.
Lipid content in biofloc also varies considerably across systems. Ekasari et al. (2014) found that larger flocs (>100 µm) contained around 7.5% lipid, whereas Ibarra Mayorga et al. (2019) reported only 0.97% in their sample. This variation likely reflects the differing proportions of bacteria, microalgae, and detrital material present in the biofloc aggregates. In general, the dietary lipid requirement for tilapia ranges between 5 and 10%, depending on life stage, dietary energy balance, and environmental conditions (Ng & Romano, 2013). For fry and juveniles, diets containing 8–10% lipids are often recommended to support rapid growth and efficient feed utilization (El-Sayed & Teshima, 1992). Moreover, while tilapia can biosynthesize long-chain polyunsaturated fatty acids (PUFAs) from linoleic (n−6) and linolenic (n−3) acids, their capacity for this conversion is limited. Hence, dietary inclusion of essential fatty acids, particularly highly unsaturated fatty acids, such as arachidonic acid (ARA, 20:4n−6), eicosapentaenoic acid (20:5n−3), and docosahexaenoic acid (22:6n−3), can improve growth, reproductive performance, and immune function (Glencross, 2009; Brum et al., 2025). Some studies report that tilapia require approximately 0.5–1.0% of total dietary lipids as n−3/n−6 PUFA to optimize physiological function (Santiago and Reyes, 1993). Given that biofloc lipid content is often low and highly variable, and that few studies provide detailed fatty acid profiles, it is currently uncertain whether biofloc alone can meet the lipid requirements of tilapia.
In terms of amino acid composition, data remain limited, but existing studies suggest that biofloc contains key essential amino acids such as lysine, leucine, valine, and threonine, which are crucial for tilapia growth (Ibarra Mayorga et al., 2019; Akange et al., 2025). Ekasari et al. (2014) also found that smaller bioflocs (<48 µm) had a more favourable essential amino acid (EAA) index, despite lower overall protein content, while larger flocs contained more crude protein and lipid. This indicates that not only the quantity but also the particle size of biofloc can influence its nutritional quality. Santiago & Lovell (1988) reported dietary requirements of approximately 5.0–5.5 g/kg for methionine, 12.0–13.0 g/kg for lysine, and 8.5–9.0 g/kg for isoleucine for juvenile tilapias. Given these requirements, it remains uncertain whether biofloc alone can provide sufficient essential amino acids to meet the full nutritional needs of tilapias. While bioflocs may supply useful amounts of some EAAs, there is insufficient evidence to conclude that its amino-acid profile consistently meets tilapia requirements.
Despite its potential, the nutritional profile of biofloc cannot be considered consistent across systems. As Raza et al. (2024) and Crab et al. (2012) emphasize, the proximate and amino acid composition of biofloc biomass is highly system-dependent. Consequently, while biofloc represents a valuable supplementary source of protein and energy, it may not consistently meet the complete nutritional requirements of tilapia, particularly with regard to limiting amino acids like methionine. Regular system-specific nutritional profiling is therefore essential, especially in operations that aim to partially replace conventional feeds with biofloc-derived nutrients.
1.3. Performance of tilapias under BFT
Multiple studies have confirmed the efficacy of BFT in improving growth performance, feed utilization, and survival rates in tilapia culture. Ekasari et al. (2015), Khanjani et al. (2020), and Abdel-Rahim et al. (2024) observed that tilapia reared in BFT systems achieved comparable or improved growth with diets reduced in protein content. This is attributed to the microbial protein and nutrient contribution from biofloc aggregates. Tilapia species benefit from the dual role of biofloc as a water purifying consortium and as a supplementary feed source. The microbial biomass contributes significantly to nutrient cycling and provides protein-rich aggregates that can be consumed by the fish, thereby improving feed conversion and reducing dependence on commercial feed inputs (Crab et al., 2012; Ekasari et al., 2015). This internal recycling of nitrogenous waste also reduces the environmental impact of effluent discharge from aquaculture systems.
BFT systems have also demonstrated notable effects on the immune response of tilapia. Several studies report that the microbial-rich environment of biofloc enhances both innate and adaptive immune responses in fish (Emerenciano et al., 2017; Elayaraja et al., 2020). For instance, Azim and Little (2008) observed increased lysozyme activity and leukocyte counts in tilapia reared under BFT conditions, both indicative of heightened immune responsiveness. Similarly, Vargas-Albores et al. (2019) reported elevated levels of immunoglobulin M (IgM) and complement activity in tilapia fed biofloc-based diets. These immunostimulatory effects are attributed to a range of bioactive constituents present in the biofloc matrix. Microbial components such as β-glucans, peptidoglycans, and lipopolysaccharides stimulate innate immune mechanisms in fish (El-Hawarry et al., 2021).
Additionally, the presence of probiotic bacteria (e.g. Bacillus, Lactobacillus, and Pseudomonas spp.) modulates gut microbiota, promotes intestinal health, and enhances mucosal immunity. Nucleotides derived from microbial biomass support immune cell proliferation and antibody production, particularly during periods of stress or infection. Furthermore, poly-β-hydroxybutyrate (PHB), a microbial storage polymer commonly found in biofloc, has been shown to improve disease resistance and intestinal function. Biofloc also contains antioxidant enzymes such as superoxide dismutase and catalase, which help mitigate oxidative stress and maintain immune stability. Finally, reduced pathogen loads due to competitive exclusion and improved water quality in BFT systems further lower stress levels and susceptibility to disease (Crab et al., 2012). Together, these factors make BFT a promising approach not only for sustainable production but also for immunological enhancement in tilapia aquaculture.
1.4. Economic viability and cost implications of biofloc in tilapia culture
The economic performance of BFT in tilapia culture hinges on a balance between high initial investment and long-term operational savings. One of the major capital costs in BFT systems is the infrastructure for intensive aeration, which may account for up to 30–60% of total energy costs depending on system size and management (Cala-Delgado et al., 2024). This is due to the constant aeration required to maintain microbial floc in suspension and ensure high water quality. In addition, carbon sources such as molasses, sugarcane bagasse, or wheat bran must be consistently added to maintain an optimal C:N ratio, representing an ongoing input cost of approximately $0.05–$0.10 per kg of fish produced (Emerenciano et al., 2017; Ekasari et al., 2015).
Despite these inputs, the cost of feed is often reduced by 20–30% due to the nutritional contribution of the floc biomass. Commercial feed typically comprises 50–70% of operational costs in conventional tilapia farming; thus, even modest feed savings significantly improve profit margins (Crab et al., 2012; Kuhn et al., 2008). A study by de Lima et al., (2018) estimated that BFT operations could achieve an FCR improvement of 0.2–0.3 units, translating into a feed savings of $120–$150 per ton of fish produced under typical conditions.
Water use is significantly minimized in BFT systems (near-zero exchange), which can reduce water costs by up to 90% in regions where freshwater is expensive or scarce (Wasielesky et al., 2006). Additionally, the stable microbial environment reduces the incidence of disease outbreaks, cutting down on veterinary expenses and antibiotic use. For example, Serafini et al. (2025) reported a 30% decrease in disease treatment costs in BFT tilapia farms compared to conventional systems.
However, BFT may not be economically feasible for all producers. Small-scale farmers may face barriers due to the upfront costs of installing aeration systems, biofloc tanks, and real-time monitoring tools. The payback period for capital investments typically ranges from 1 to 2 production cycles (6–12 months), assuming efficient operation and proper training (Hargreaves, 2013). A common factor contributing to the failure of BFT systems is the lack of detailed feasibility assessments and value chain analyses prior to implementation. In many cases, systems have been deployed without adequate consideration of recurring costs such as electricity, labour, and skilled oversight, or without alignment to local market conditions (Kuhn et al., 2008; Wasielesky et al., 2006).
Several studies have highlighted that BFT is not universally profitable. For example, Piedrahita (2003) and Avnimelech (2012) observed that in settings with high energy costs or limited technical expertise, the complexity of managing aeration, water quality, and solids accumulation can outweigh the benefits derived from feed or water savings. These findings highlight the importance of conducting site-specific economic evaluations and ensuring adequate support systems are in place before broadly promoting BFT, particularly among resource-limited producers.
Although BFT demands higher initial capital and technical expertise, it offers long-term economic benefits through feed cost reduction, enhanced productivity, and improved resource efficiency. When designed and operated efficiently, BFT can be a cost-effective and sustainable strategy for intensifying tilapia aquaculture. Therefore, BFT should be promoted as a potentially cost-effective and sustainable strategy for intensifying tilapia aquaculture, but only where feasibility assessments support its implementation and producers are equipped to manage its operational complexity.
2. Material and methods
2.1. Literature search and selection
A systematic literature search was conducted following the Preferred Reporting Items for Systematic Reviews and Meta-Analyses (PRISMA) guidelines using databases including Google Scholar, Scopus, Web of Science, and ScienceDirect. This comprehensive search aimed to identify relevant peer-reviewed studies on BFT in tilapia aquaculture published between 2004 and 2024. The detailed search strategy utilized combinations of the following keywords:
“Biofloc technology” OR “BFT”
“Tilapia culture” OR “Oreochromis niloticus” OR “Oreochromis mossambicus”
“Growth performance” OR “Feed conversion ratio (FCR)” OR “Water quality”
Additionally, reference lists from selected studies were manually reviewed to identify further relevant publications potentially missed in the initial database searches. All identified articles underwent an initial screening based on their title and abstract to ensure their relevance to the research objectives. The detailed process of literature search, screening, and selection is illustrated in Figure 1.
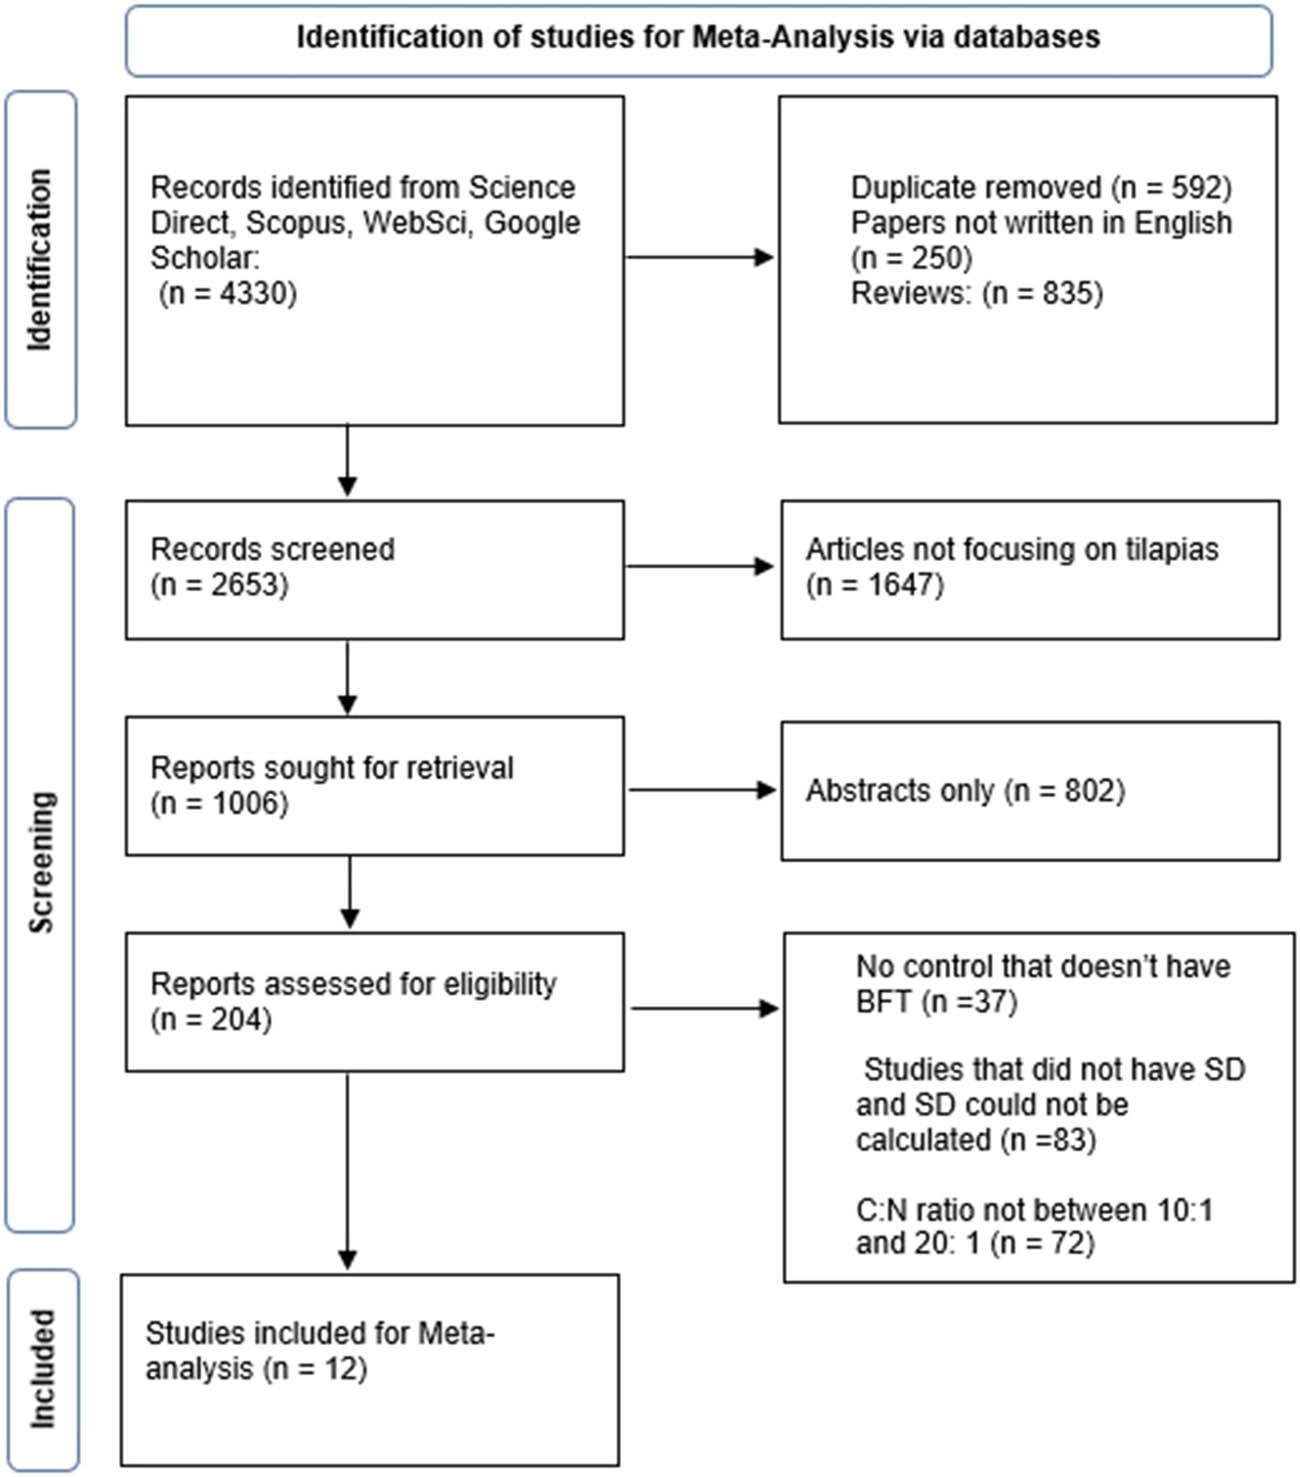
Figure 1
PRISMA flow chart for article selection for meta-analysis.
2.2. Eligibility criteria
Studies were included if they met the following criteria:
Evaluated the effects of BFT specifically on key performance indicators including SGR, FCR, and survival rate of tilapia species.
Clearly reported critical water quality parameters, particularly nitrite (NO2), DO, and total ammonia nitrogen (TAN), maintaining the C:N ratio within a range of 10:1–20:1.
Included both a control group and treatment group, ensuring each group had replicates to guarantee statistical reliability and experimental validity.
Reported experimental outcomes quantitatively, including mean values ± standard deviation (SD).
Studies were excluded based on the following criteria:
Insufficient methodological or statistical detail.
Did not specifically employ a biofloc system.
Focused on species other than tilapia.
Were review articles, conference proceedings, abstracts, editorials, letters, or unpublished theses and dissertations.
2.3. Data extraction
Based on the criteria above, 12 articles were selected. Relevant data extracted included authors, publication year, species of tilapia, water quality parameters, growth performance metrics (SGR, FCR, survival rate), carbon sources used, and C:N ratios (Table 1).
Table 1
Meta-analysis data sources
| Study | Fish species | Biofloc source | C:N ratio | Data extracted |
|---|---|---|---|---|
| Mirzakhani et al., (2019) | Oreochromis niloticus | Molasses; wheat flour | 15:1; 20:1 | SGR, FCR, survival rate, DO, TAN, NO2 – |
| Hisano et al., (2021) | Oreochromis niloticus | Sugar cane molasses | 12:1 | SGR, FCR, survival rate, DO |
| Long et al., (2015) | Oreochromis niloticus | Glucose | 12:1 | SGR, FCR, survival rate, DO, TAN, NO2 – |
| Hwihy et al., (2021) | Oreochromis niloticus | Molasses + rice bran | 15:1 | SGR, FCR, DO, TAN |
| Ekasari et al., (2015) | Oreochromis niloticus | Molasses | 10:1 | SGR, survival rate, DO, TAN, NO2 – |
| Elayaraja et al., (2020) | Oreochromis niloticus | Jaggery powder | 12:1; 15:1; 20:1 | SGR, FCR, survival rate |
| Gurung et al., (2024) | Oreochromis niloticus | Sugar; corn flour; rice bran; molasses | 10:1 | SGR*, FCR, survival rate, DO |
| Haraz et al., (2023) | Oreochromis niloticus | Molasses | 10:1; 20:1 | SGR, FCR, DO, TAN |
| García-Ríos et al., (2019) | Oreochromis niloticus | Corn flour; sugar; wheat flour | 12:1 | SGR, FCR, survival rate, DO, TAN, NO2 – |
| de Lima et al., (2018) | Oreochromis niloticus | Sugar; liquid molasses; molasses powder | 15:1 | SGR, FCR, survival rate, DO, TAN, NO2 – |
| Pérez-Fuentes et al., (2018) | Oreochromis niloticus | Liquid molasses | 10:1 | SGR*, FCR, survival rate, DO, NO2 – |
| Rind et al., (2023) | Oreochromis niloticus | Sugarcane molasses; tapioca powder | 15:1 | SGR*, FCR, Survival rate, DO, NO2 – |
2.4. Data analysis
A meta-analysis was performed using R software version 4.3.0 with meta and metafor packages to evaluate the overall impact of BFT on tilapia growth performance parameters and water quality parameters. Standardized mean differences (SMD) and 95% confidence intervals (CIs) were computed to quantify the differences between biofloc treatment groups and control groups. The I 2 statistic was calculated to assess heterogeneity among studies. Baujat plots were also generated to identify specific studies exerting significant influence on the overall effect size and heterogeneity. Publication bias was visually assessed through funnel plots, and Egger’s regression test was performed statistically to detect asymmetry indicative of potential bias. A subgroup analysis was also conducted to evaluate the effect of C:N ratio on BFT performance. Studies were categorized into three groups: low (10:1), medium (12:1–15:1), and high (20:1) based on the range of C:N ratio reported in the included studies. Subgroup analyses were performed for FCR, SGR, nitrite (NO2 –), and TAN. Significant differences in subgroups were evaluated using chi-square (χ 2) test.
3. Results and discussion
3.1. Growth performance
3.1.1. SGR
The meta-analysis showed significant positive effects of BFT on growth performance in tilapia culture. The overall SMD for SGR was 7.70 (95% CI: 6.83–8.58; Figure 2). This indicates that tilapia reared under BFT exhibited higher growth rates compared to the control. This result is consistent with García-Ríos et al. (2019) and Azim and Little (2008) who reported enhanced growth of O. niloticus in BFT systems and attributed it to improved feed utilization, water quality, and microbial protein supplementation. The level of heterogeneity was I 2 = 99.7% (P < 0.00001). High heterogeneity is often attributed to differences in system design, microbial community composition, feeding strategies, stocking densities, and carbon source management of the selected studies (Ekasari et al., 2014; Khanjani et al., 2020).
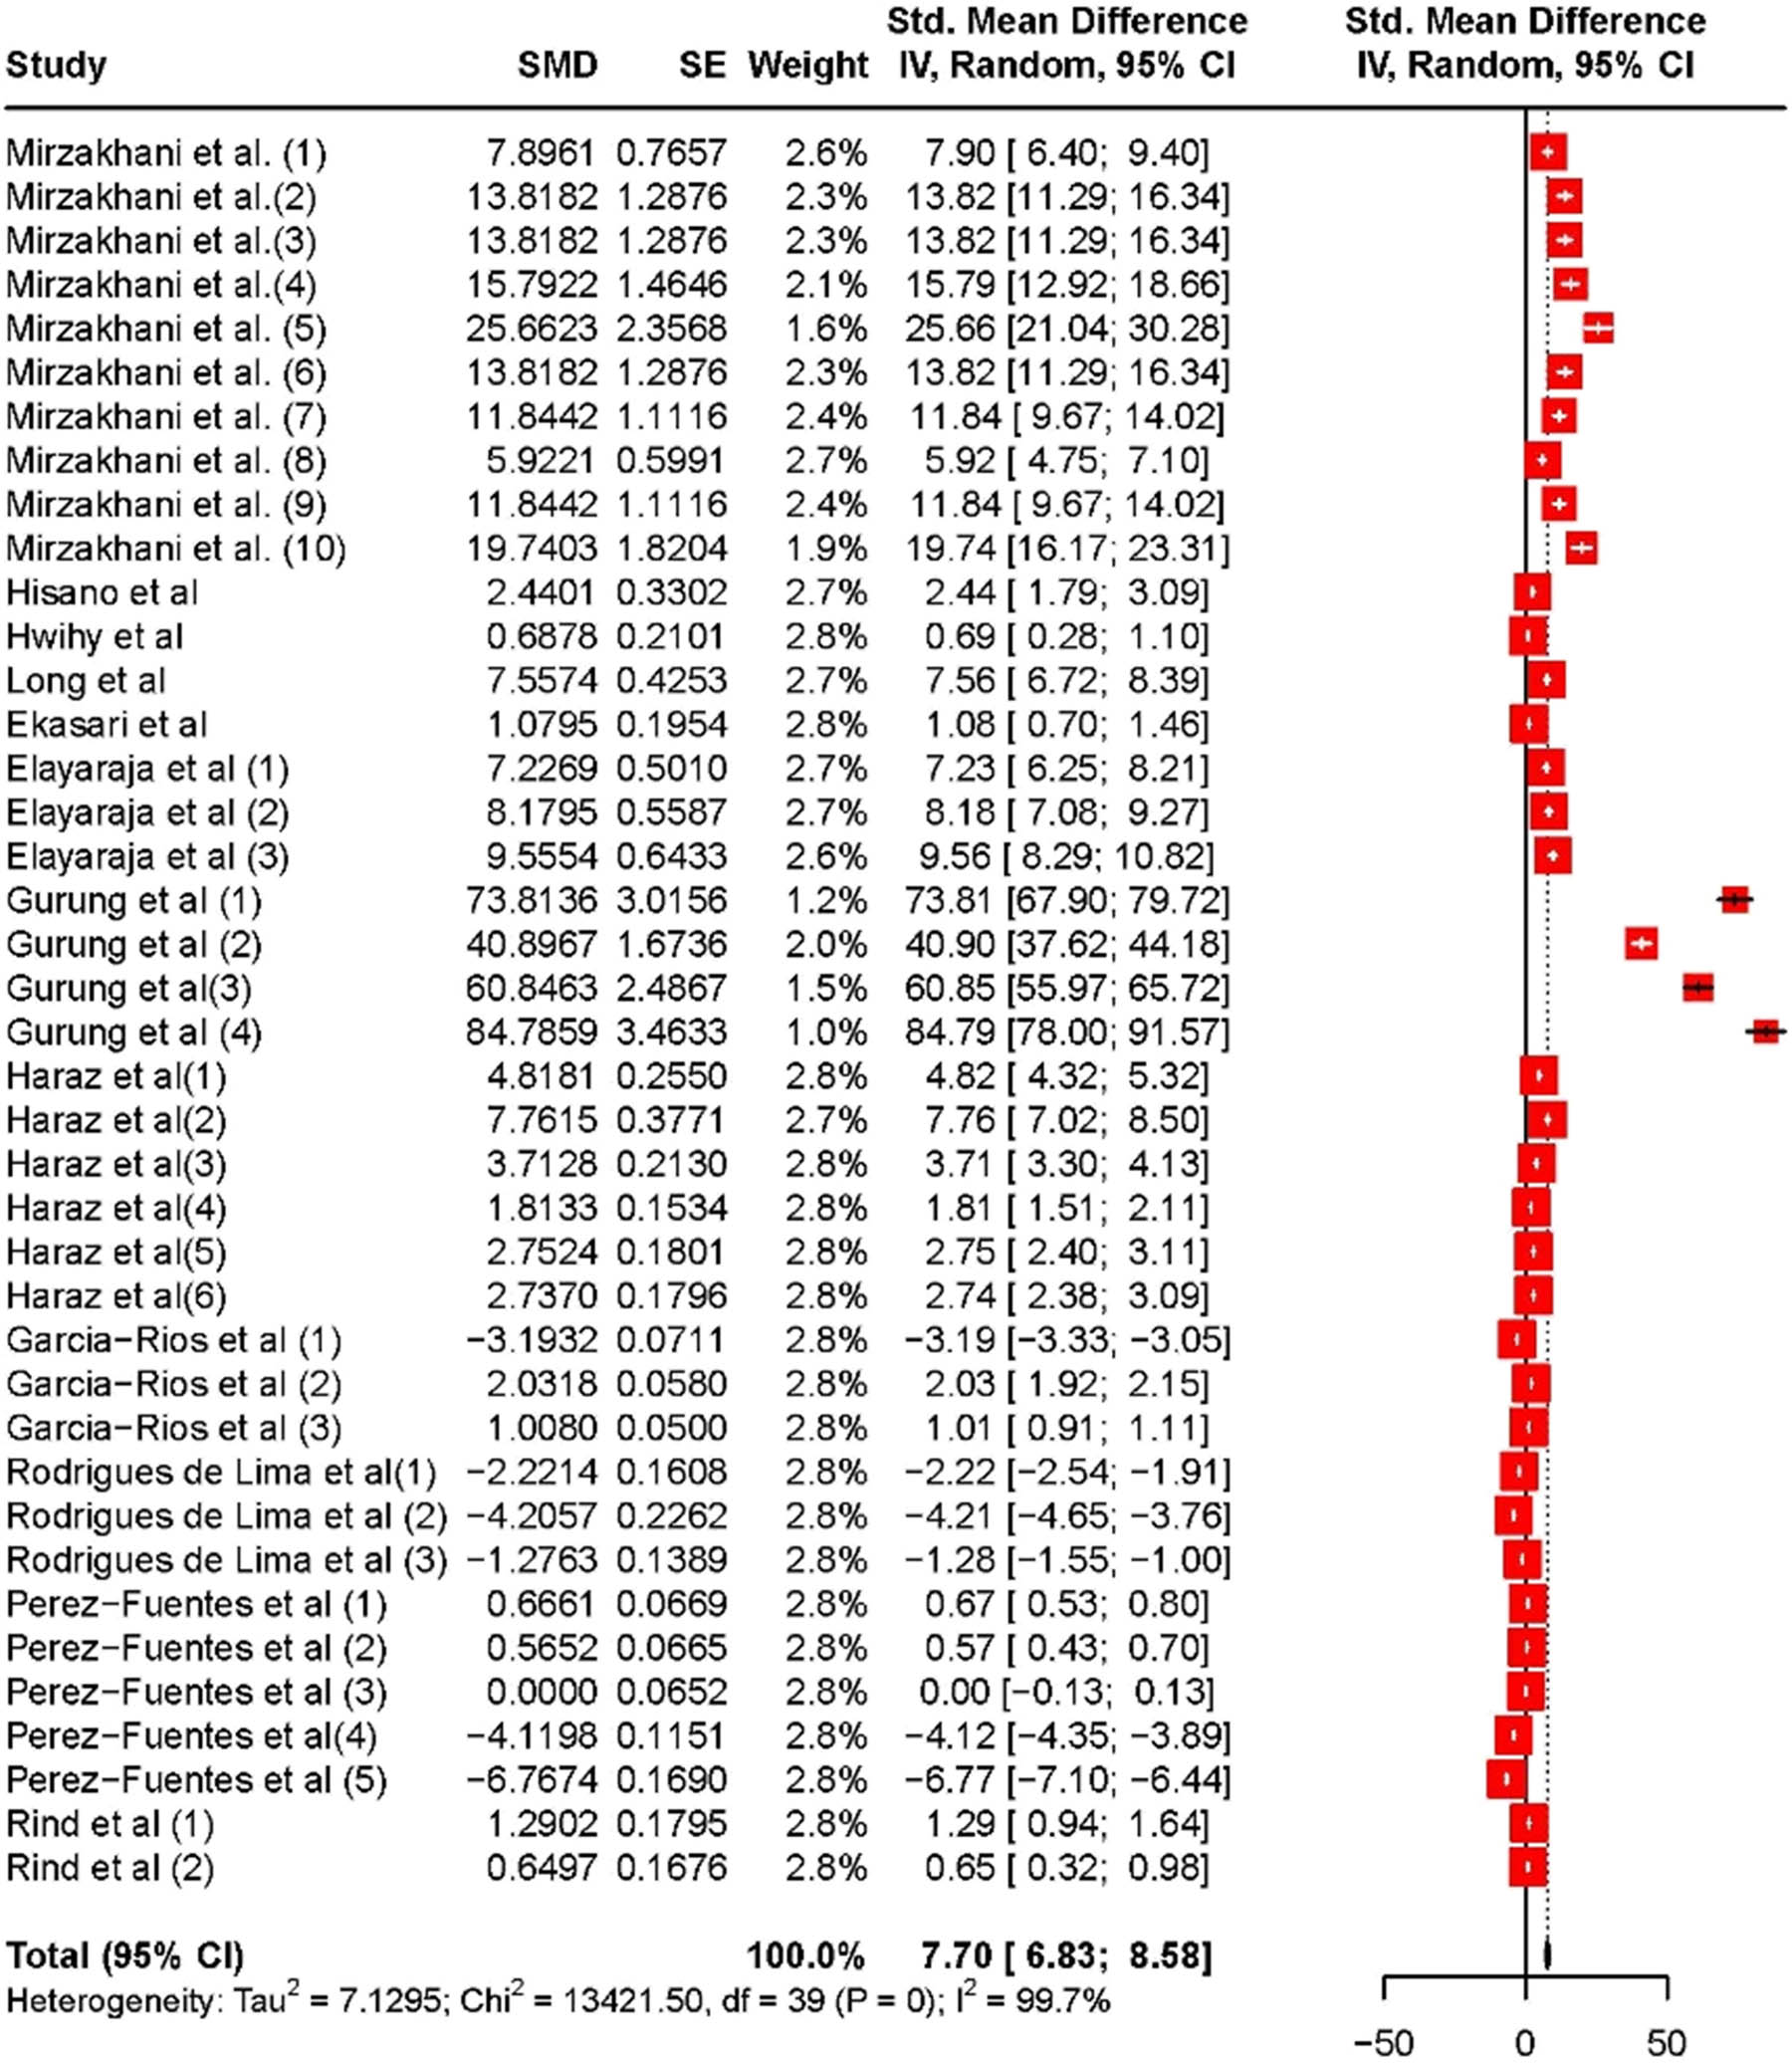
Figure 2
Forest plot showing the SMD for SGR of tilapia cultured under BFT compared to control systems.
Furthermore, the Baujat plot identified the study by García-Ríos et al. (3) as a highly influential study contributing to overall heterogeneity (Figure 3). The position of García-Ríos et al. (3) in the top-right quadrant of the Baujat plot indicates that this study not only had large, standardized residuals but also exerted a strong influence on the meta-analysis summary effect. This may stem from several factors, including large sample sizes, extreme effect sizes, or methodological differences relative to other included studies (Baujat et al., 2002). In the current study, García-Ríos et al. (2019) had the highest sample size followed by Pérez-Fuentes et al. (2018).
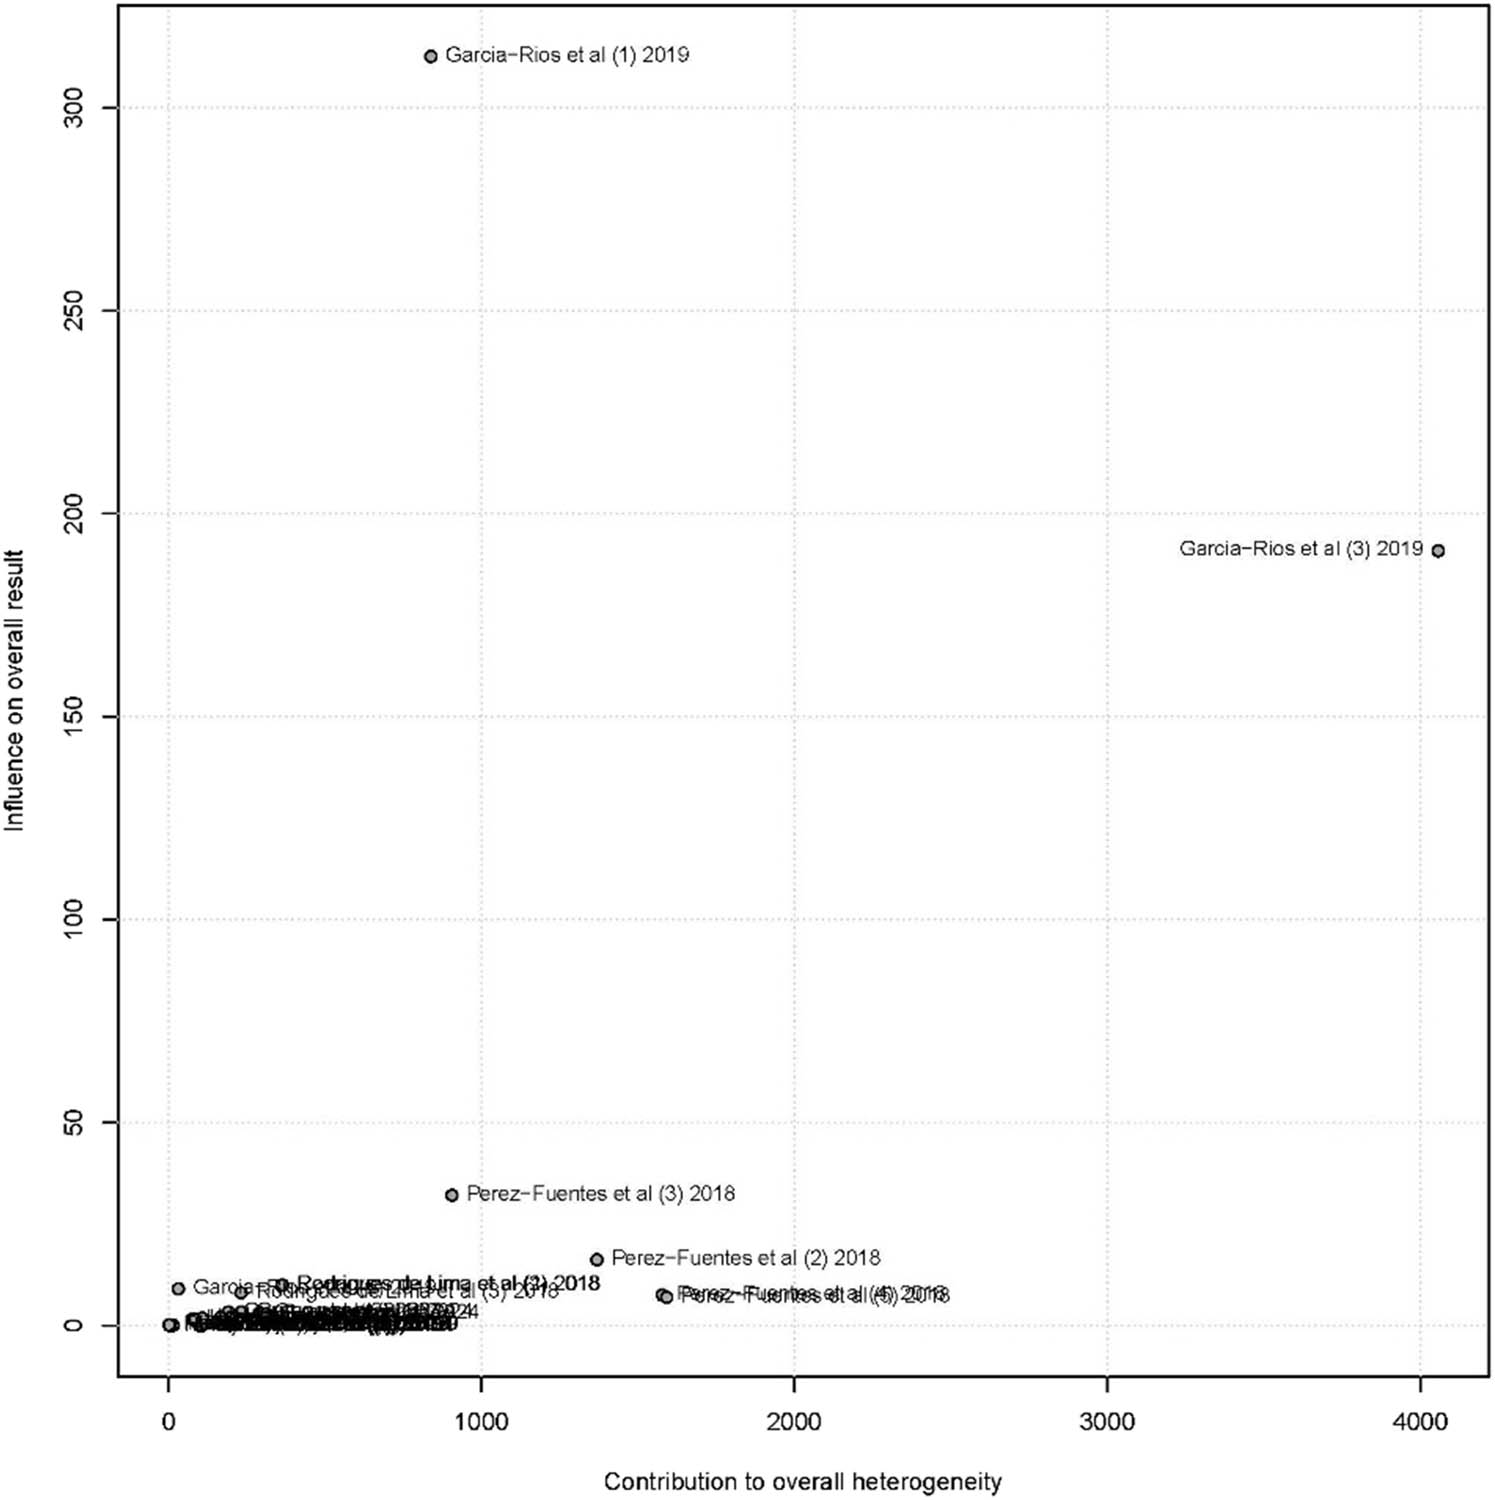
Figure 3
Baujat plot identifying influential studies contributing to heterogeneity in the SGR meta-analysis.
The Egger’s test detected significant publication bias (intercept = 11.32, p = 0.0039) as shown in the funnel plots (Figure 4). The bias shows that studies with neutral or negative SGR results may be underreported, potentially exaggerating the perceived effect of BFT on growth. Dwan et al. (2013) reported that publication bias is often driven by editorial preferences to publish statistically significant outcomes. Therefore, researchers may be less inclined to report studies where there is no improvement under BFT.
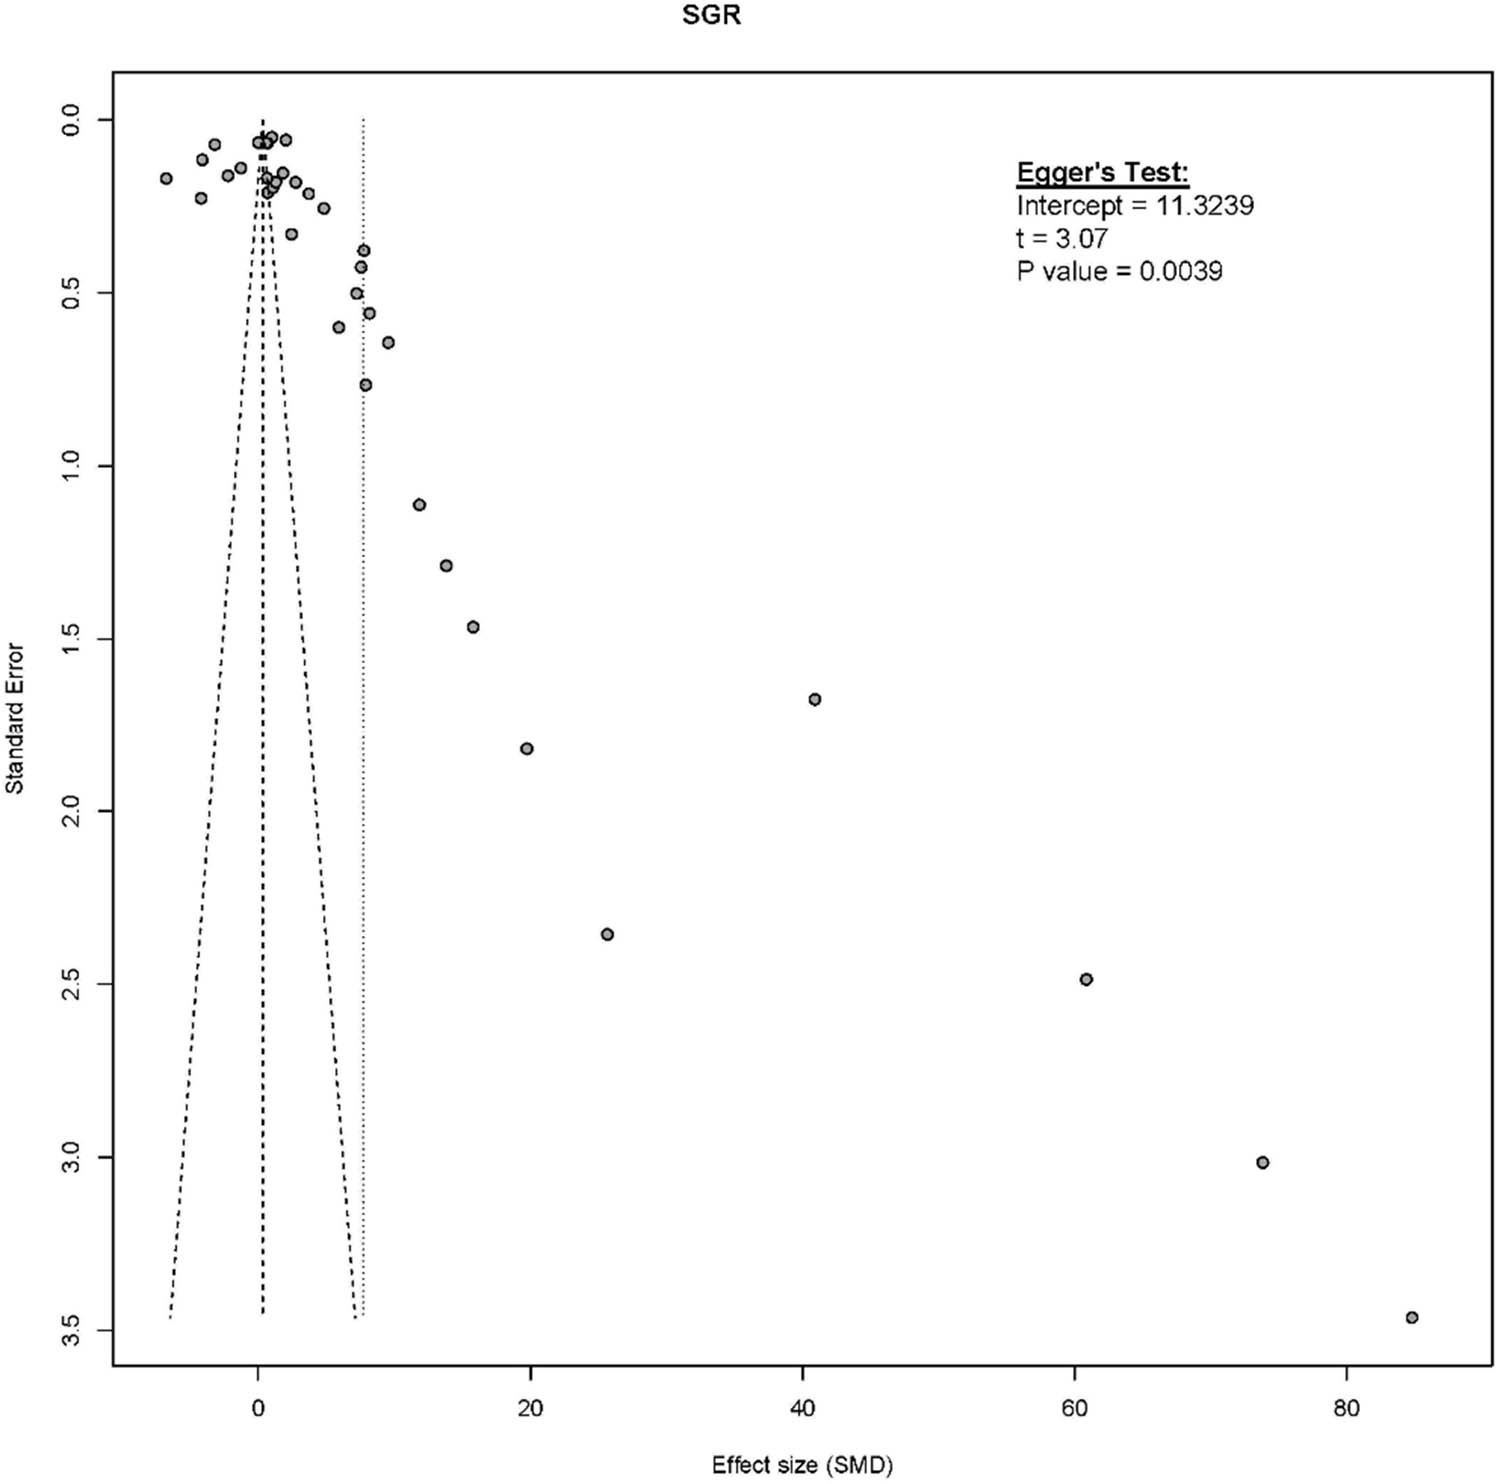
Figure 4
Funnel plot assessing potential publication bias in studies reporting SGR under BFT.
The positive growth performance of tilapias in BFT can be attributed to the euryphagous feeding habits of tilapias, tilapias are both particulate feeders and filter feeders and thus they can use the particulate feed items in the biofloc and also filter feed on the plankton and microorganisms on the biofloc (Bowen, 1982; Long et al., 2015). Furthermore, tilapias can feed from the surface, middle water column, and the bottom. These feeding habits strategy makes it easy for tilapias to access biofloc, which may be found at any depth in the BFT production system. Unlike tilapias, fastidious eaters (e.g. rainbow trout) cannot be cultured in BFT because they are stenophagous and have a very restricted diet. In addition, these species tend to be more sensitive to the elevated turbidity and dynamic microbial communities characteristic of BFT systems, conditions that often compromise performance and survival in such highly intensive and variable culture environments.
3.1.2. FCR
Similarly, FCR was significantly improved in tilapia cultured under BFT systems, with an overall SMD of –8.39 (95% CI: –9.49 to –7.29) (Figure 5). This negative SMD indicates that tilapia in BFT systems required substantially less feed per unit of biomass gain compared to those in conventional systems. Such improved feed efficiency is a key economic and ecological advantage of BFT, aligning with the microbial contributions to protein recycling and enhanced digestion (Emerenciano et al., 2013). These microbial communities, stimulated by added carbon sources, help convert waste nitrogen into microbial biomass, which in turn becomes a supplementary protein source for the fish (Crab et al., 2012; Avnimelech, 1999). However, it must be noted that of all the studies selected for meta-analysis, only three reported the proximate composition of biofloc, and only the study by Elayaraja et al. (2020) provided a detailed amino acid profile. This highlights a major gap in current understanding regarding the actual nutritional contribution of biofloc to fish performance.
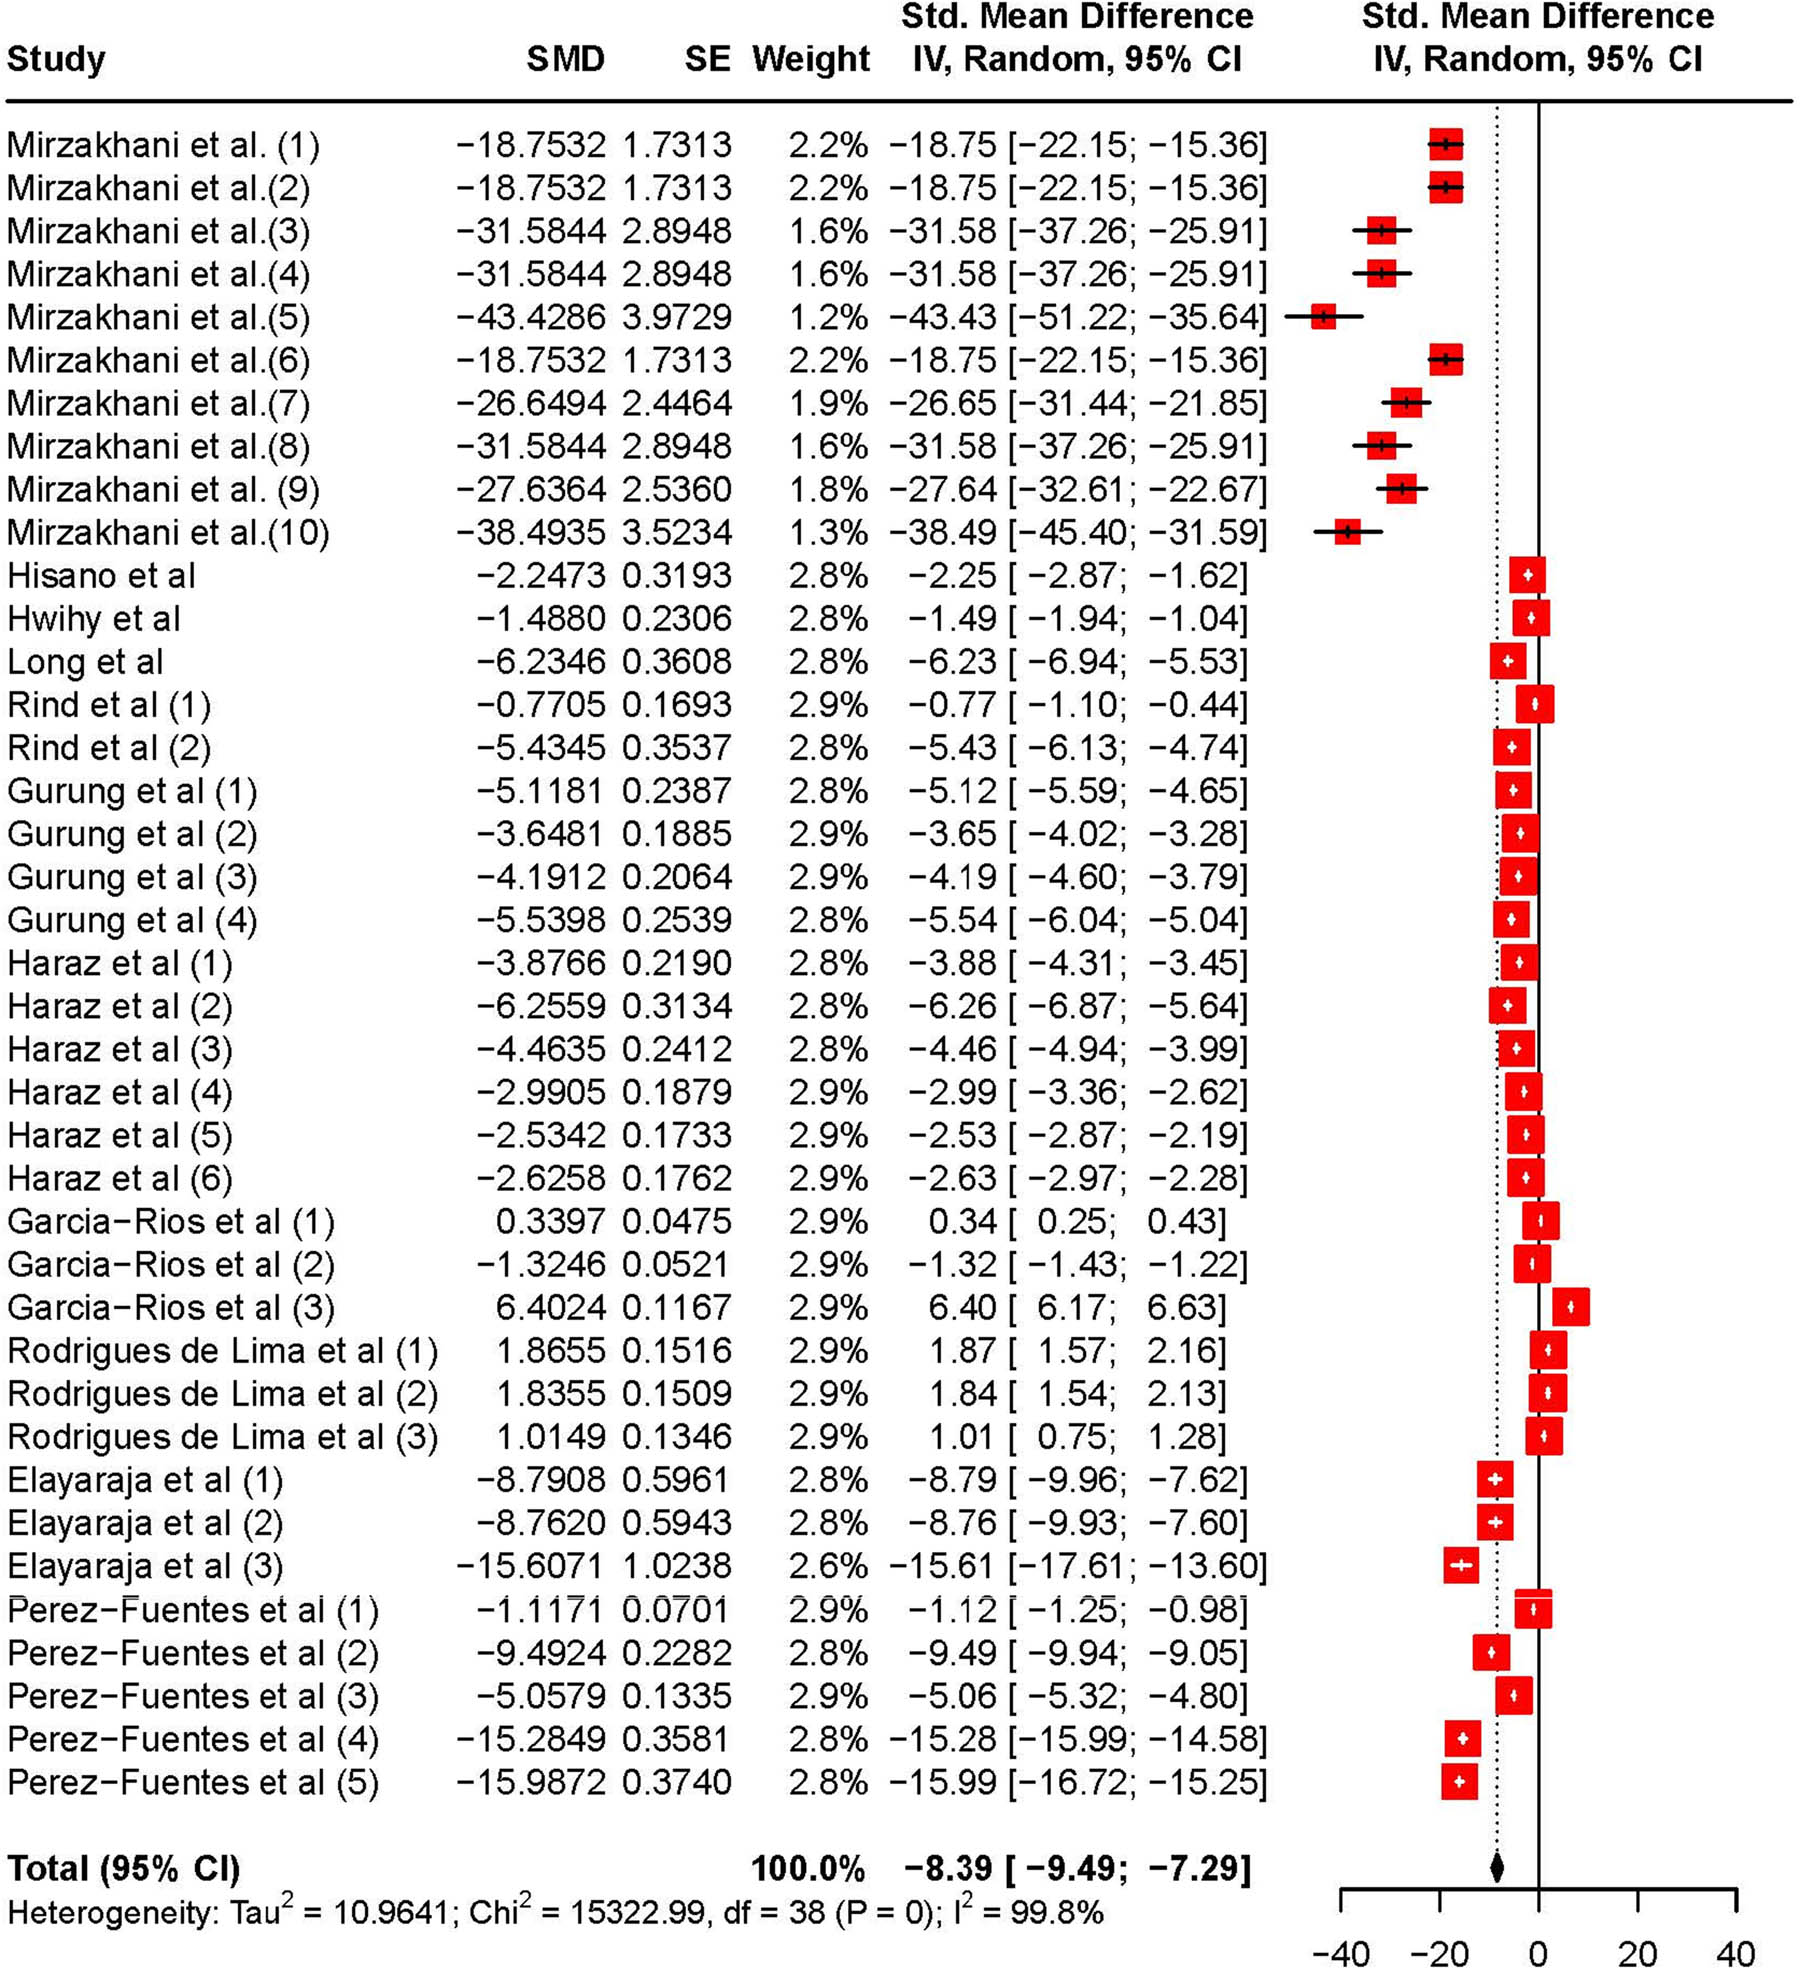
Figure 5
Forest plot showing the SMD for FCR in tilapia under BFT compared to conventional culture systems.
Heterogeneity across studies was very high (I 2 = 99.8%). The Baujat plot again highlighted García-Ríos et al. (1) and Pérez-Fuentes et al. (5) as dominant outliers (Figure 6). Again, the influence of these studies to heterogeneity is likely due to the large sample sizes.
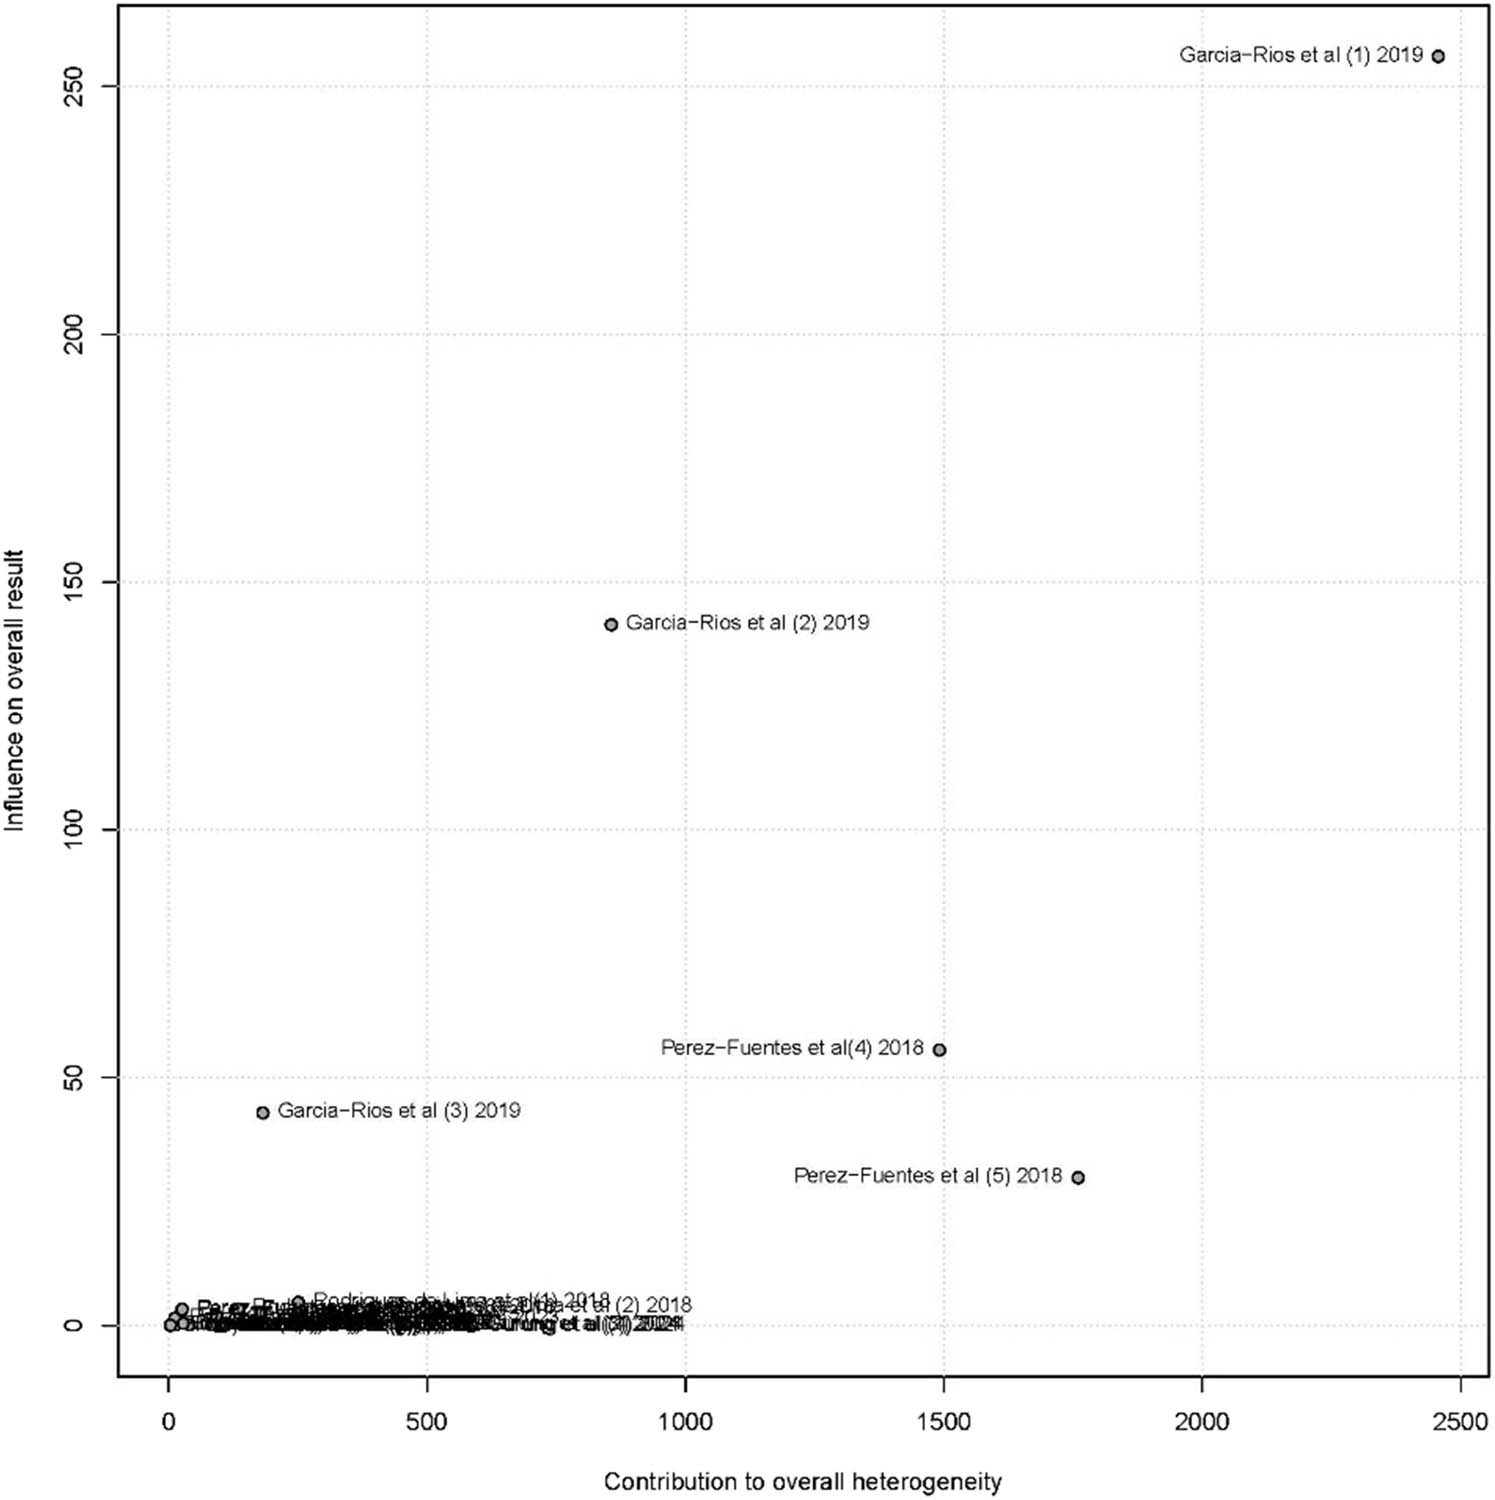
Figure 6
Baujat plot indicating studies with disproportionate influence on heterogeneity in the FCR meta-analysis.
Egger’s test showed a statistically significant intercept (–15.76, p = 0.0001), confirming publication bias (Figure 7). This suggests that studies with no change or worsened FCR under BFT are likely underrepresented in the literature.
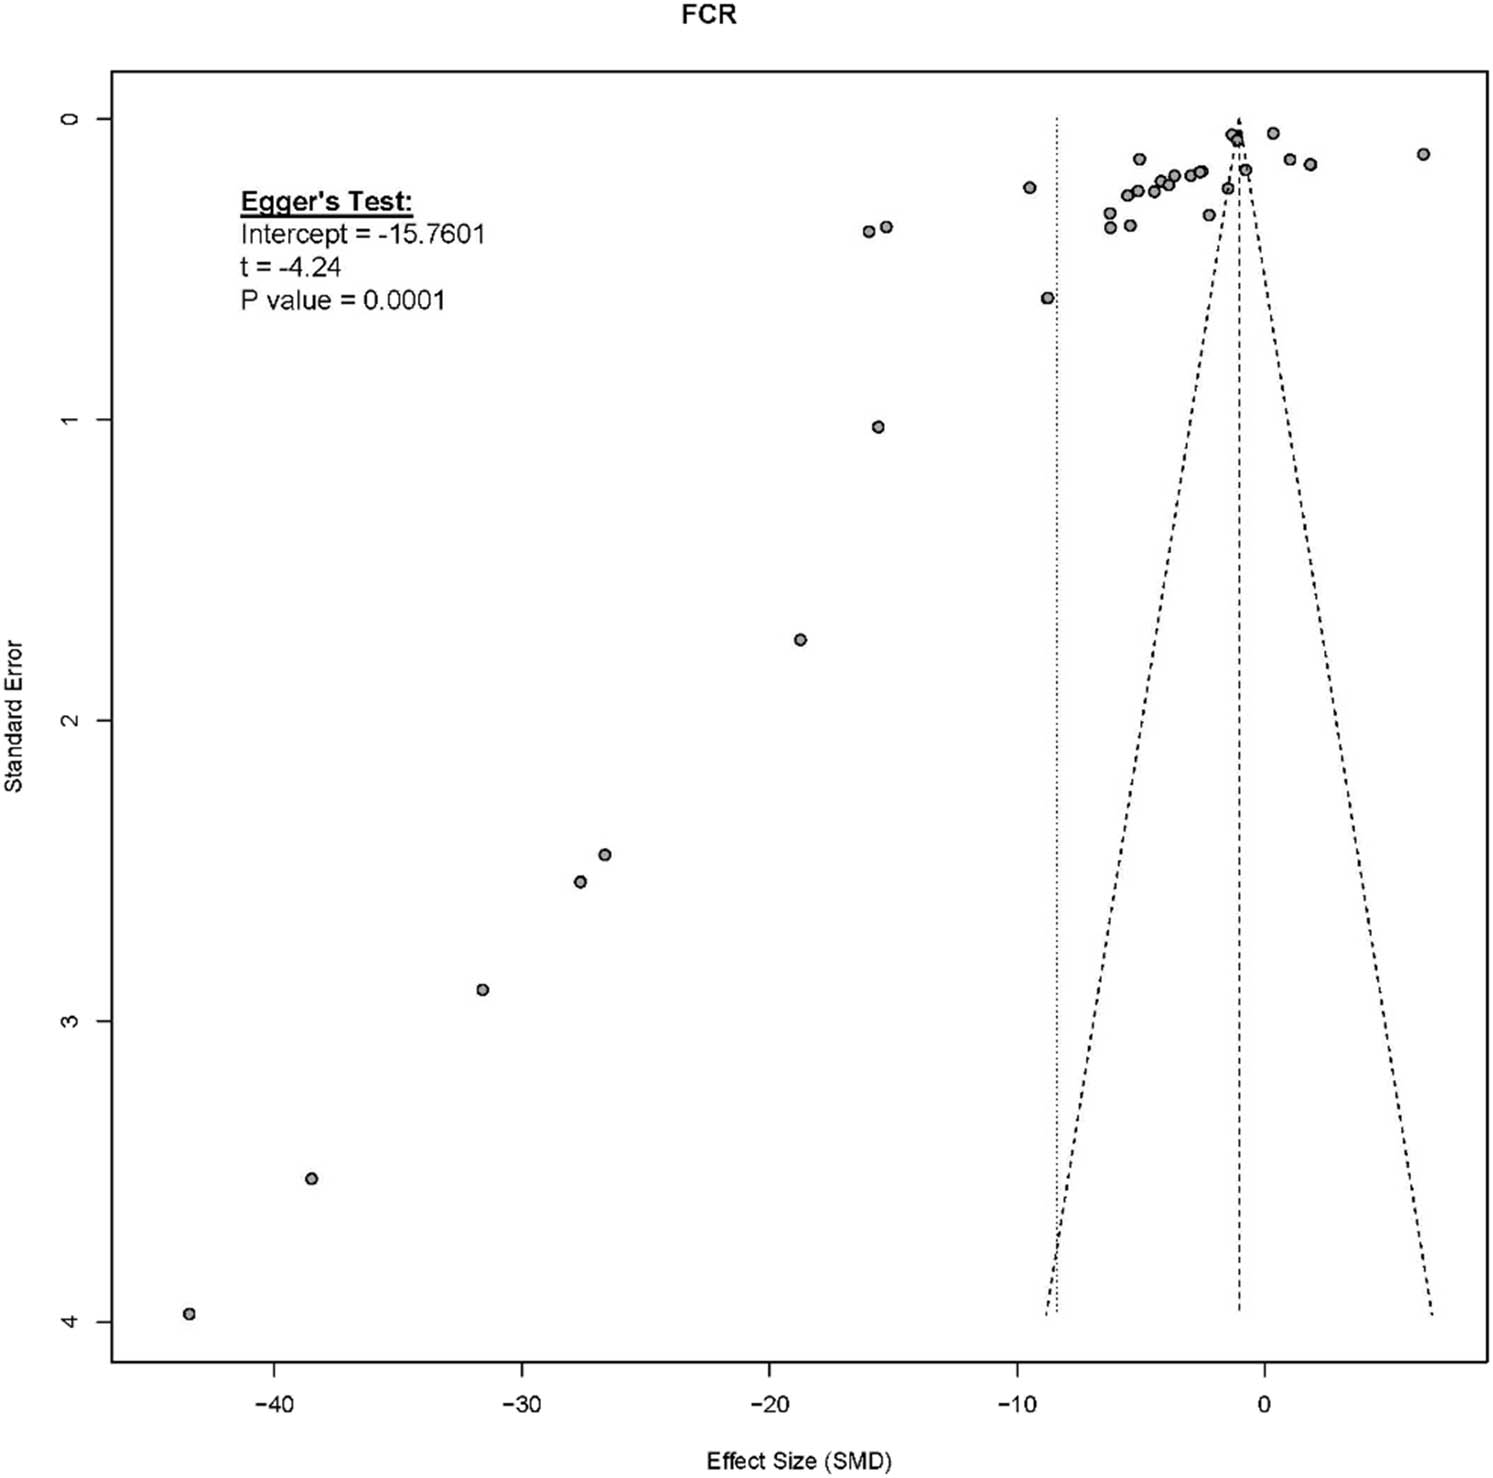
Figure 7
Funnel plot examining asymmetry and potential publication bias for FCR studies.
3.1.3. Survival rate
Survival rates were also positively affected by the implementation of BFT, with a pooled SMD of 3.09 (95% CI: 2.18−3.99) (Figure 8), indicating that tilapia in BFT systems experienced significantly higher survivability. This benefit is likely due to improved water quality, enhanced immune response, and the prebiotic and probiotic effects of microbial aggregates in biofloc systems (El-Hawarry et al., 2021; Xu & Pan, 2012). Stable water parameters, particularly lower ammonia and nitrite levels, contribute to reduced stress and mortality, while constant ingestion of microbial flocs may enhance gut health and innate immunity (Crab et al., 2012).
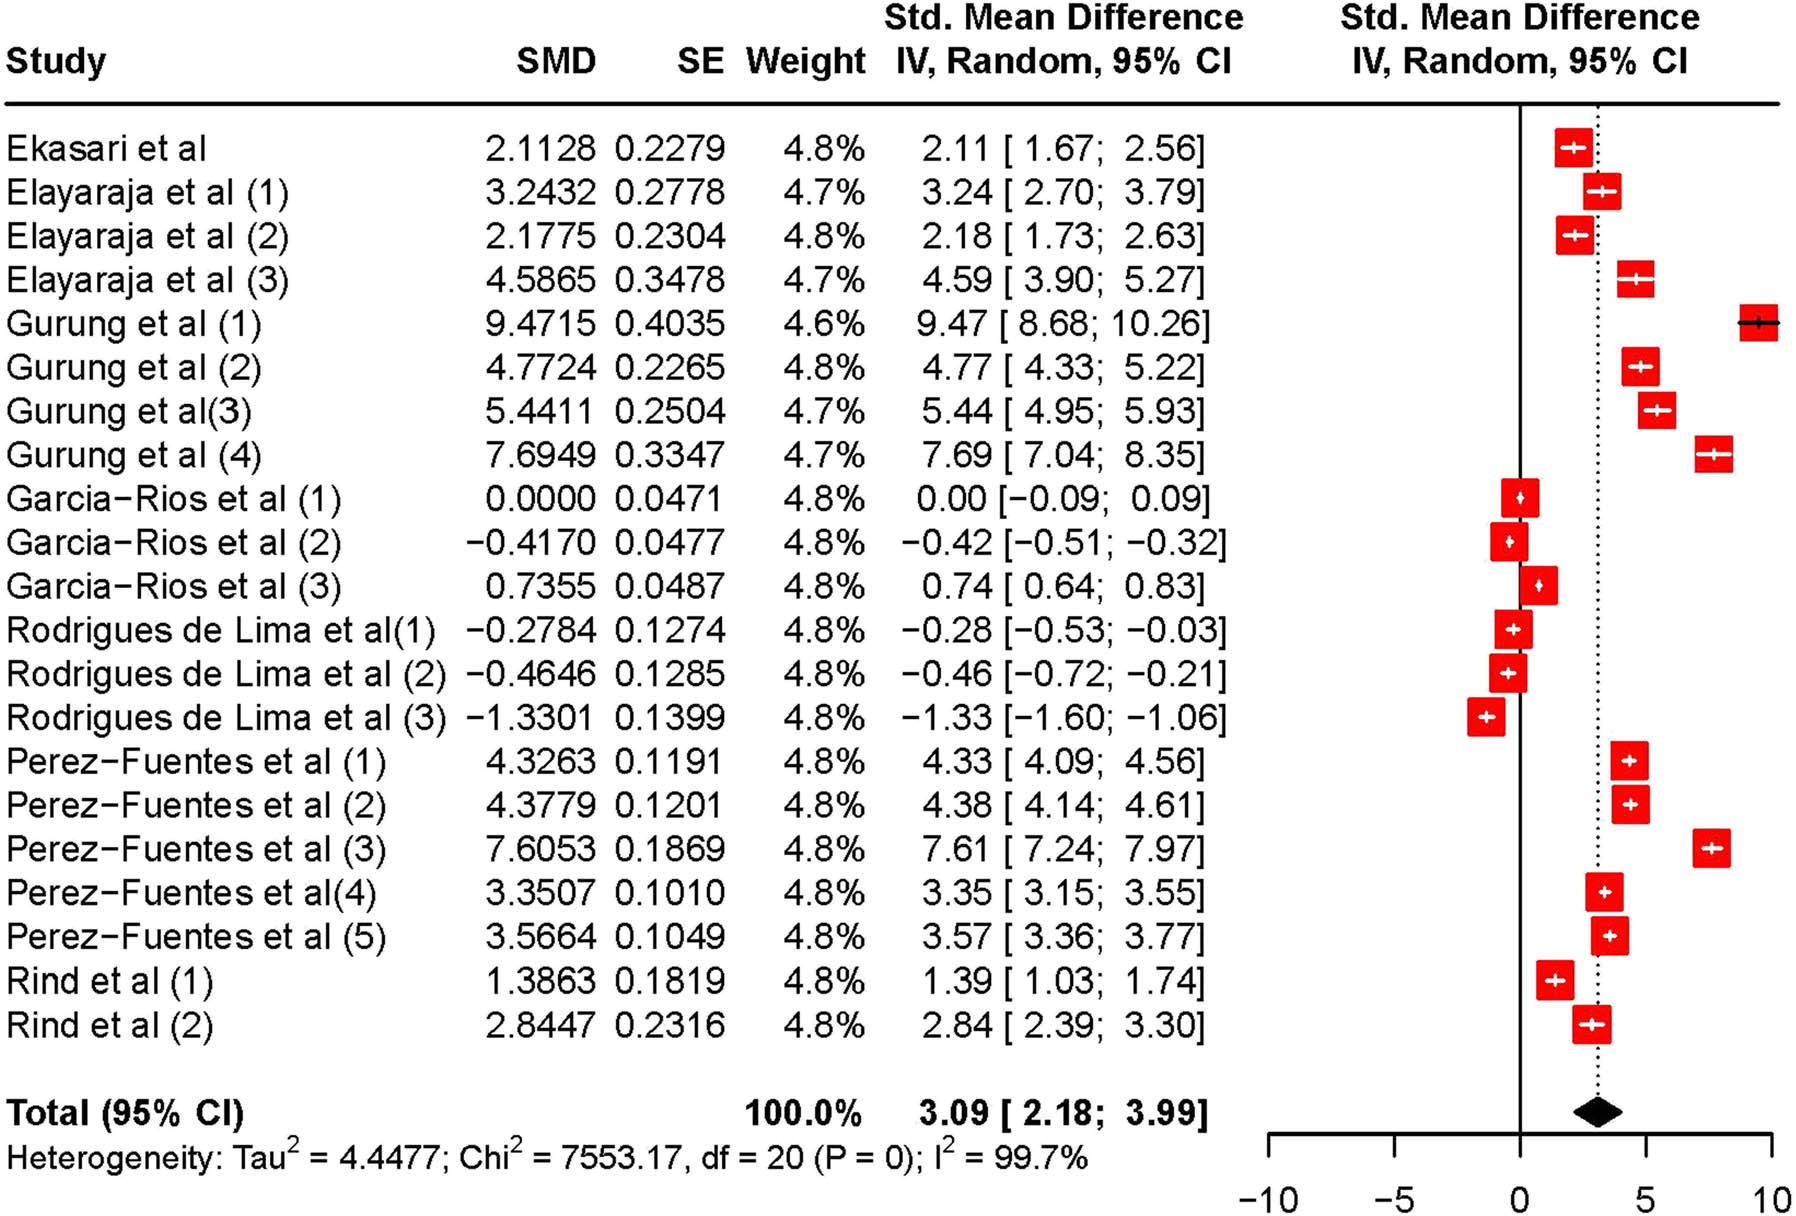
Figure 8
Forest plot presenting the effect of BFT on survival rate of tilapia compared to control systems.
Heterogeneity was again high (I 2 = 99.7%), with Pérez-Fuentes et al. (3) and García-Ríos et al (2) exerting strong influence on the overall heterogeneity, and García-Ríos et al. (2) influencing the overall effect size (Figure 9). These studies may differ in methodology, culture duration, or fish health status at the start of the trials.
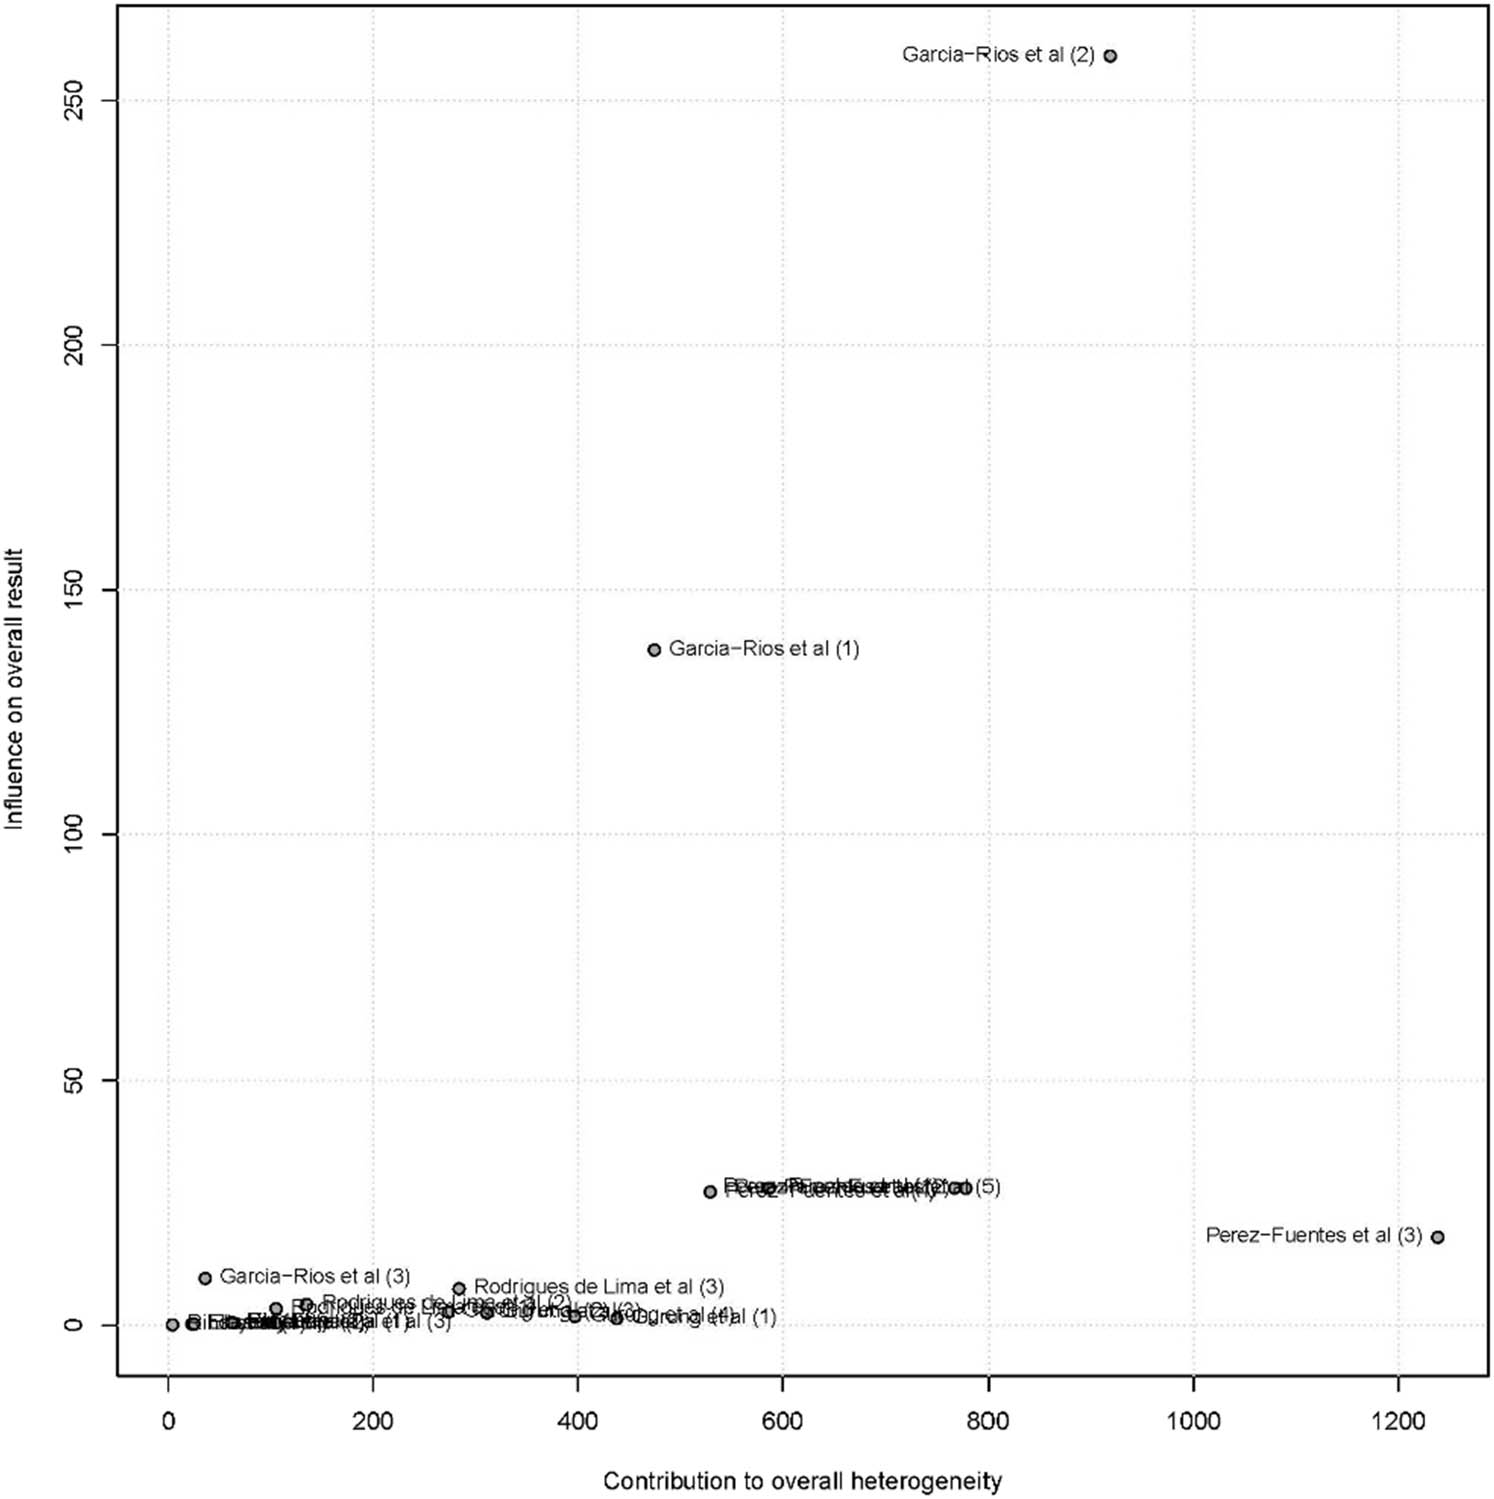
Figure 9
Baujat plot identifying studies contributing most to heterogeneity in survival rate outcomes.
Egger’s test revealed significant publication bias (intercept = 21.26, P = 0.0012) (Figure 10), suggesting that studies reporting no survival benefit may be underrepresented in the published literature.
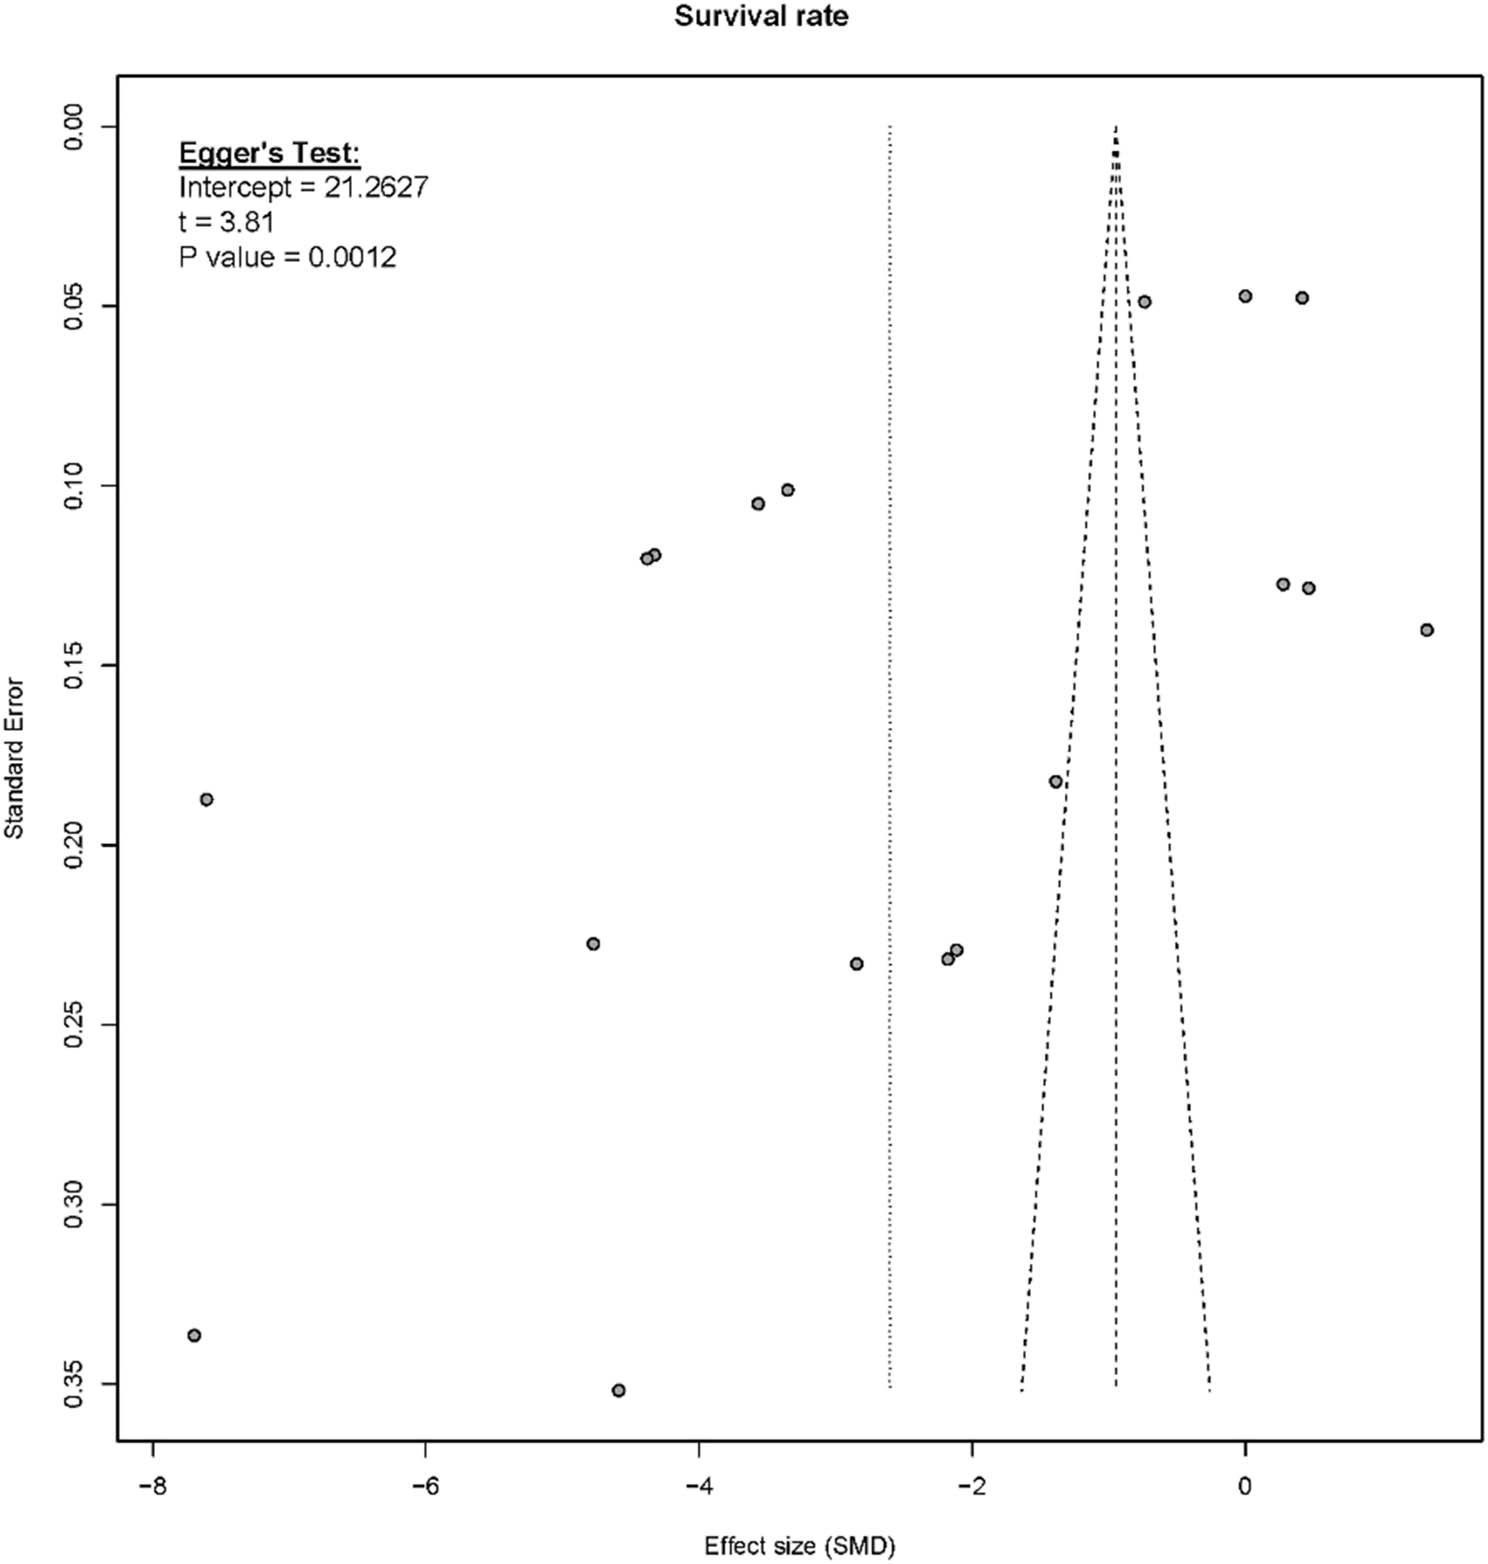
Figure 10
Funnel plot evaluating potential publication bias in survival rate studies.
The results of the meta-analysis confirm the consistent improvement of growth performance parameters under BFT systems compared to conventional culture methods. Across the reviewed studies, BFT was associated with significantly higher SGR and survival rate, alongside lower FCR values, indicating enhanced feed efficiency and biomass gain (Khanjani et al., 2020; Emerenciano et al., 2017). These results highlight the biological advantages conferred by the microbial loop, where heterotrophic bacteria convert nitrogenous waste into microbial protein, which is subsequently consumed by tilapia (Avnimelech, 2015; Ekasari et al., 2014). This microbial supplementation reduces reliance on commercial feed, which is often the most significant cost component in tilapia production, thereby improving the overall cost-efficiency. However, the magnitude of improvement in each parameter was not uniform across studies, suggesting that these gains are highly sensitive to variations in system management, stocking density, and environmental control (Raza et al., 2024; Serafini et al., 2025). Overall, while the meta-analysis confirms the biological potential of BFT to enhance tilapia growth, achieving consistent outcomes at scale remains dependent on rigorous operational control and context-specific adaptation.
3.2. Water quality parameters
3.2.1. DO
The meta-analysis revealed a significantly reduced concentration of DO in BFT systems compared to conventional culture systems, with a pooled SMD of –9.15 (95% CI: –14.18 to –4.11) (Figure 11). This decrease reflects the inherent oxygen-intensive nature of heterotrophic microbial activity central to biofloc formation and maintenance (Avnimelech, 1999). The oxidation of organic carbon added to stimulate microbial growth dramatically increases biological oxygen demand (BOD), especially in systems with high stocking densities and limited water exchange (Emerenciano et al., 2012).
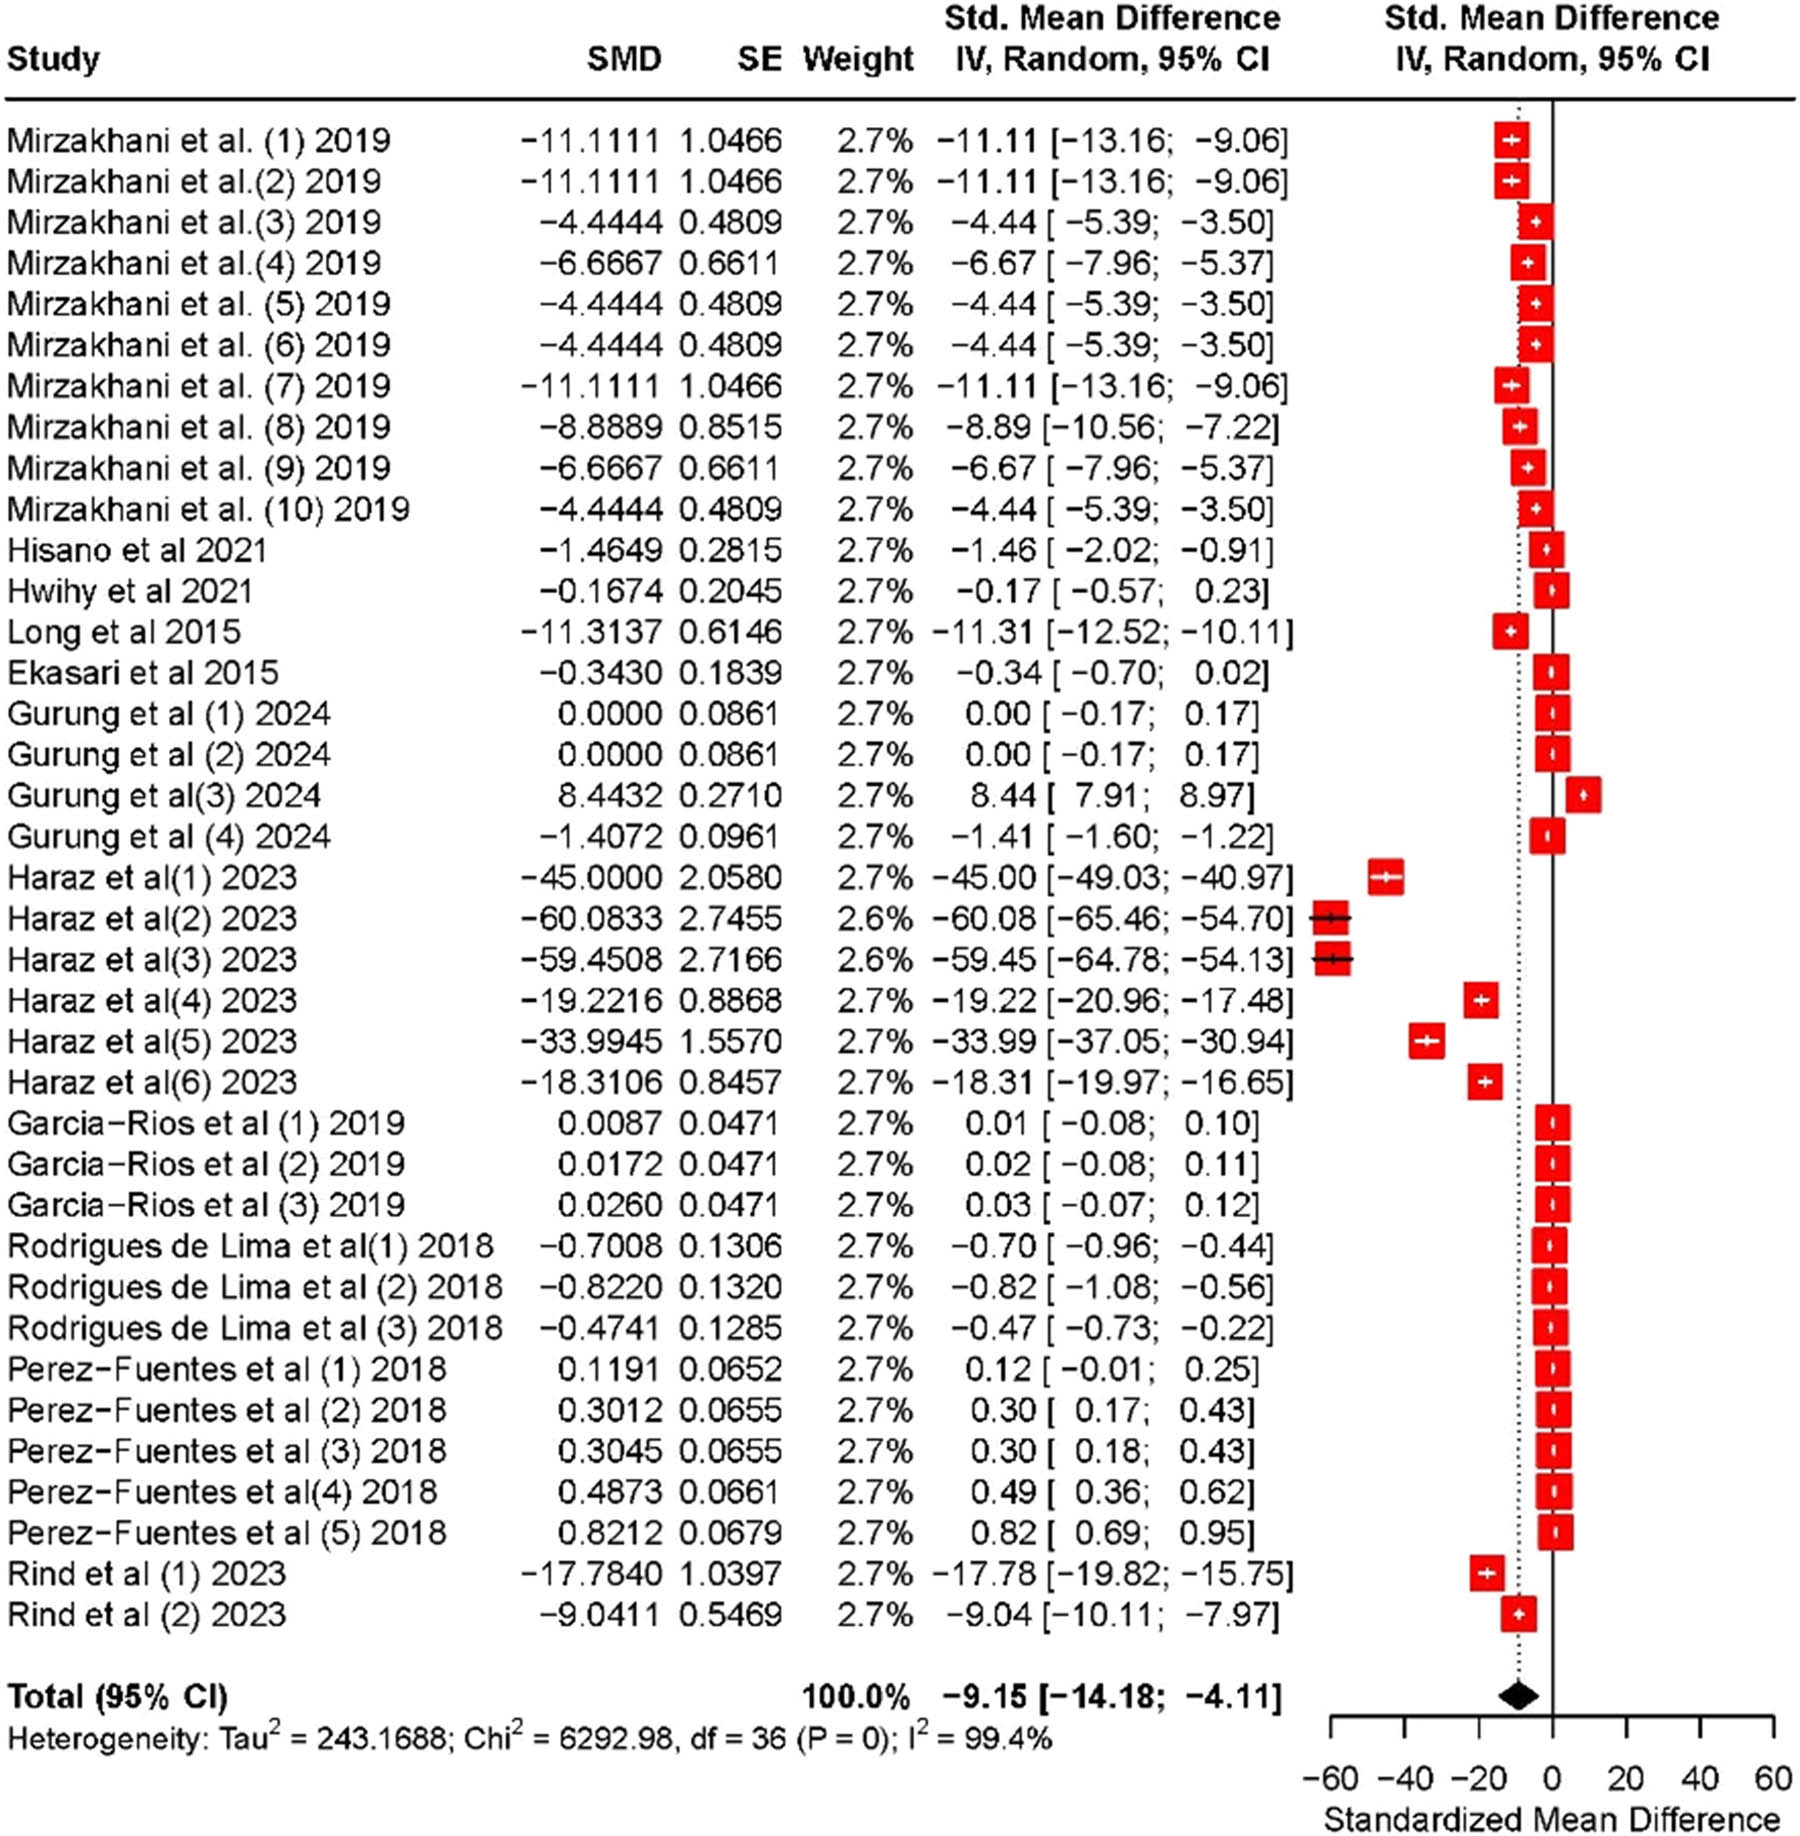
Figure 11
Forest plot showing the effect of BFT on DO levels in tilapia culture systems.
The depletion of DO in BFT systems has significant implications for fish health and system design. DO levels below 4 mg/L can induce stress and affect growth and immunity in tilapia (Martins et al., 2017). Although BFT systems had low DO concentrations compared to the control, all concentrations were above 5 mg/L except for de Lima et al., (2018) where the lowest DO was 4.49 mg/L. These DO concentrations are within the limits for the growth of tilapias. Consequently, aeration becomes the most energy-intensive component of BFT, accounting for over 40–60% of total energy usage in some cases (Li et al., 2025). Aeration capacity must therefore be scaled appropriately to microbial load and feeding rate, particularly during peak respiration periods (e.g. night).
The heterogeneity for DO was high (I 2 = 99.4%), influenced by García-Ríos et al. (2 and 3) and Haraz et al. (2 and 3) influencing the overall effect size (Figure 12), which may have used different aeration schemes or had higher organic loading.
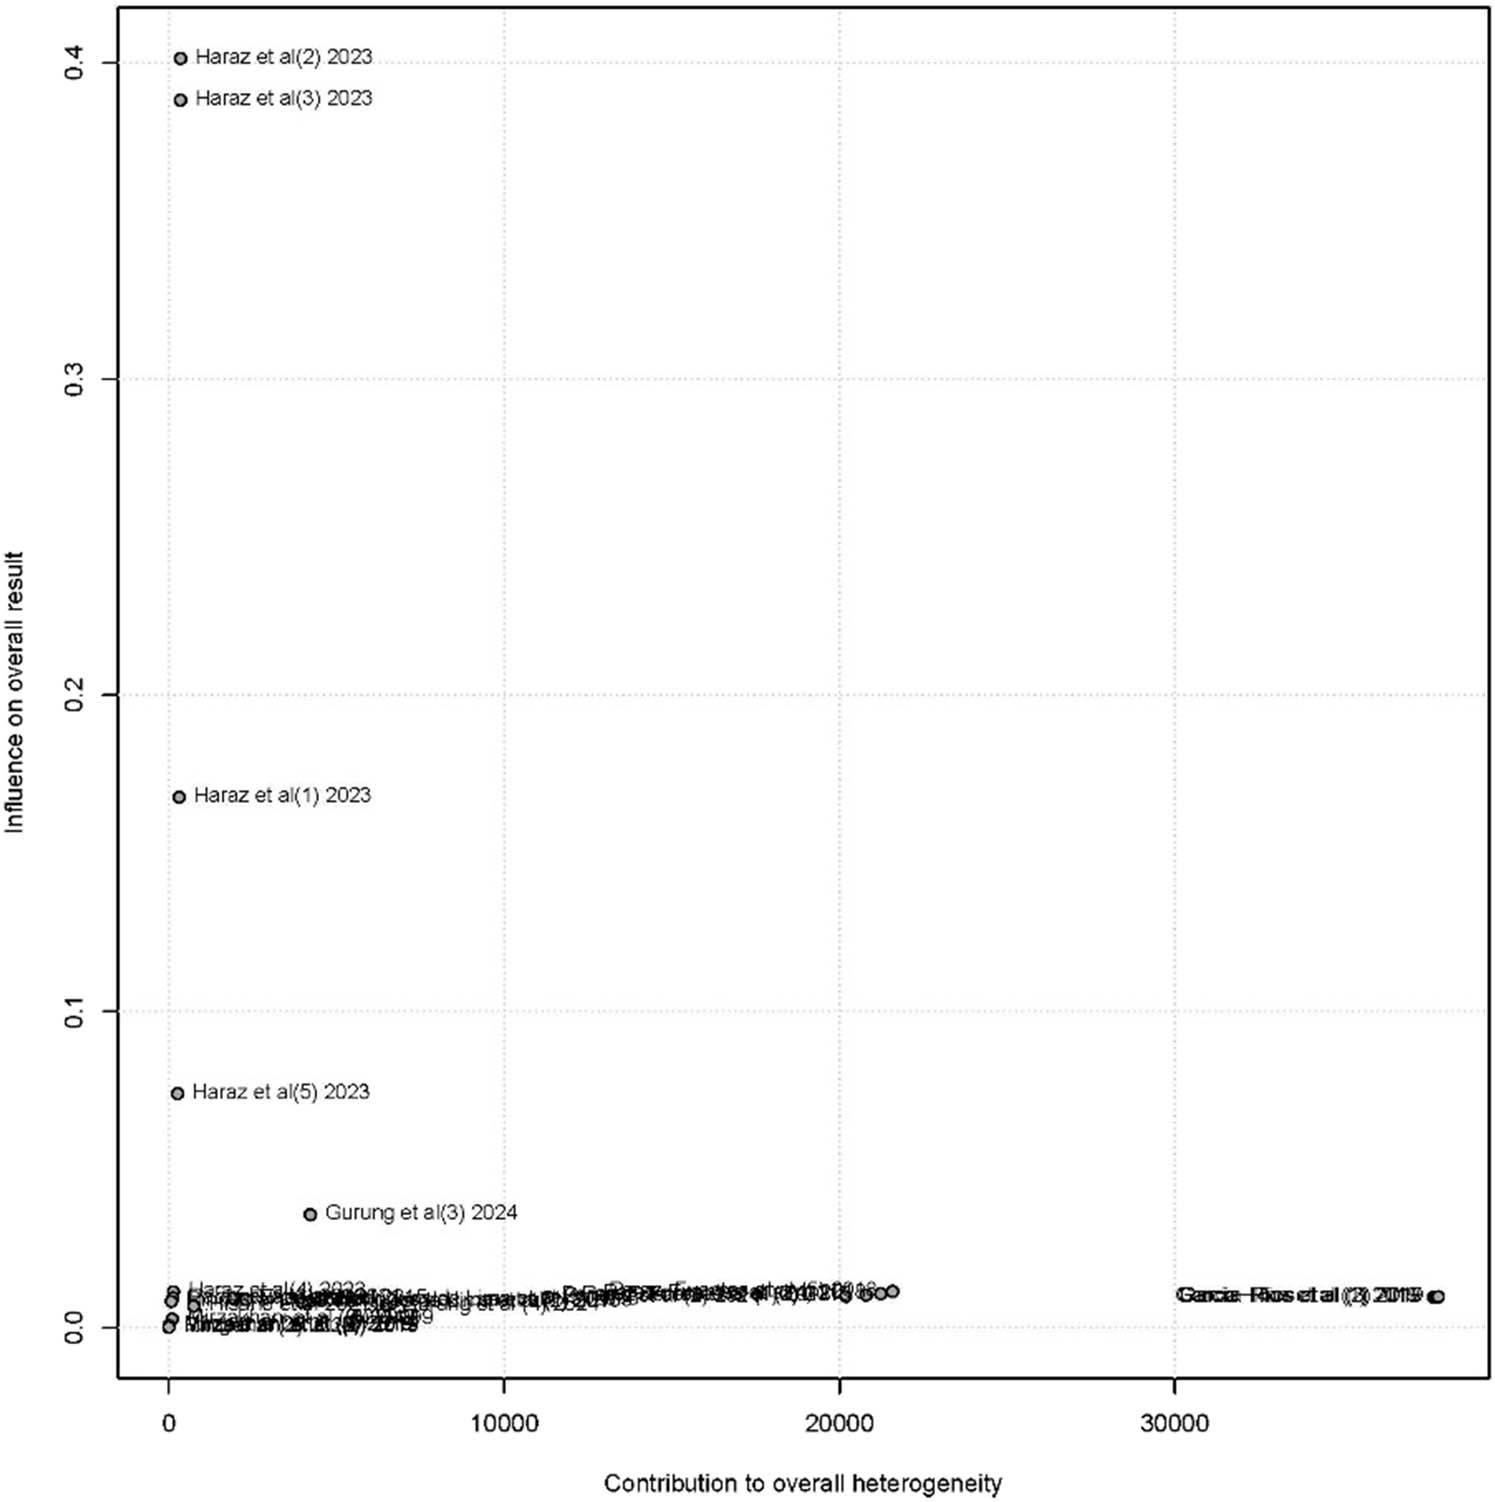
Figure 12
Baujat plot highlighting studies with the greatest influence on heterogeneity in DO outcomes.
Egger’s test indicated significant bias (intercept = 13.32, P = 0.0001) (Figure 13), suggesting a possible publication tendency towards studies reporting sharp DO declines. Underreported studies with efficient aeration and minimal DO loss may exist but are not adequately represented in the meta-analytic dataset. It is recommended that continuous DO monitoring and automated aeration control systems be implemented as they are crucial in BFT operations. This can help maintain DO above critical thresholds (Azim & Little, 2008). Furthermore, regulating feeding and carbon input can indirectly modulate microbial oxygen demand.
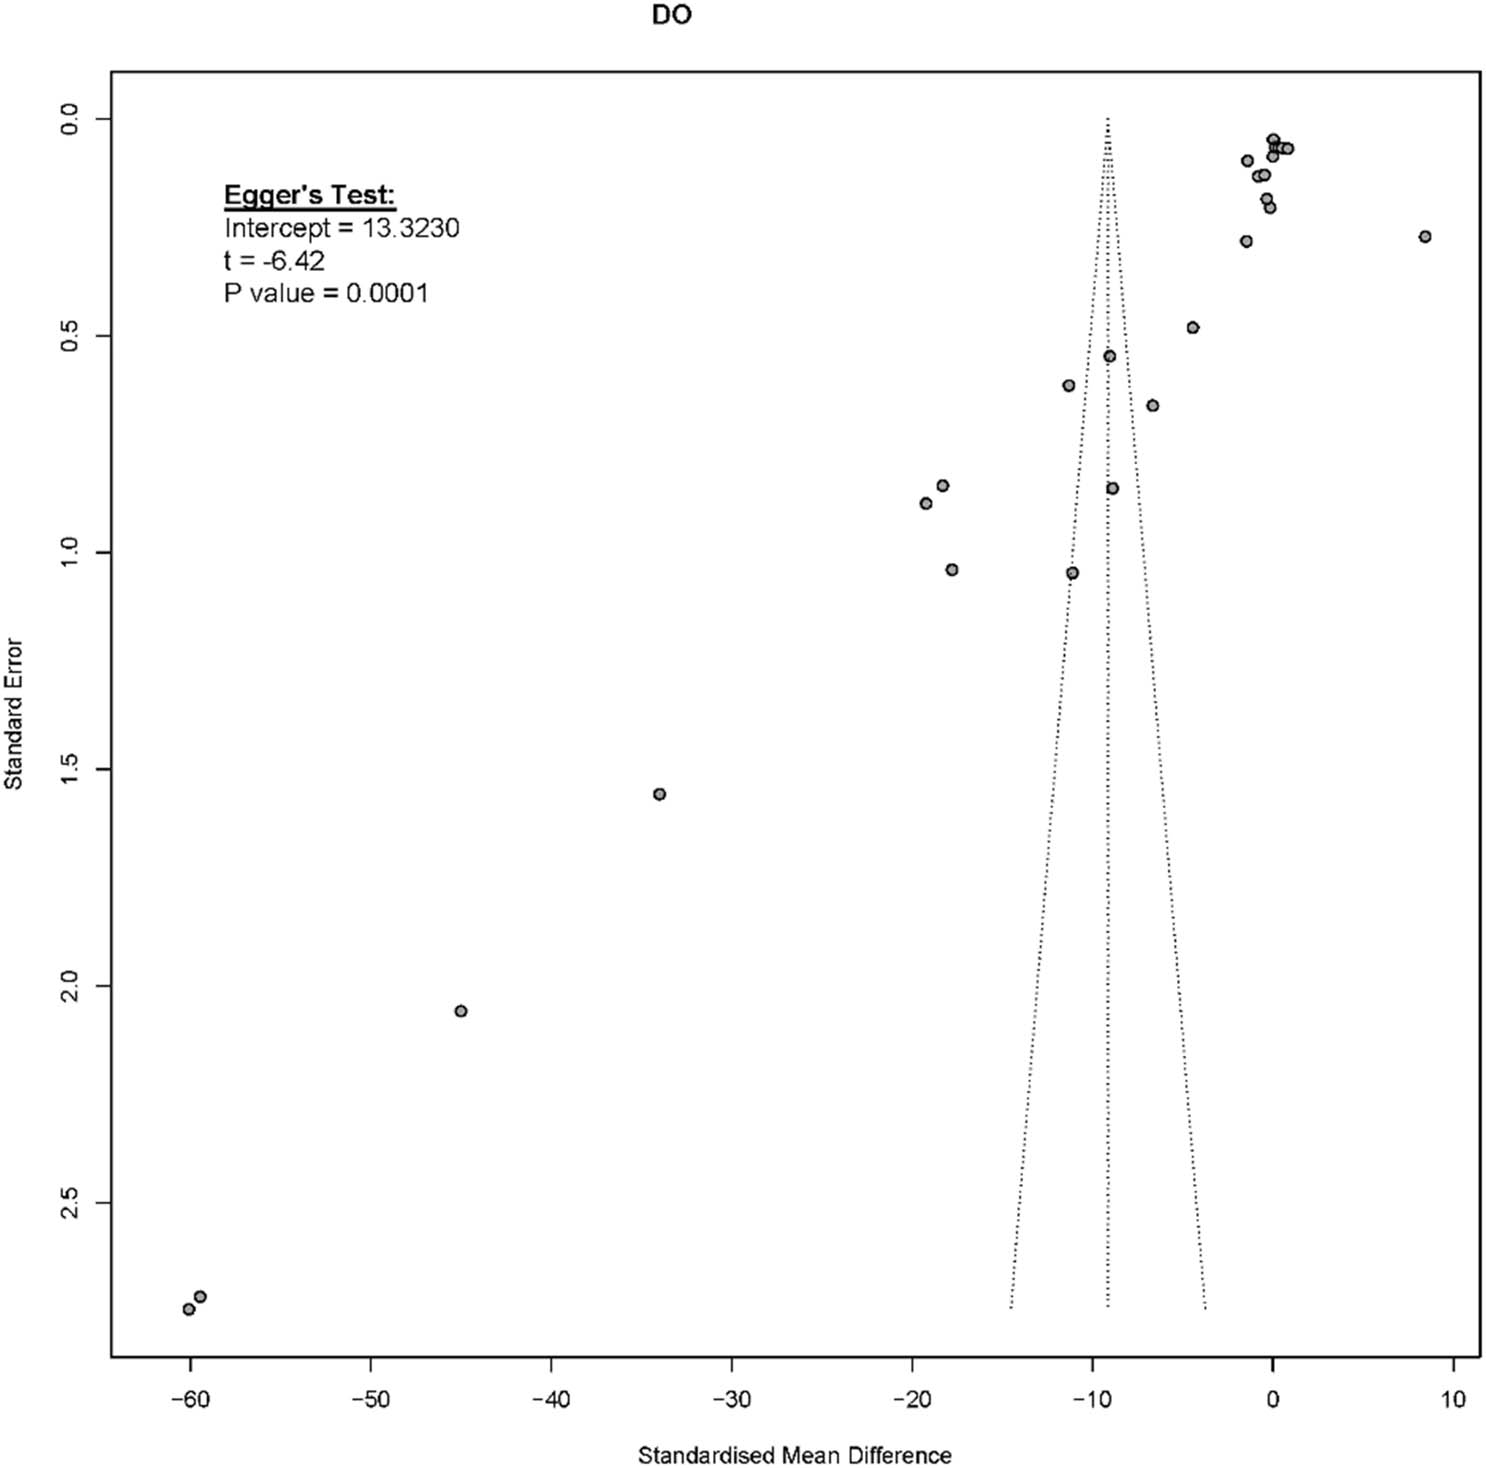
Figure 13
Funnel plot assessing asymmetry and potential publication bias for DO studies.
3.2.2. Nitrite (NO2 –)
Nitrite levels were significantly higher in BFT systems compared to the controls with SMD = 4.72 (95% CI: 0.13−9.32) (Figure 14), reflecting challenges in microbial nitrification balance. In theory, biofloc systems support robust nitrifying microbial consortia, but in practice, early-stage or stressed floc environments often result in incomplete conversion of ammonia to nitrate, leading to nitrite accumulation (Ekasari et al., 2014). Nitrite is a known toxicant in tilapia culture due to its ability to interfere with haemoglobin function leading to “brown blood disease” (Jensen, 2003). The tilapia’s relative resistance to nitrite compared to other species such as salmonids may partly buffer the impact, but sustained exposure can still cause sub-lethal stress and impaired immunity (El-Hawarry et al., 2021). Recommended or nitrite limits in tilapia culture are 0.05 mg/L (Timmons & Ebeling, 2010). The highest nitrite recorded was in the study by García-Ríos et al. (2019) at 5.05 mg/L.
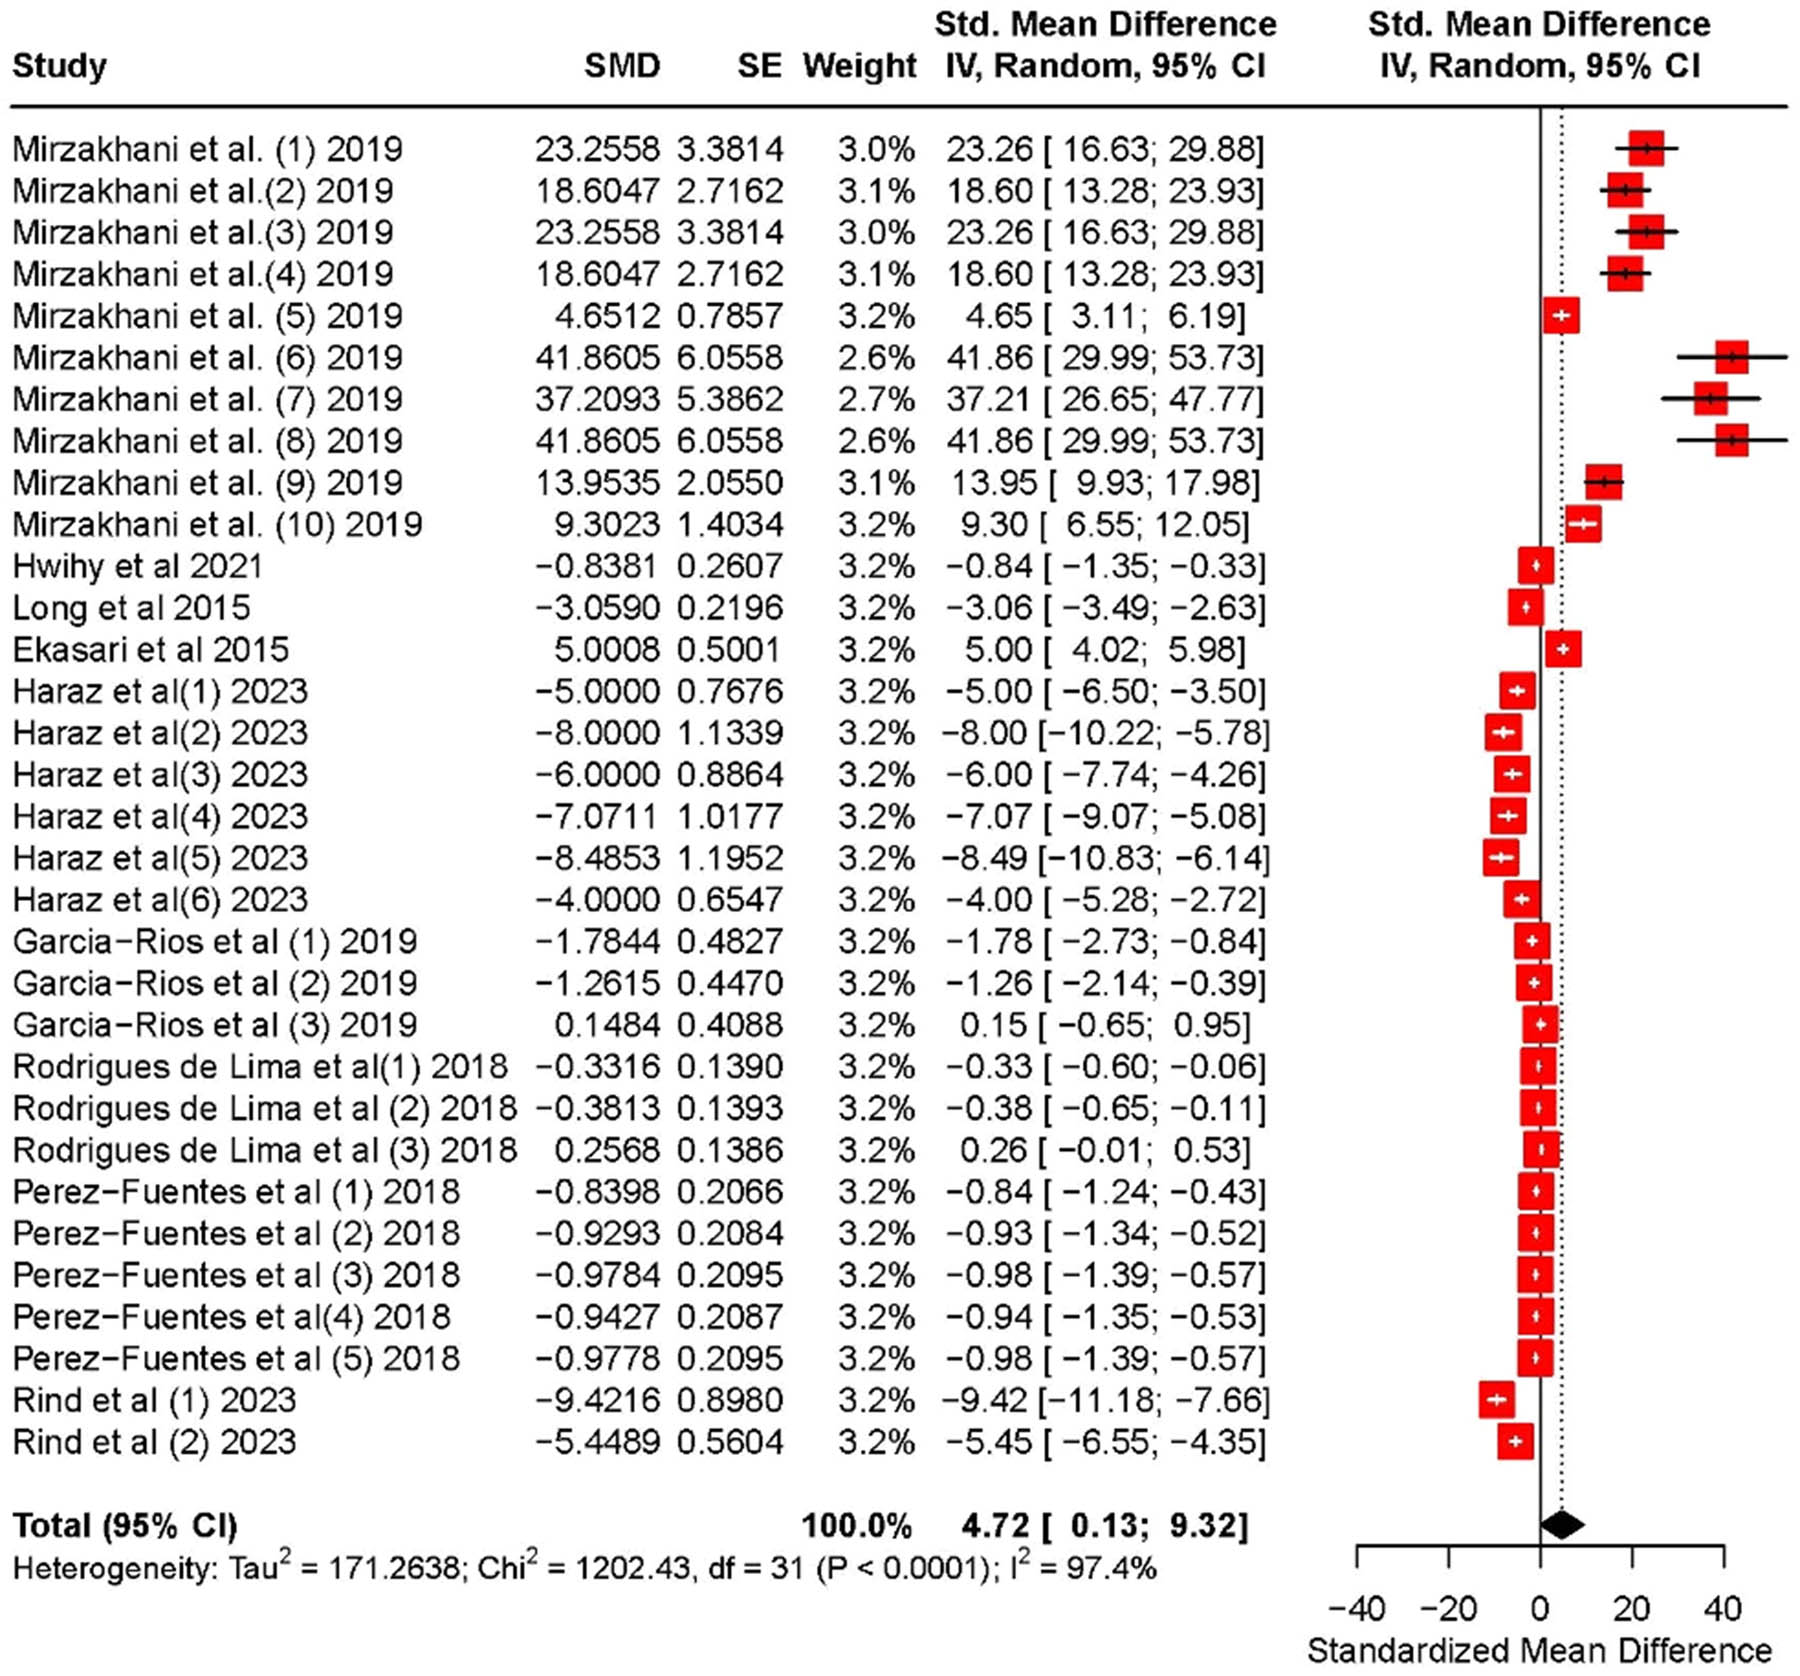
Figure 14
Forest plot presenting the effect of BFT on nitrite (NO2 –) concentrations in tilapia culture systems.
The heterogeneity for nitrite was also high (I 2 = 97.4%) and largely influenced by De Lima et al. (2) and Long et al. (2015), while Mirzakhani et al. (7 and 8) influenced the overall effect size (Figure 15).
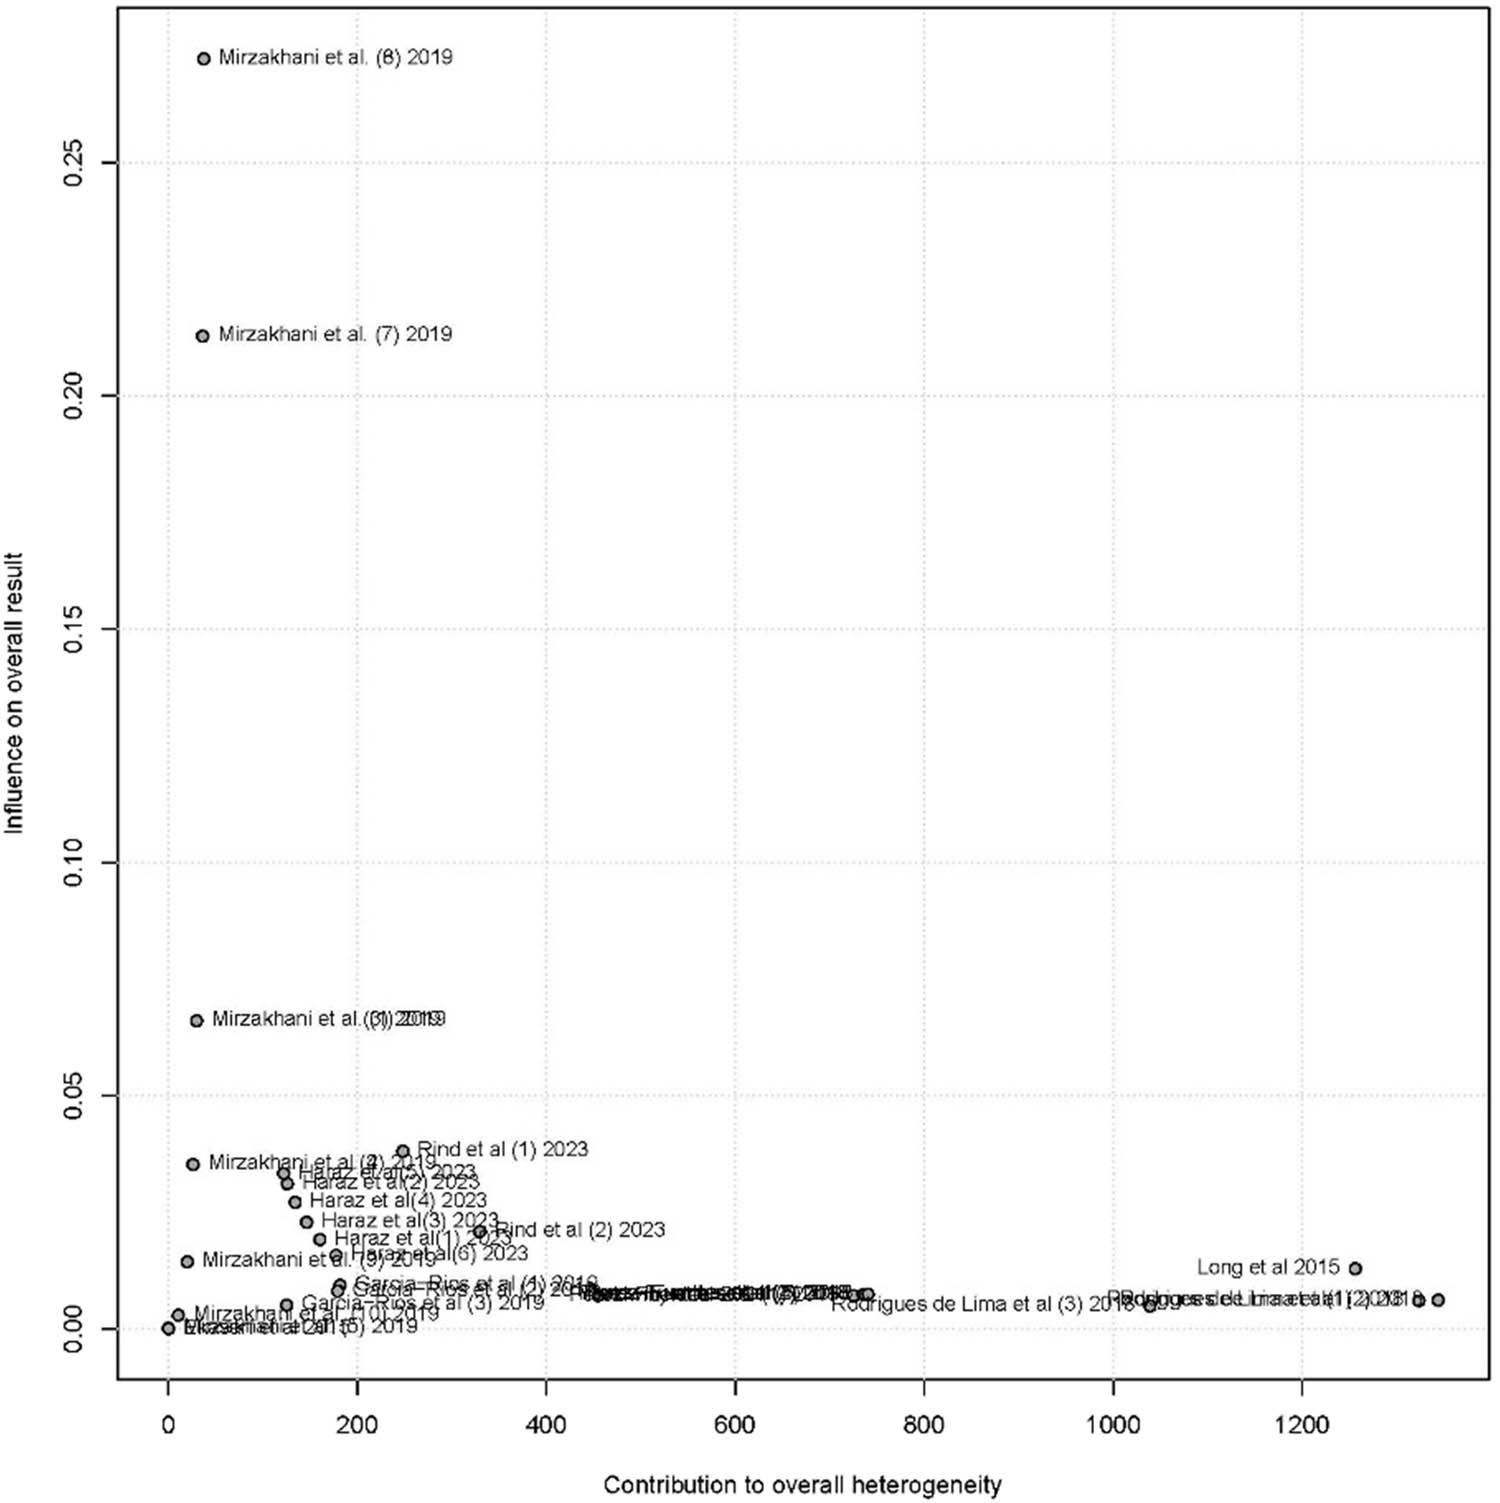
Figure 15
Baujat plot highlighting influential studies contributing to heterogeneity in NO2 - outcomes.
Unlike DO, Egger’s test showed no significant bias (intercept = 1.56, P = 0.3450) as illustrated in the funnel plot (Figure 16), suggesting more balanced representation of nitrite outcomes across studies. To prevent nitrite spikes, BFT systems should incorporate mature inoculant rich in nitrite-oxidizing bacteria (NOB) or use commercial bioaugmentation products. Maintaining optimal C:N ratios (typically 15:1–20:1 for heterotrophic dominance) and system alkalinity (>100 mg/L CaCO3) also support complete nitrification pathways (Avnimelech & Kochba, 2009; Crab et al., 2007).
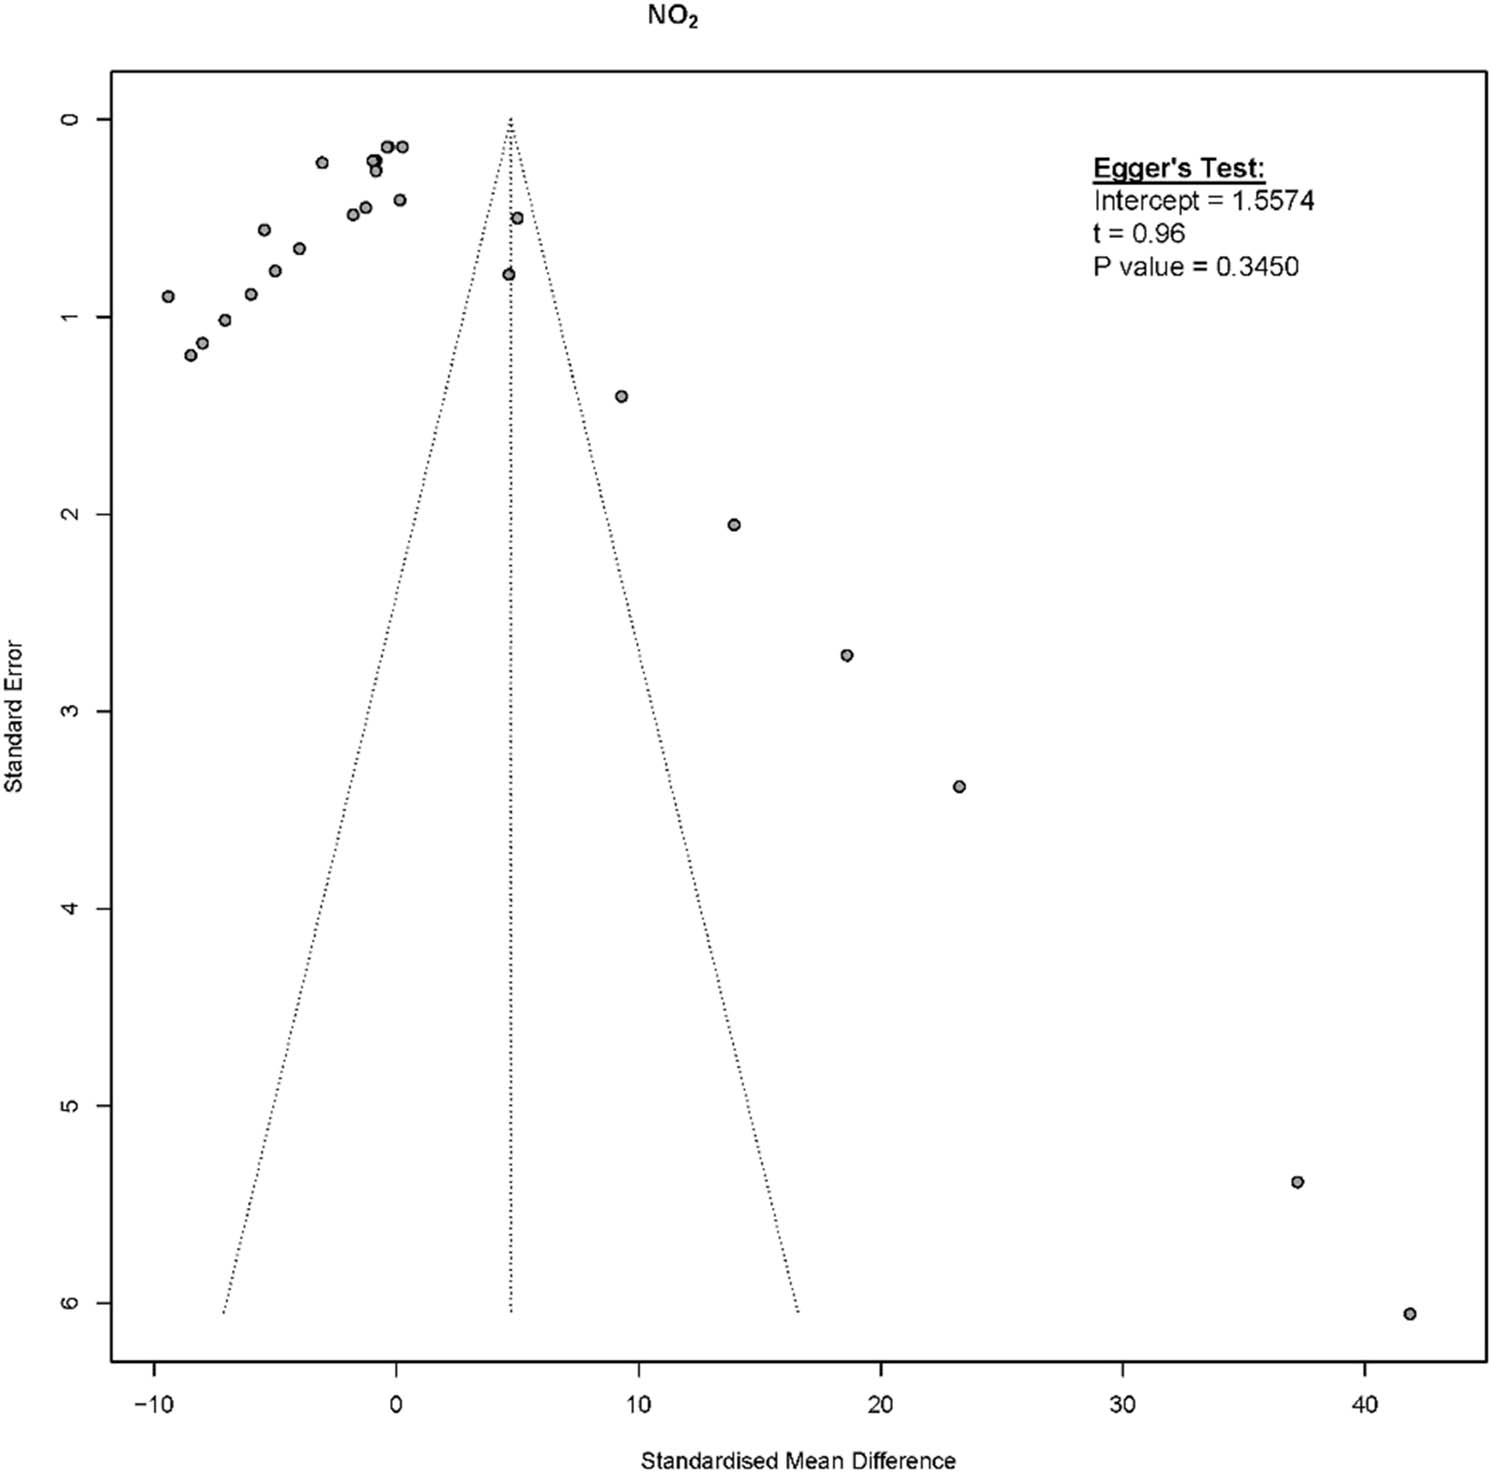
Figure 16
Funnel plot evaluating asymmetry and potential publication bias in NO2 - studies.
3.2.3. TAN
The pooled estimate for TAN showed a significant increase under BFT (SMD = 6.67; 95% CI: –3.60 to 16.94) (Figure 17), with wide CIs indicating uncertainty and variability. In well-managed systems, ammonia is rapidly assimilated by heterotrophic microbes and converted into microbial protein. However, fluctuations in feeding, carbon input, or microbial community structure can lead to temporary ammonia accumulation (Ekasari et al., 2015). Elevated TAN is a critical concern in intensive aquaculture due to its role in gill irritation, osmoregulatory dysfunction, and reduced oxygen-carrying capacity (Martins et al., 2017). In BFT systems, temporary increases in TAN often occur during start-up phases, overfeeding, or when microbial communities are destabilized by water quality stressors (e.g. low alkalinity or sudden temperature drops).
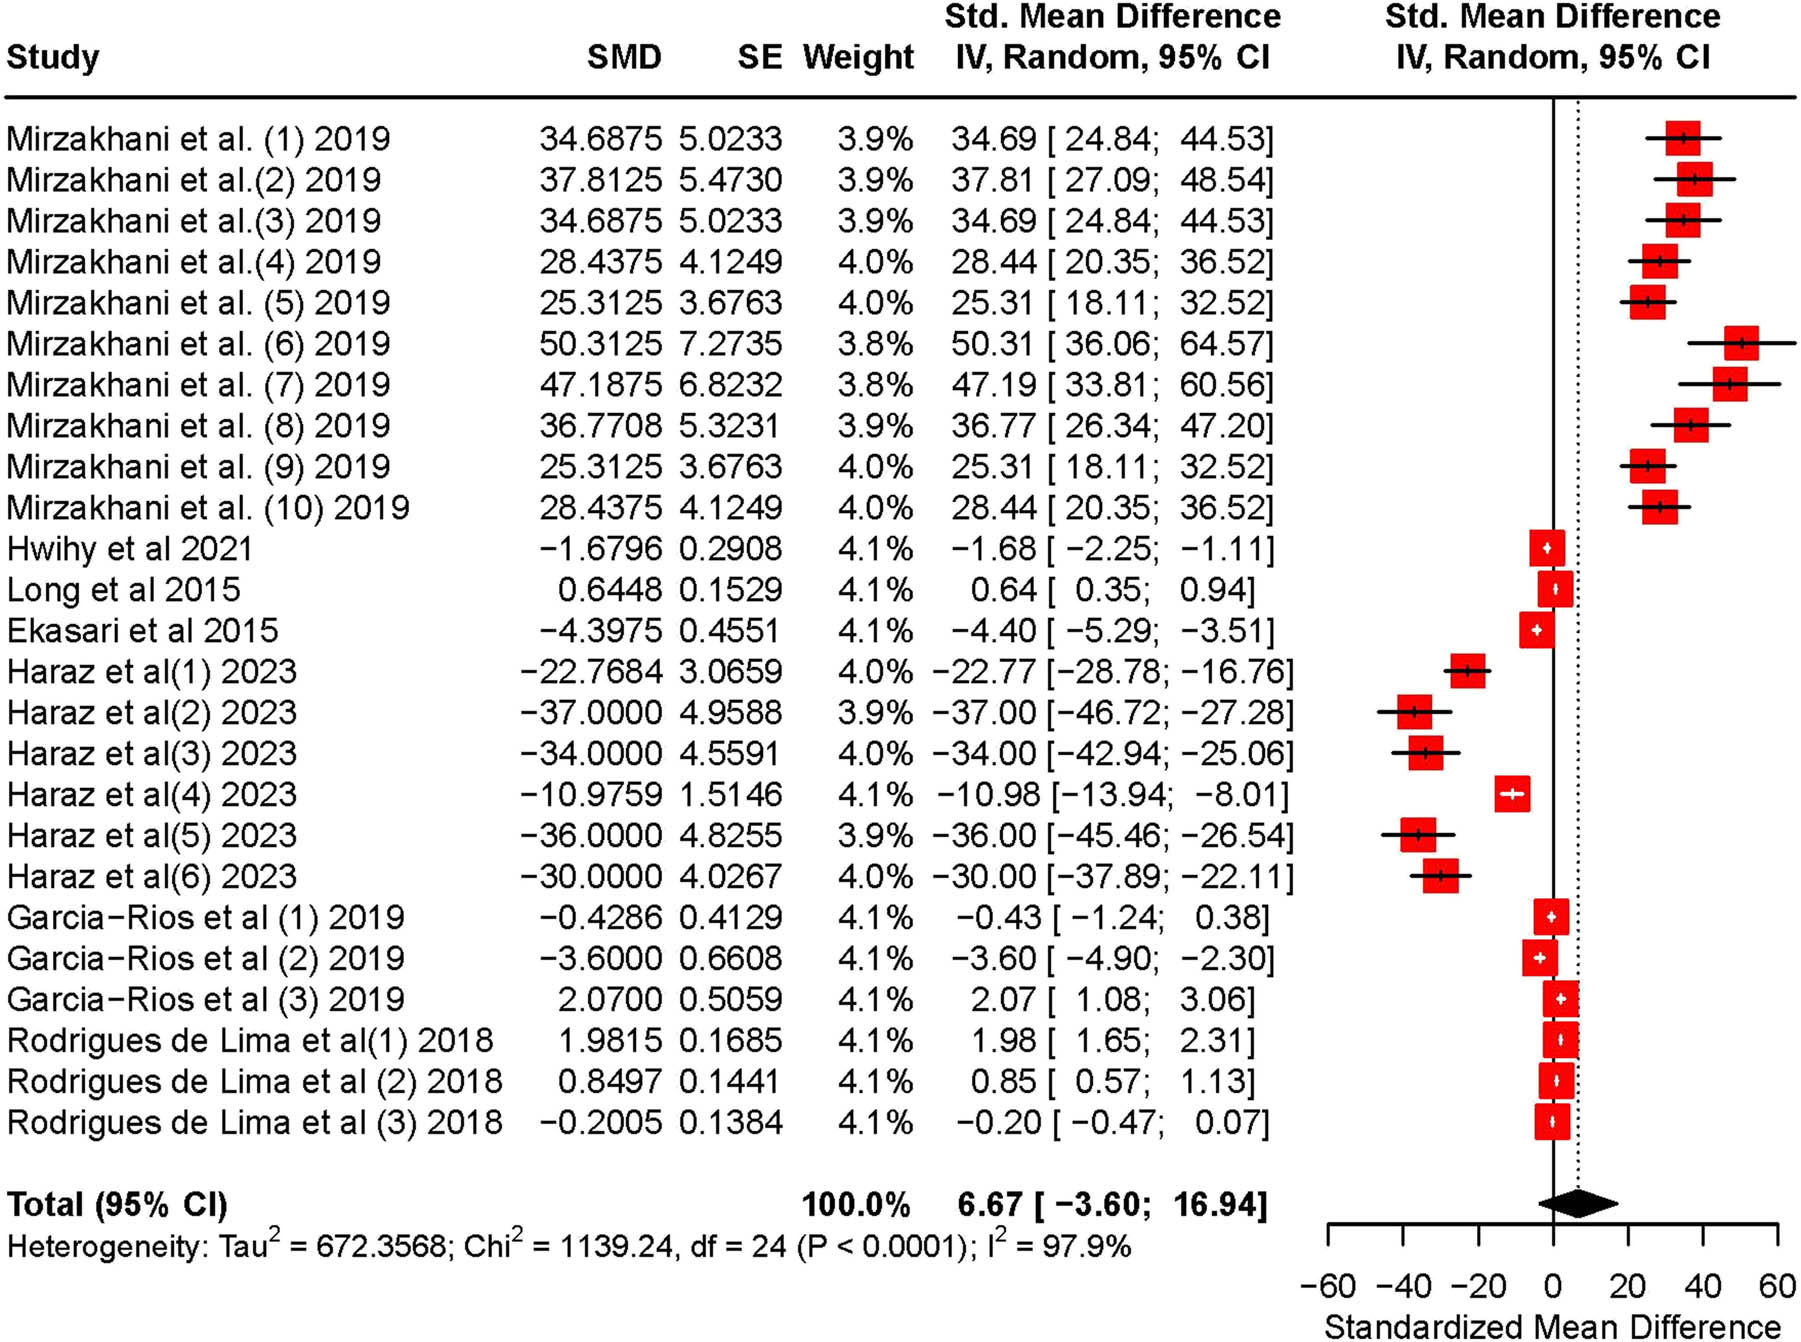
Figure 17
Forest plot showing the effect of BFT on TAN in tilapia culture systems.
The heterogeneity for TAN was also high (I 2 = 97.9%). The heterogeneity was mostly influenced by the study by De Lima et al. (3) while the overall effect size was influenced by the studies by Mirzakhani et al. (1–6) and Haraz et al. (1–5) (Figure 18). The study by de Lima et al., (2018) had the highest TAN values, which probably explains the study’s influence on heterogeneity.
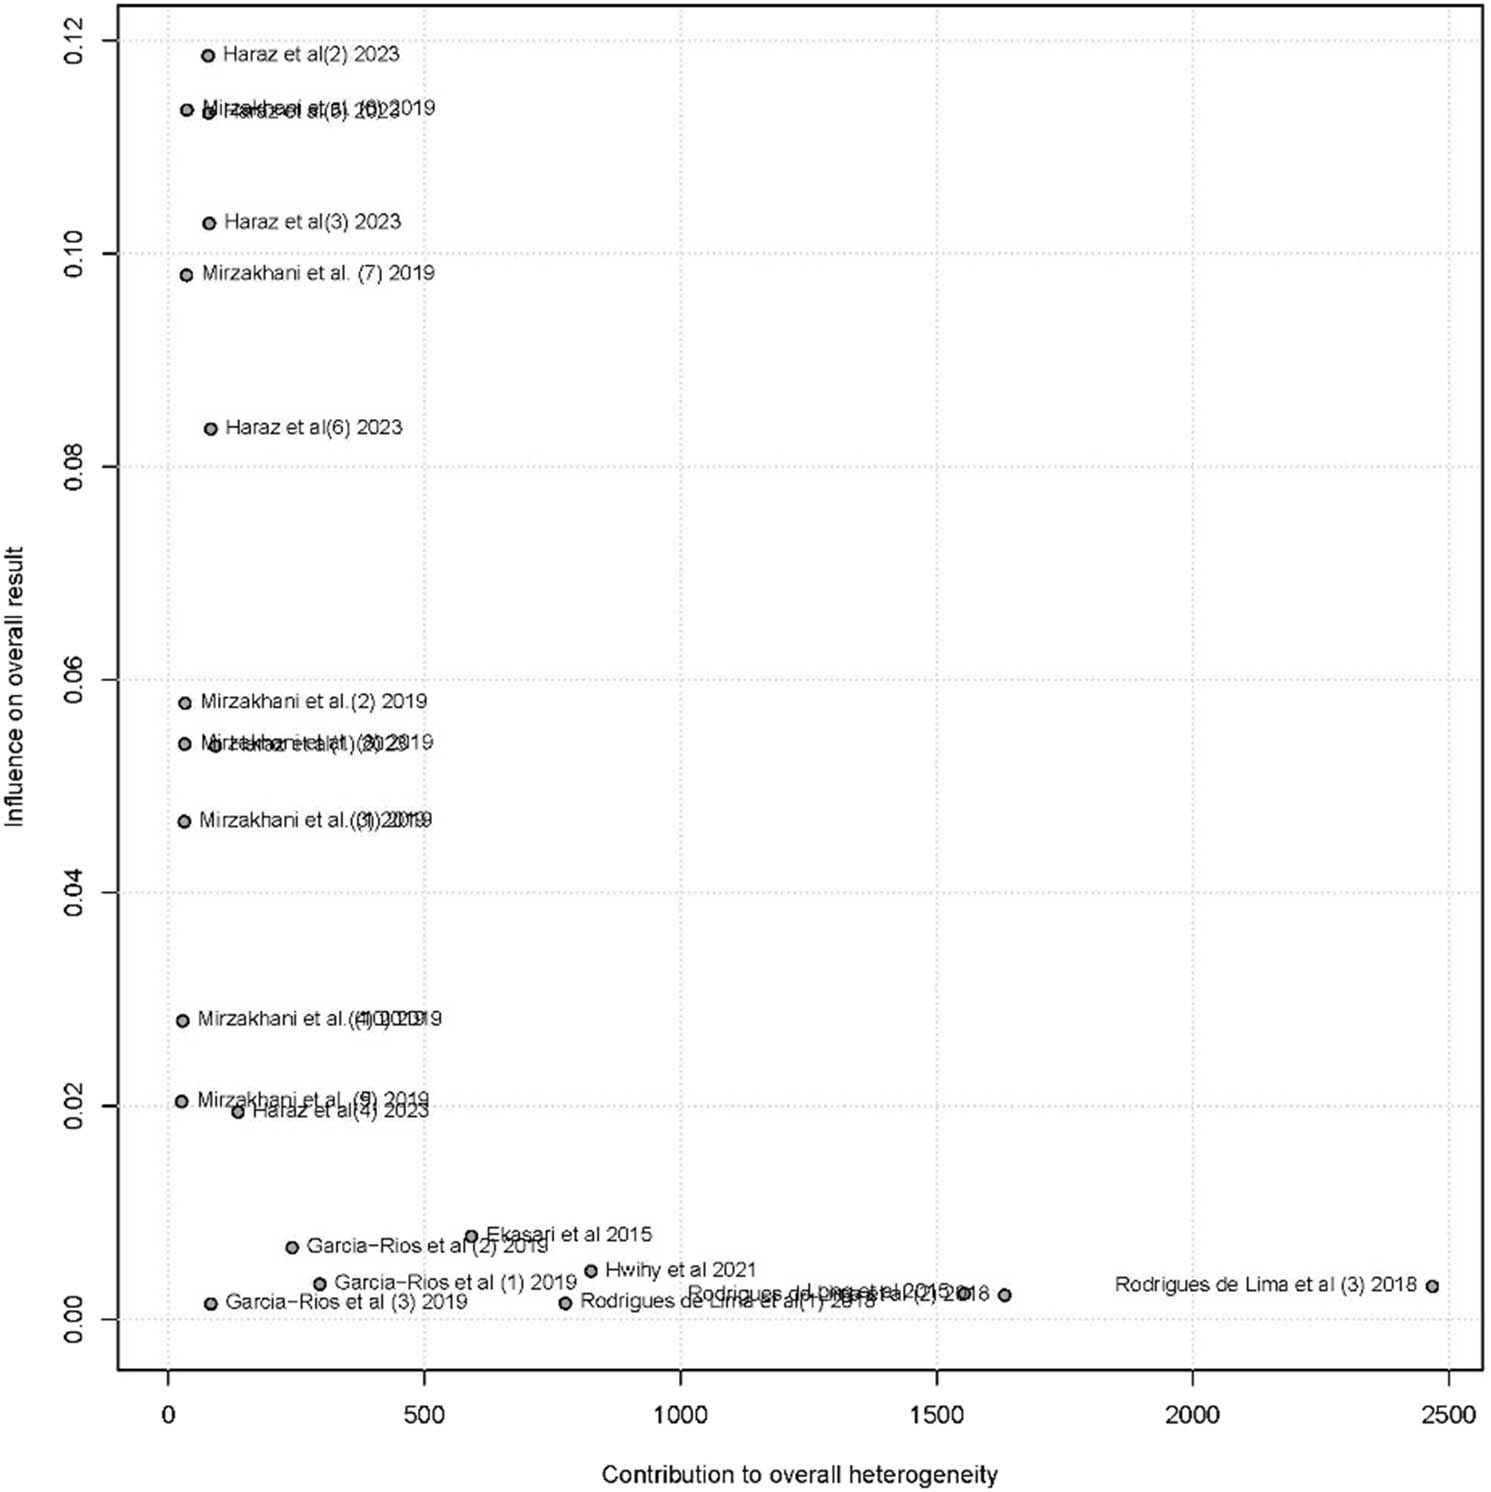
Figure 18
Baujat plot highlighting influential studies contributing to heterogeneity in TAN outcomes.
Despite the variability, Egger’s test indicated no publication bias (intercept = 0.61, P = 0.7293) (Figure 19), suggesting a realistic portrayal of TAN dynamics across studies. Stabilizing TAN in BFT systems requires consistent carbon dosing, preferably using slow-release sources (e.g. molasses, rice bran), and maintaining strong microbial assimilation. System maturation over time (4–6 weeks) typically reduces TAN variability. Farmers should also monitor pH and alkalinity, which are essential for both microbial health and nitrogen cycling.
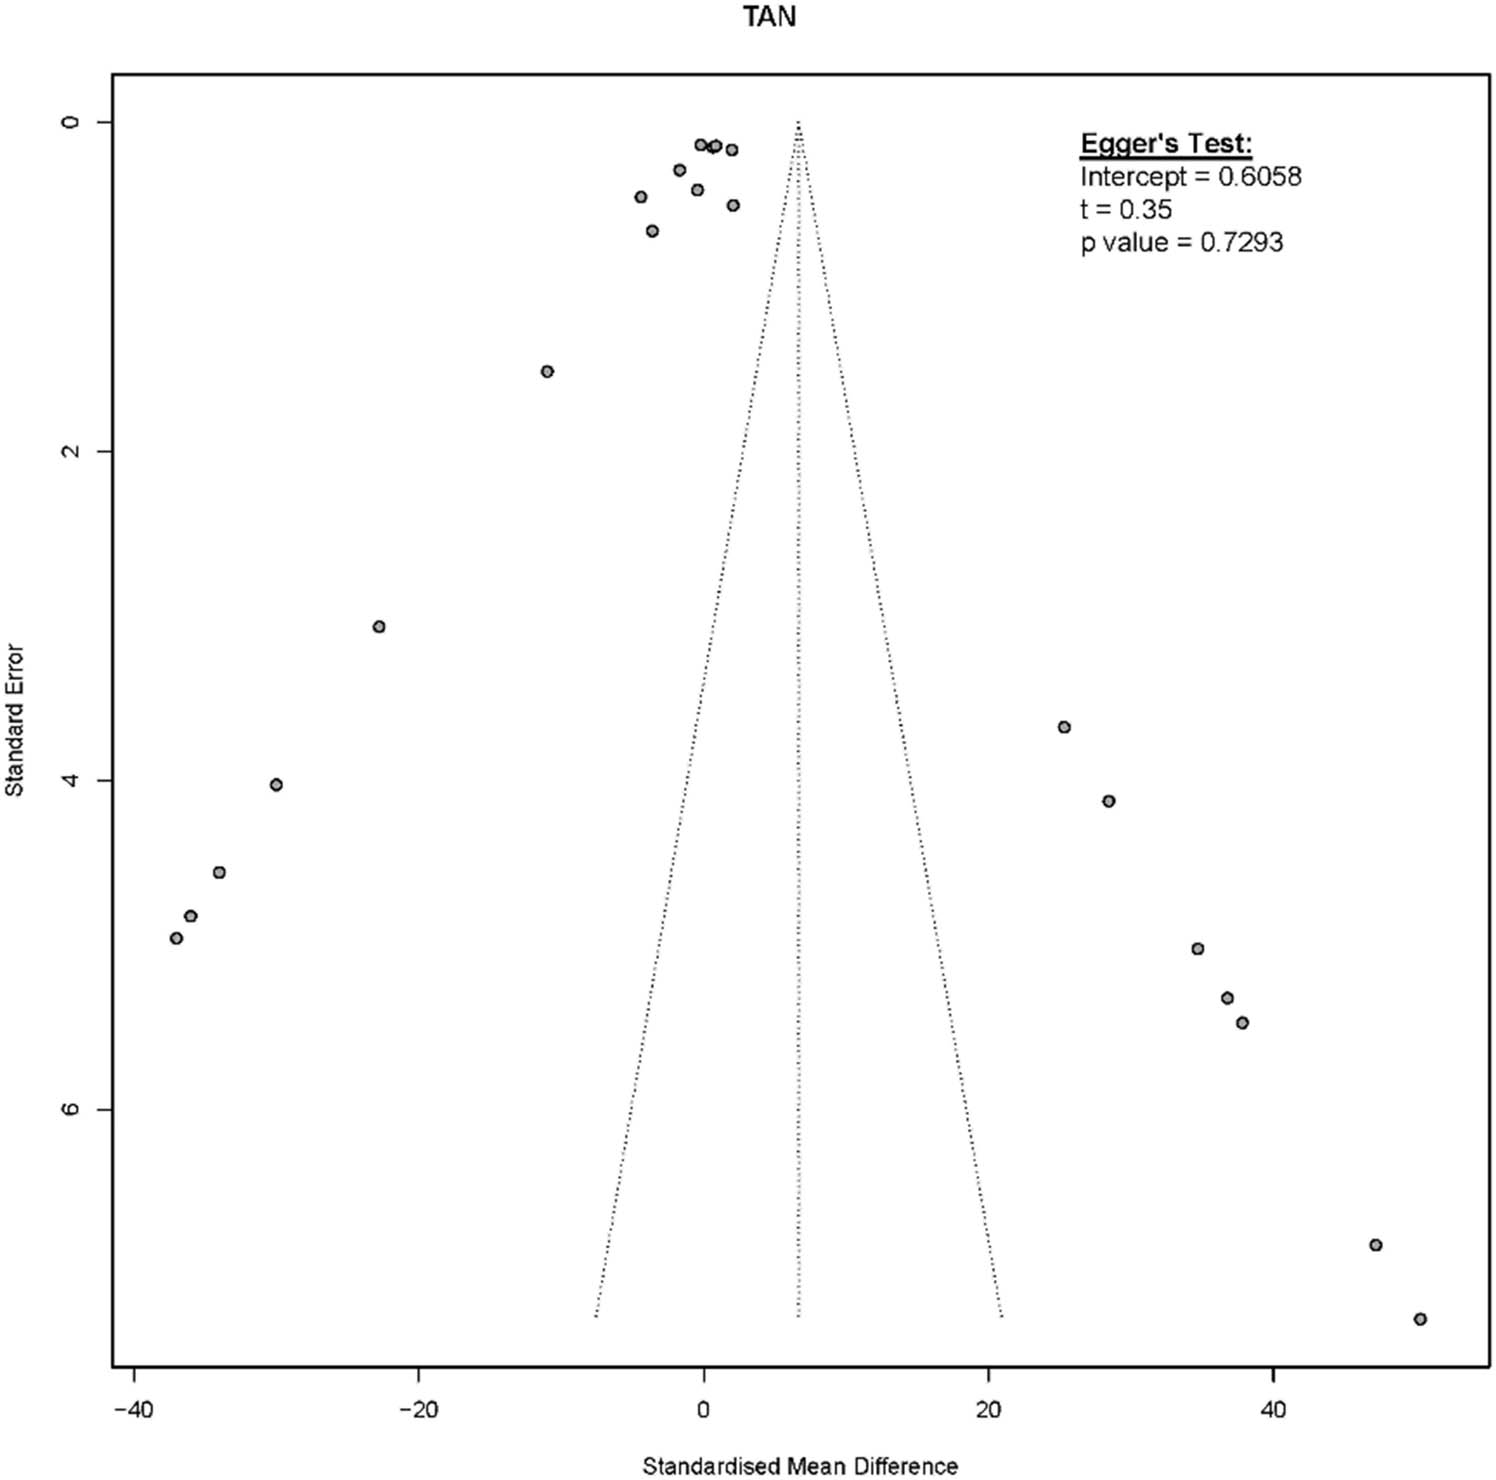
Figure 19
Funnel plot evaluating asymmetry and potential publication bias in TAN studies.
The water quality outcomes of the present meta-analysis highlight both the potential and operational challenges of BFT in tilapia culture. BFT systems increased TAN concentrations and nitrite levels suggesting that nitrogen assimilation is highly sensitive to system maturity and management consistency (Alkhamis et al., 2023). DO concentrations were consistently lower in BFT treatments, reflecting the high oxygen demand associated with heterotrophic microbial activity (Khanjani et al., 2024; Emerenciano et al., 2017). These findings reinforce that, while BFT improves nutrient recycling, it imposes a higher dependency on stable aeration infrastructure and technical oversight.
In Africa, unreliable energy infrastructure and the high aeration demands of BFT, often exceeding 40% of total energy use, pose a major barrier to its adoption (Ogello et al., 2021; Li et al., 2025). While TAN control remains a theoretical advantage of BFT through microbial assimilation, the present meta-analysis indicates that TAN increased significantly in BFT systems across studies, and nitrite accumulation in some cases further reflects poor floc stability during the initial 4–6 weeks, a period critical for system maturation (Xu et al., 2025). The success of BFT in tilapia farming thus depends on consistent C:N ratio balancing, alkalinity management, and technical competence (Avnimelech, 2015; Crab et al., 2012). Furthermore, the meta-analysis confirms that BFT is not a “one-size-fits-all” solution, but a biological ecosystem whose success depends on microbial succession, energy stability, and farmer competence. Thus, examination of varying C:N ratios is warranted to clarify how carbon input levels affect tilapia performance.
3.3. Subgroup analysis on C:N ratio
3.3.1. SGR
Subgroup analysis revealed that SGR was significantly improved across all C:N ratio categories when compared to controls (Figure 20). The high C:N ratio group exhibited the greatest improvement (SMD = 8.73; 95% CI: 4.84–12.62), followed by the medium group (SMD = 5.24; 95% CI: 1.72–8.75). The low C:N ratio group recorded the highest effect size (SMD = 20.50), but this result was associated with wide CIs (95% CI: 2.93–38.08), reflecting variability and limited study representation in this category. Although differences in magnitude were observed, the test for subgroup differences was not statistically significant (χ 2 = 3.99, df = 2, P = 0.136), suggesting that while BFT consistently improves growth across all C:N ratio levels, the degree of improvement may be context specific. These findings reaffirm that carbon supplementation enhances microbial protein availability, supporting improved growth in tilapia (Avnimelech & Kochba, 2009; Emerenciano et al., 2017).
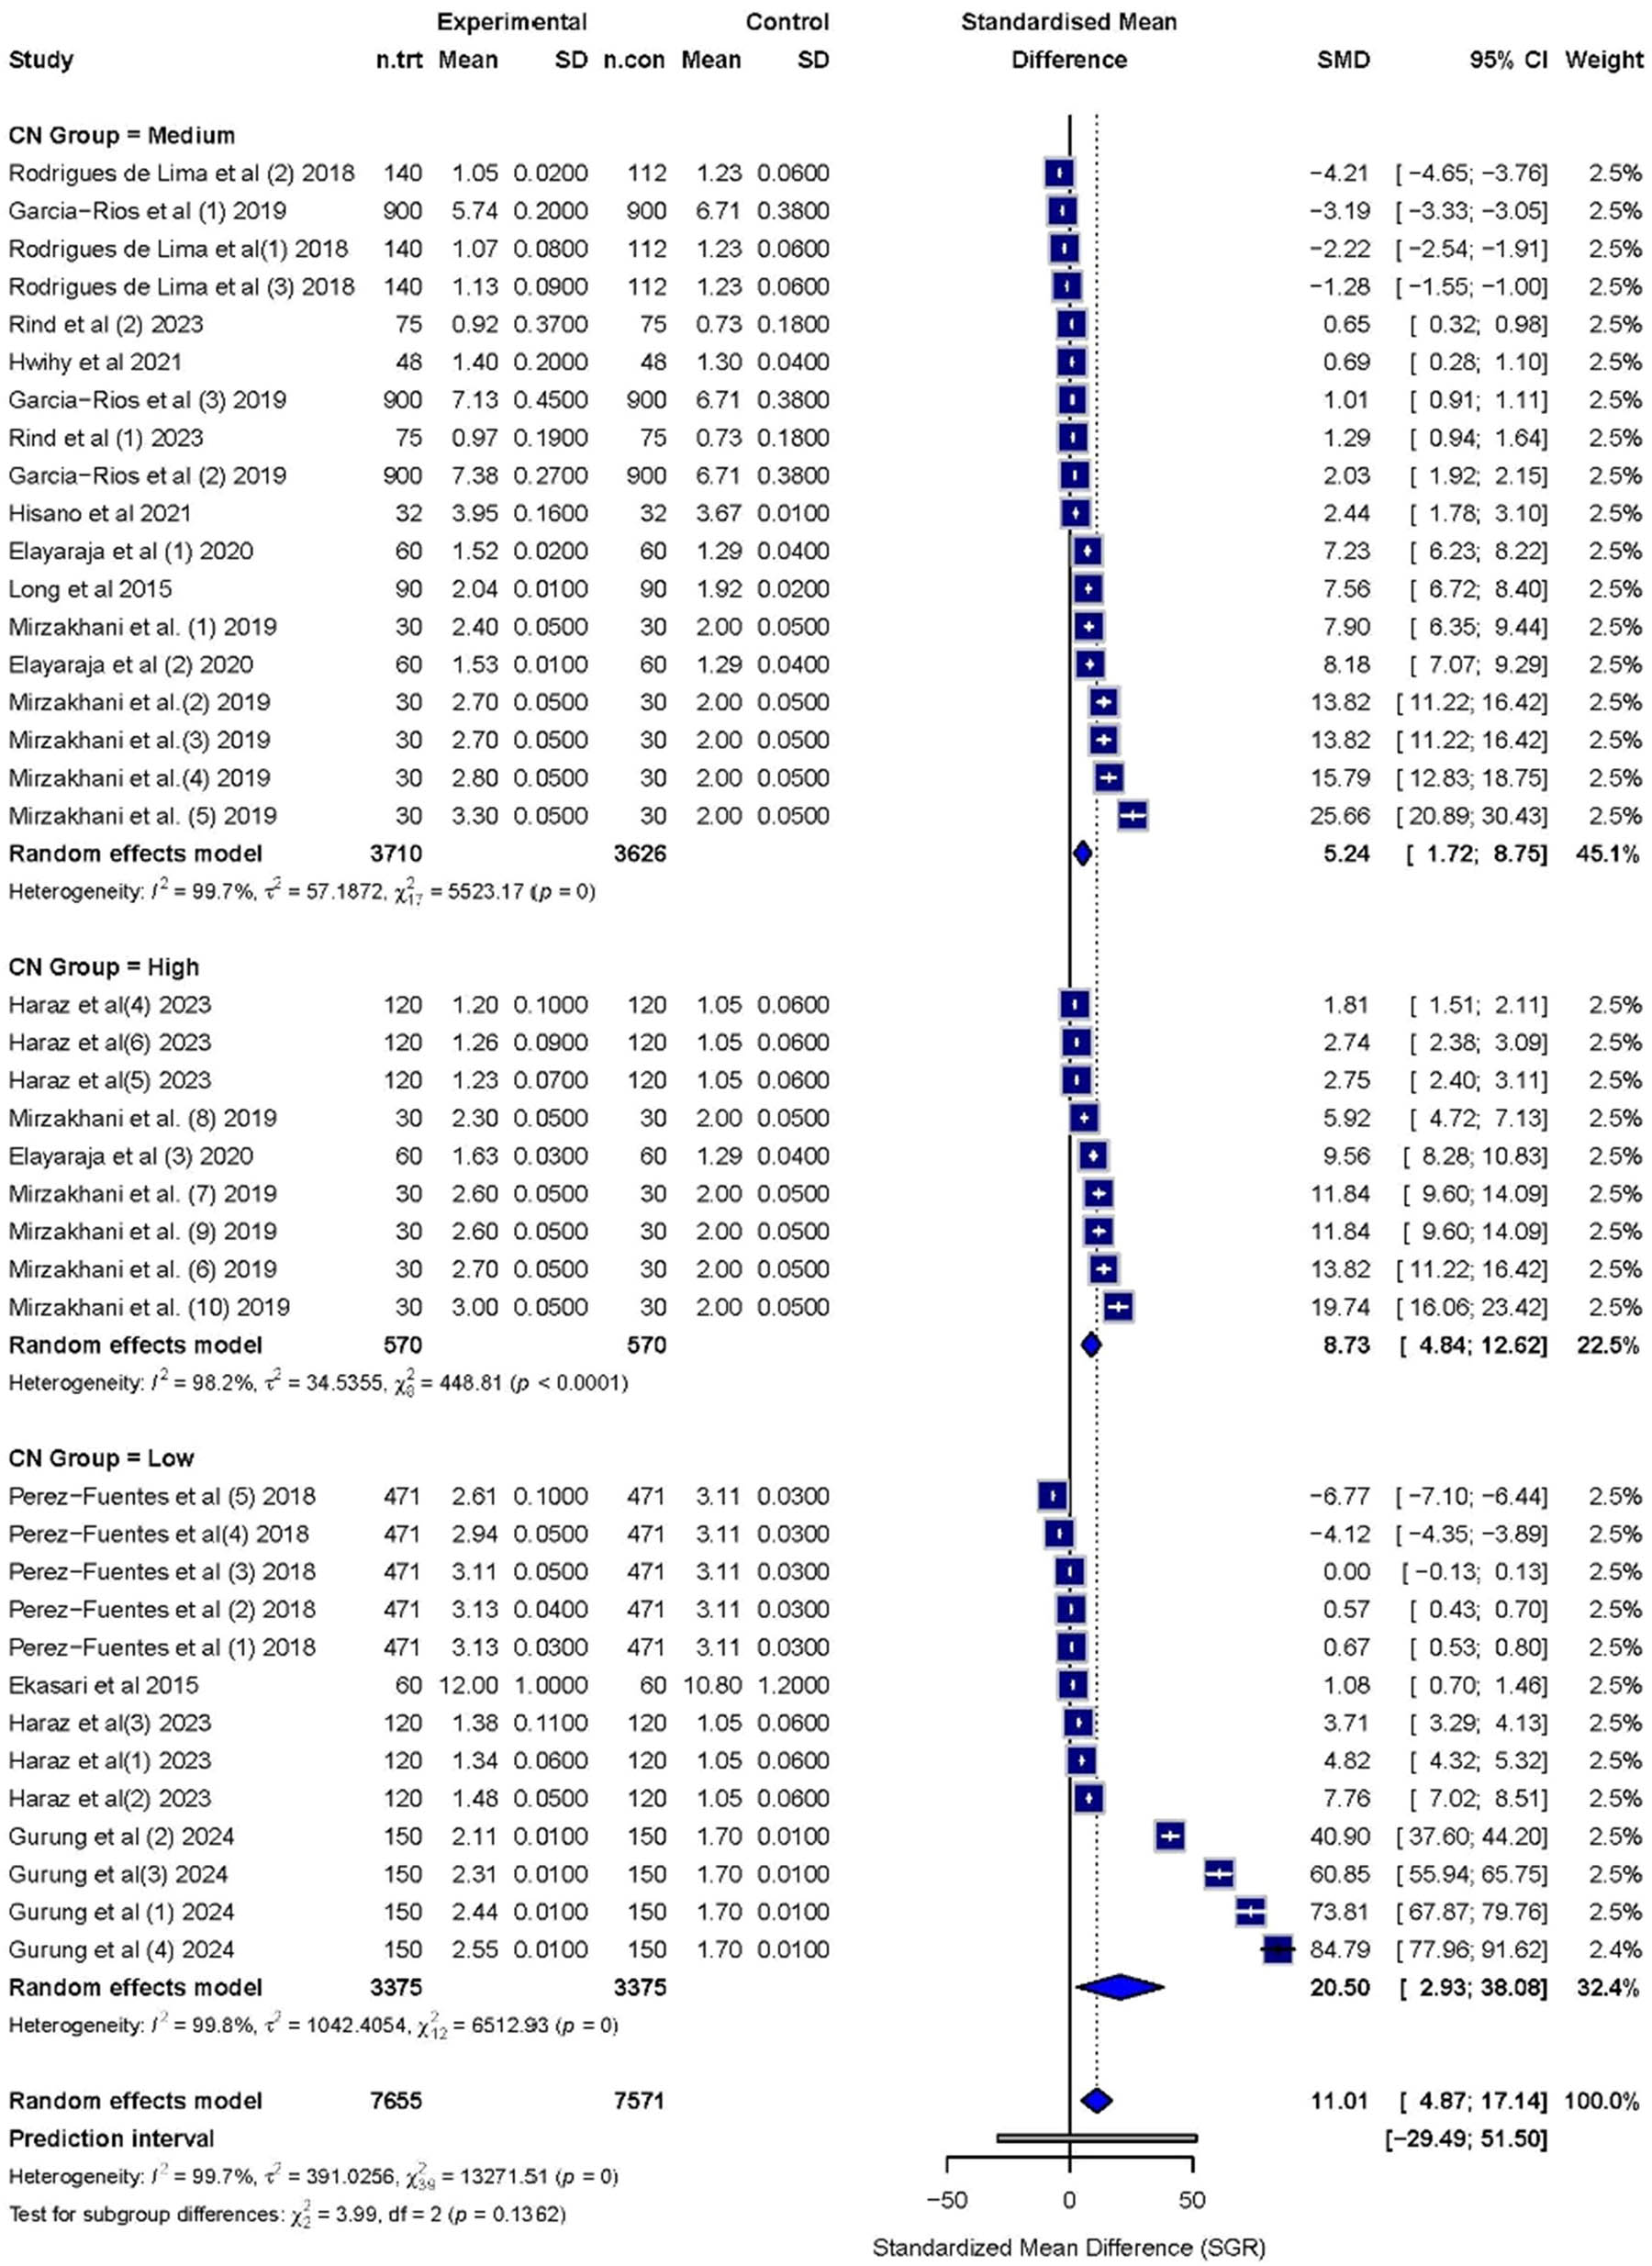
Figure 20
Forest plot of SGR by C:N ratio subgroup.
3.3.2. FCR
FCR outcomes demonstrated a strong dependence on C:N ratio (Figure 21). All groups reported significant improvements over the control, with the most pronounced reduction in the high C:N ratio group (SMD = –18.25; 95% CI: –27.08 to –9.41). This was followed by the medium group (SMD = –9.02; 95% CI: –15.24 to –2.79), and the low group (SMD = –6.56; 95% CI: –9.27 to –3.86). The test for subgroup differences was statistically significant (χ 2 = 6.25, df = 2, P = 0.044), confirming that increased carbon availability enhances the efficiency of microbial assimilation and feed utilization. This aligns with previous findings that heterotrophic microbial communities formed under high C:N ratio conditions contribute significantly to feed recycling and reduced reliance on commercial feed inputs (Crab et al., 2012; Ekasari et al., 2014).
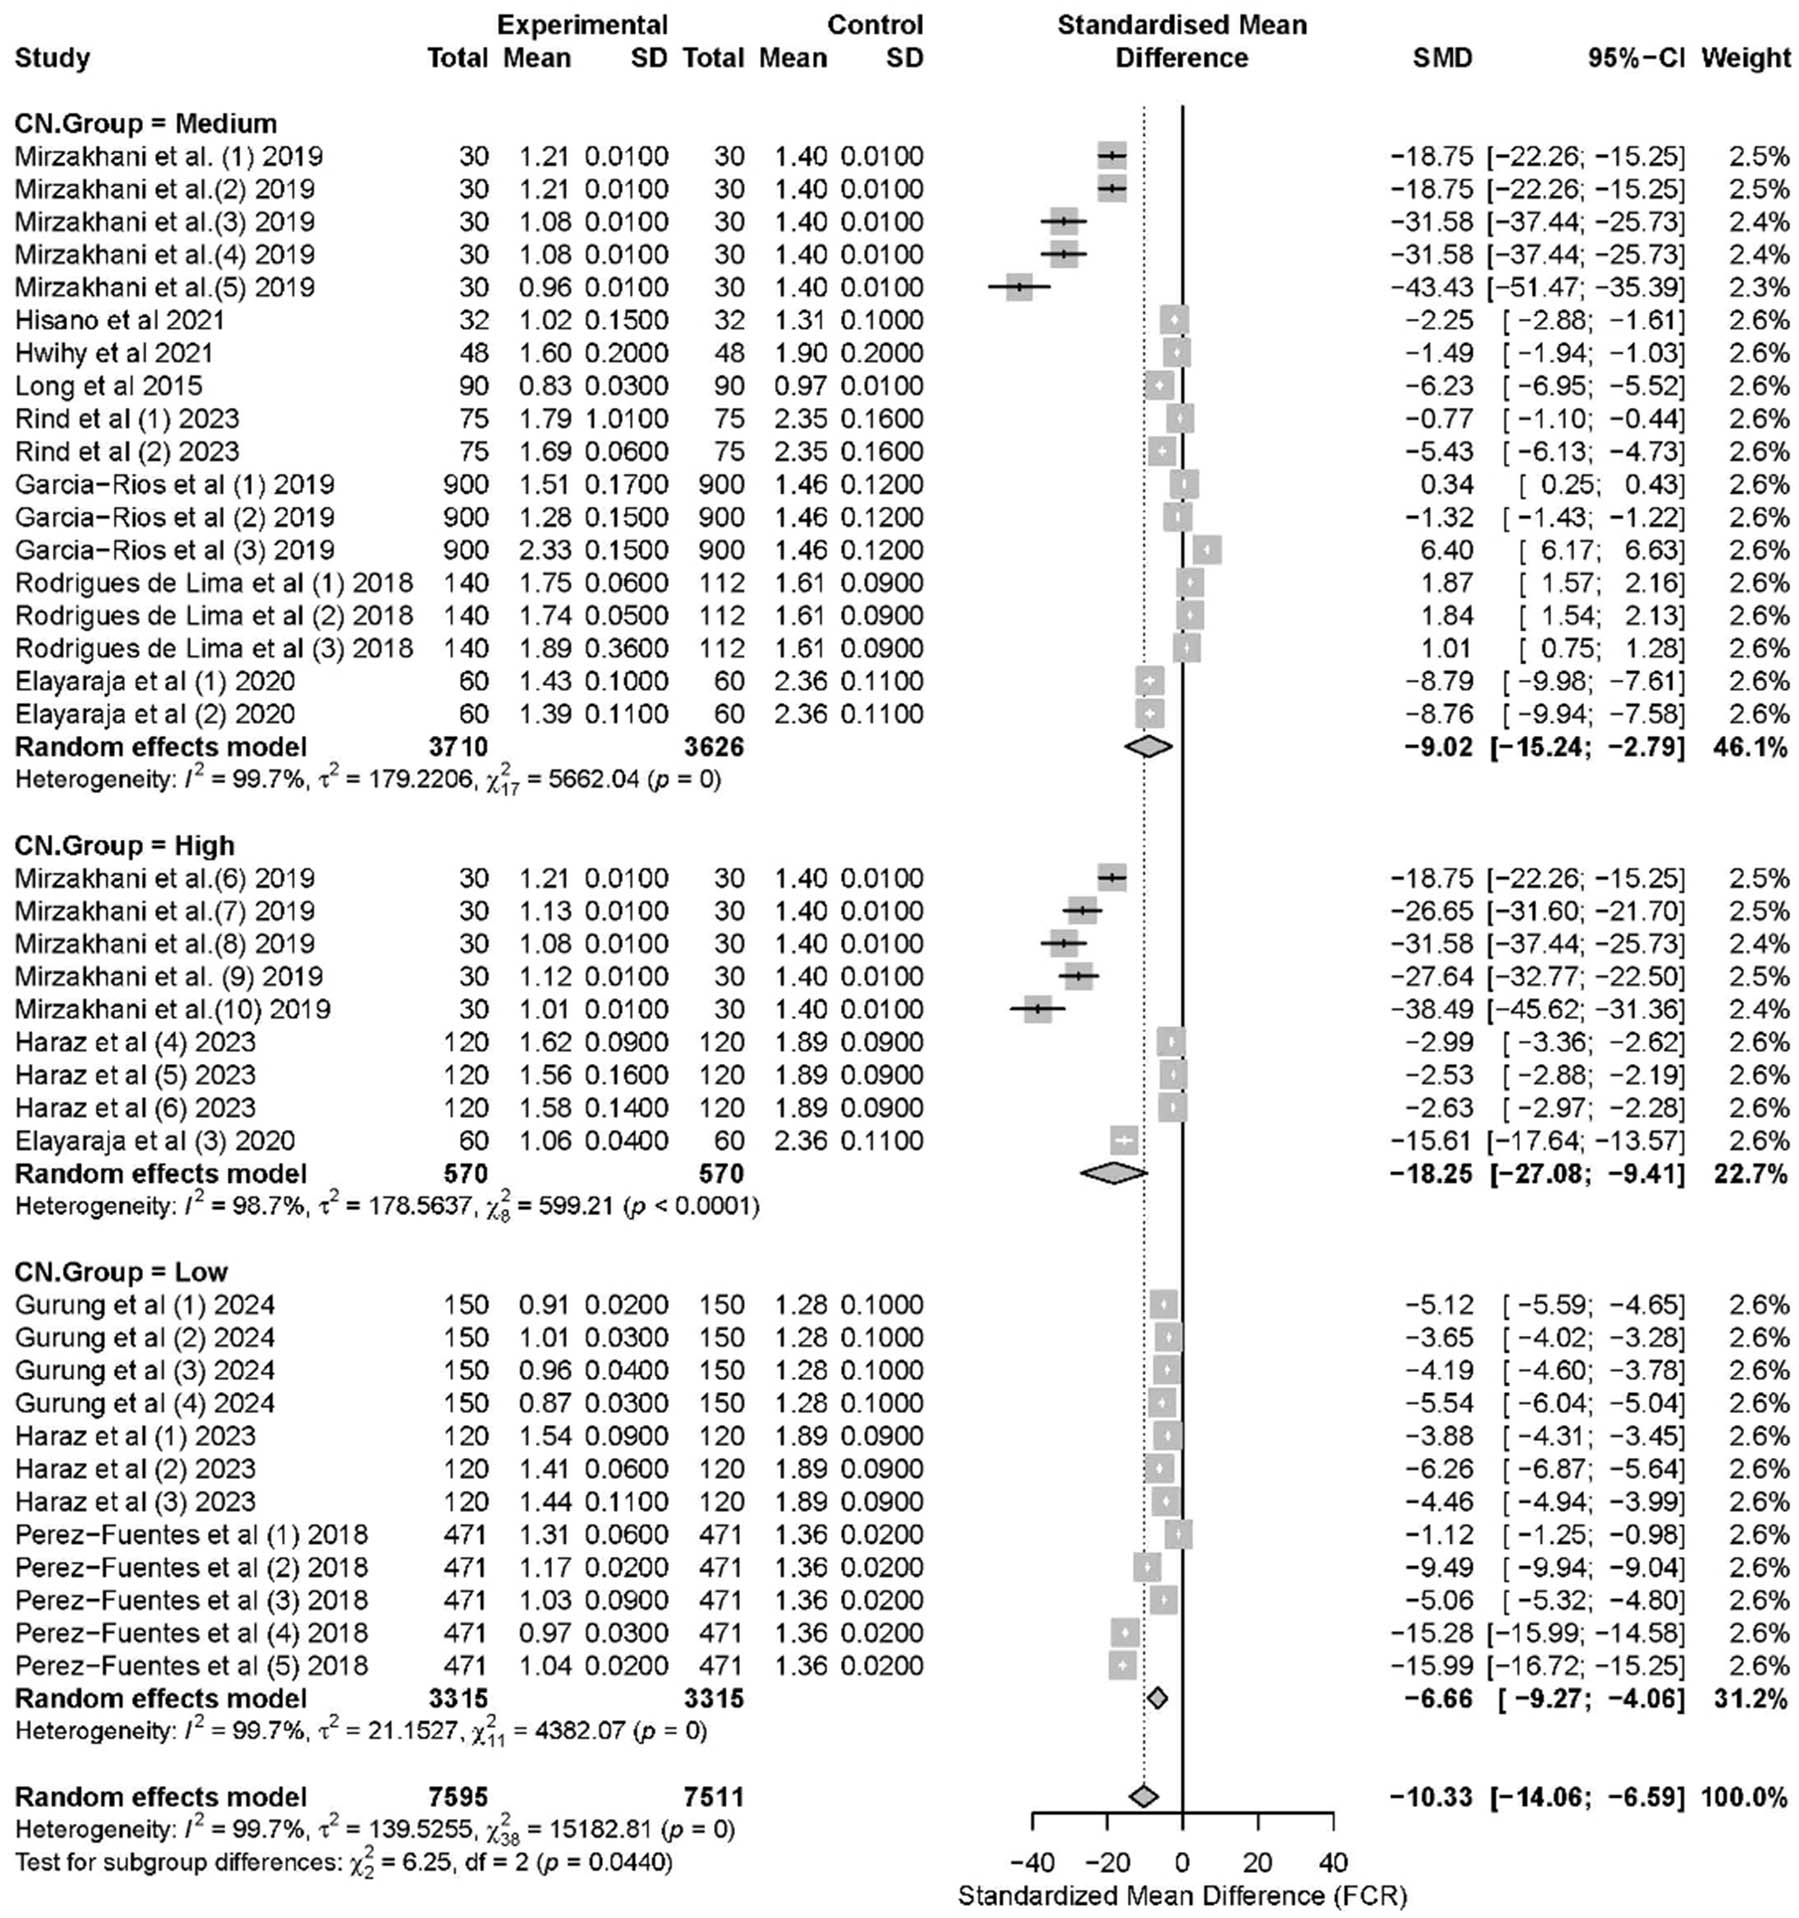
Figure 21
Forest plot of FCR by C:N ratio subgroup.
3.3.3. Nitrite (NO2 –)
Nitrite concentrations were strongly influenced by C:N ratio (Figure 22). The high C:N ratio group recorded a substantial increase in nitrite levels (SMD = 21.72; 95% CI: 6.57–36.88), indicating potential suppression of NOB due to oxygen competition in heavily carbon-loaded systems. In contrast, the medium group showed a moderate elevation (SMD = 3.82; 95% CI: –1.24 to 8.80), while the low group exhibited a slight decrease in nitrite (SMD = –1.93; 95% CI: –4.29 to 0.44). These findings reflect challenges in maintaining microbial nitrification balance under fluctuating C:N ratio conditions. The test for subgroup differences was significant (χ 2 = 12.45, df = 2, P = 0.002), emphasizing the need for aeration management and microbial stability when operating BFT systems under high carbon input regimes. Nitrite accumulation under high C:N ratio conditions has been widely reported and may lead to sublethal stress in tilapia if not properly mitigated (Ekasari et al., 2014; El-Hawarry et al., 2021).
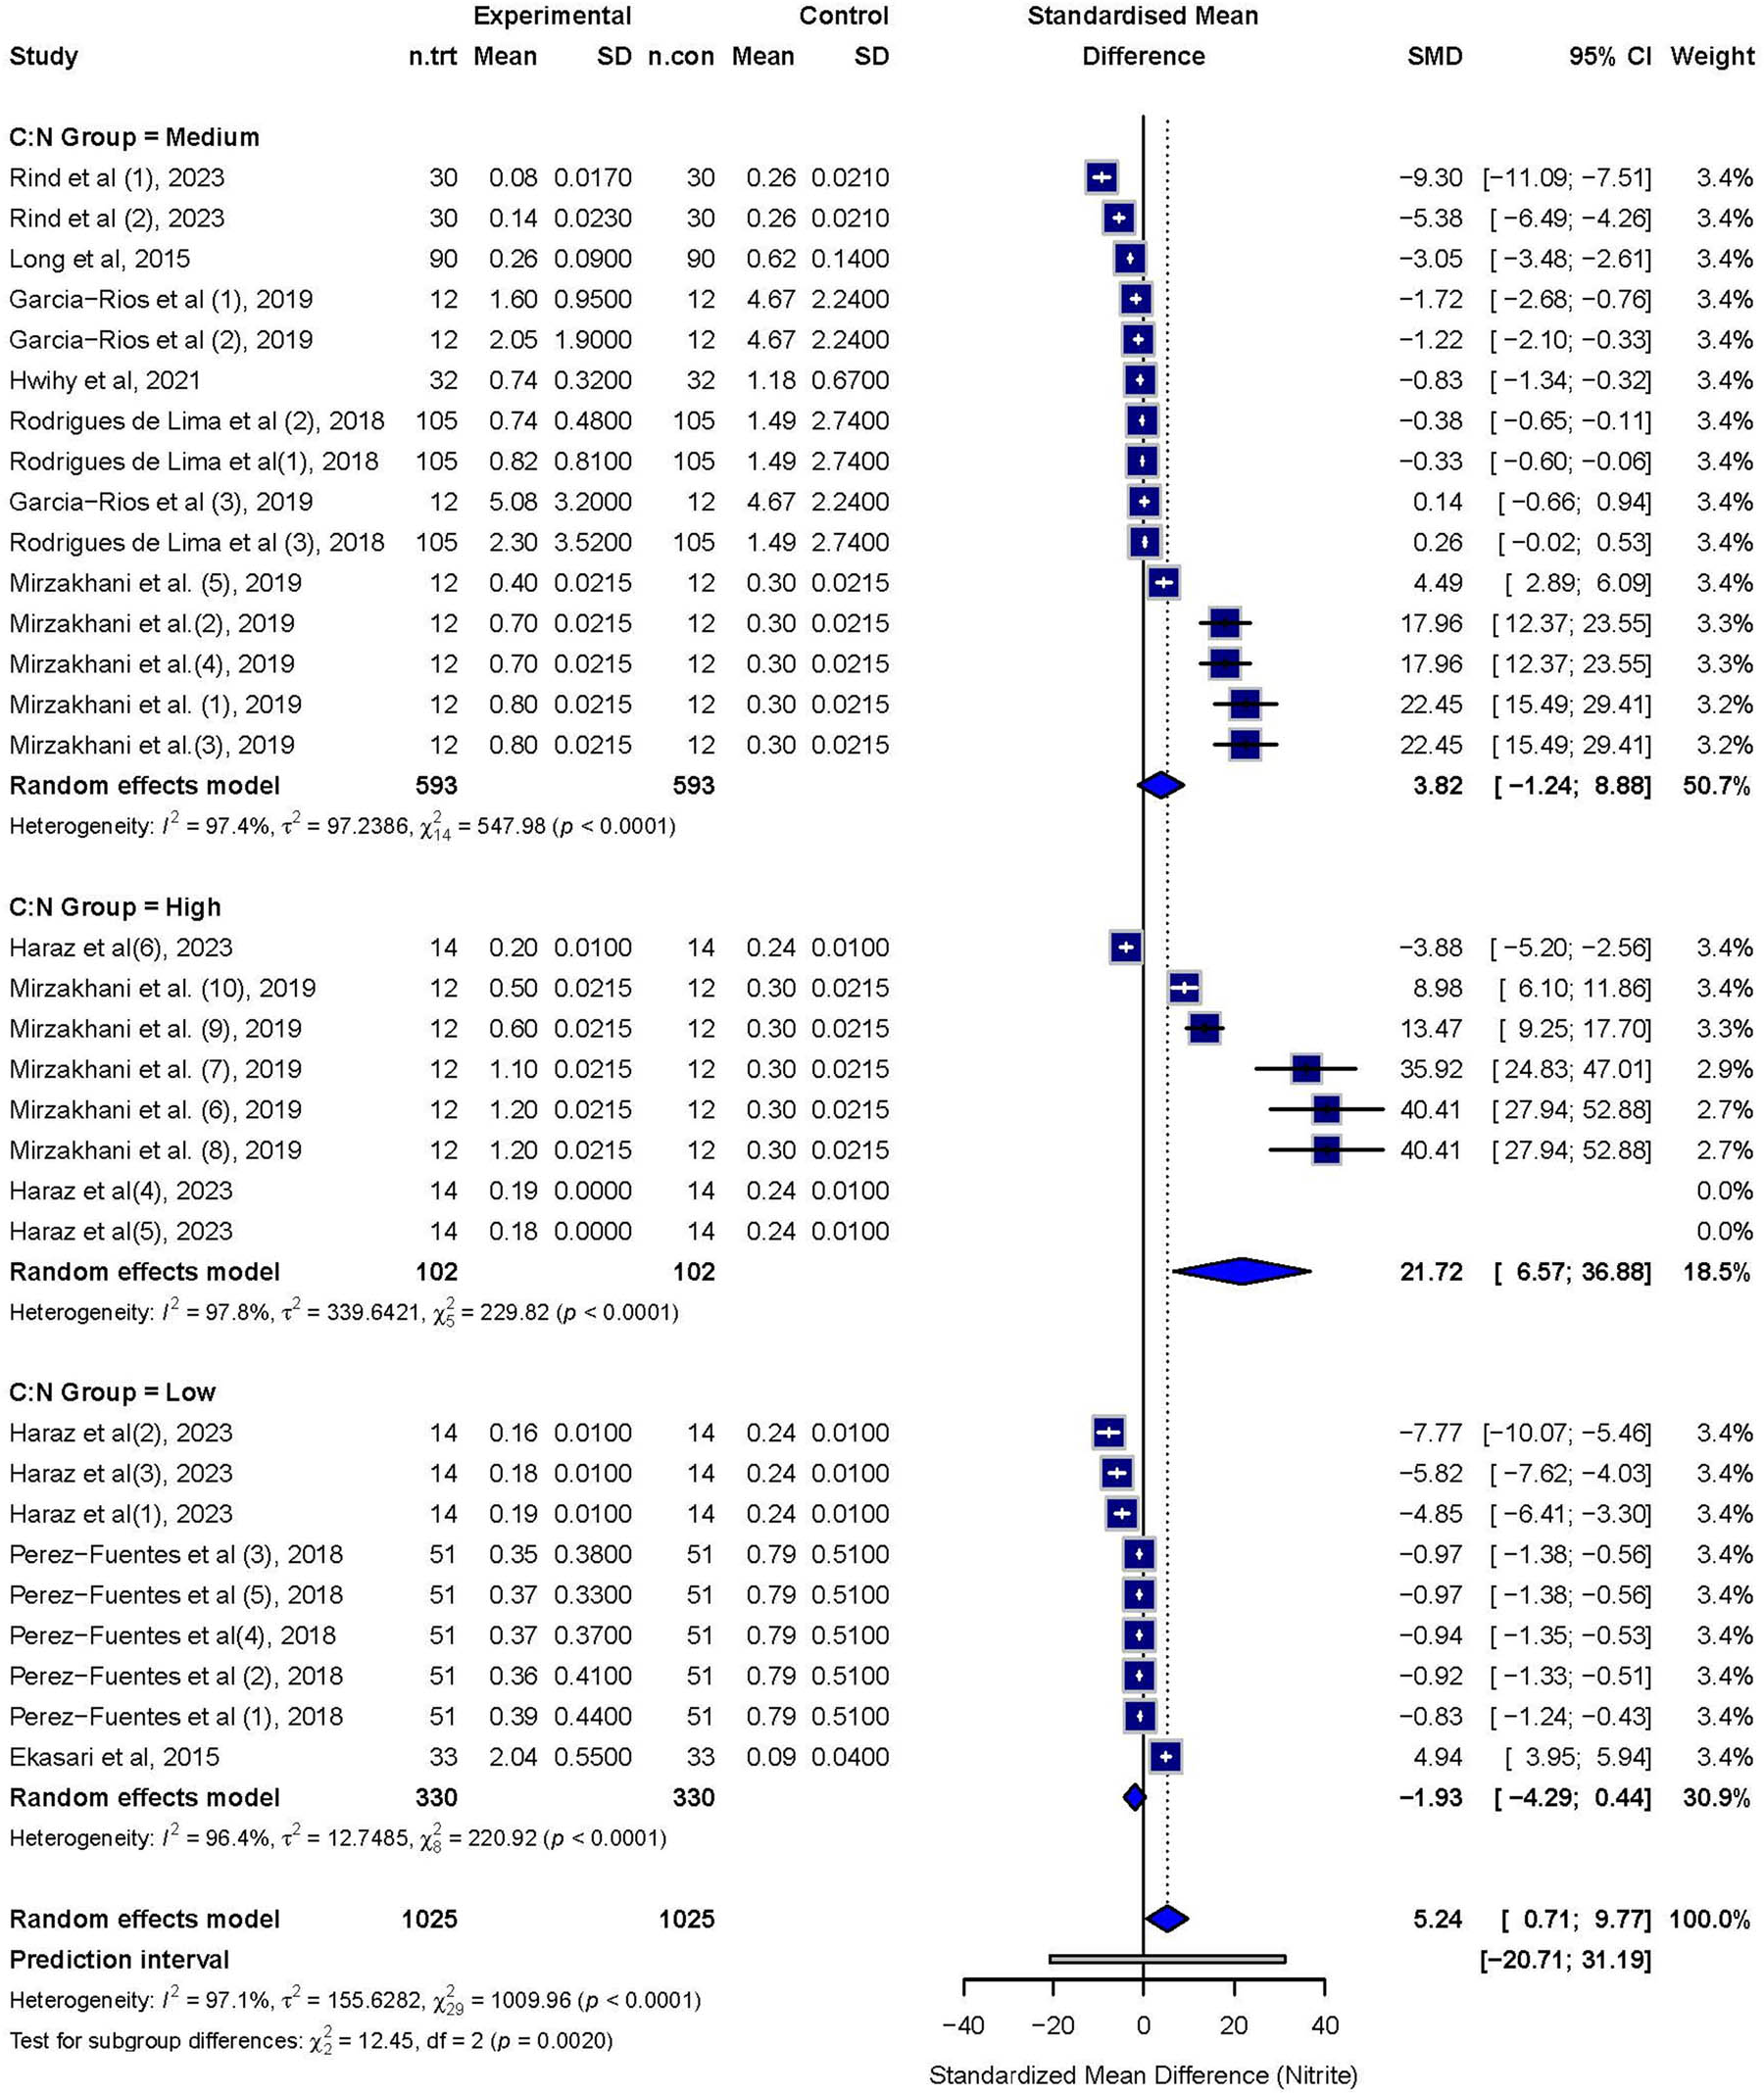
Figure 22
Forest plot of nitrite (NO2 –) concentration by C:N ratio subgroup.
3.3.4. TAN
TAN concentrations displayed a bimodal pattern across subgroups (Figure 23). The low C:N ratio group exhibited the greatest reduction in TAN (SMD = –23.24; 95% CI: –37.60 to –8.89). However, the high group experienced a significant increase in TAN (SMD = 13.04; 95% CI: –10.03 to 36.11) followed by the medium group (SMD = 11.17; 95% CI: 2.71–19.63). These trends suggest that both heterotrophic assimilation and autotrophic nitrification (under low C:N) can effectively regulate TAN levels, whereas high-range ratios may result in transitional microbial states with less efficient nitrogen processing. The test for subgroup differences was highly significant (χ 2 = 17.14, df = 2, P = 0.0002), reinforcing that effective TAN management in BFT requires C:N ratio alignment with system objectives and microbial composition. These findings are consistent with previous observations that stable nitrogen cycling is achieved through either strong heterotrophic dominance or complete autotrophic pathways, both of which are sensitive to carbon input consistency and system maturity (Kumar et al., 2024; Crab et al., 2012).
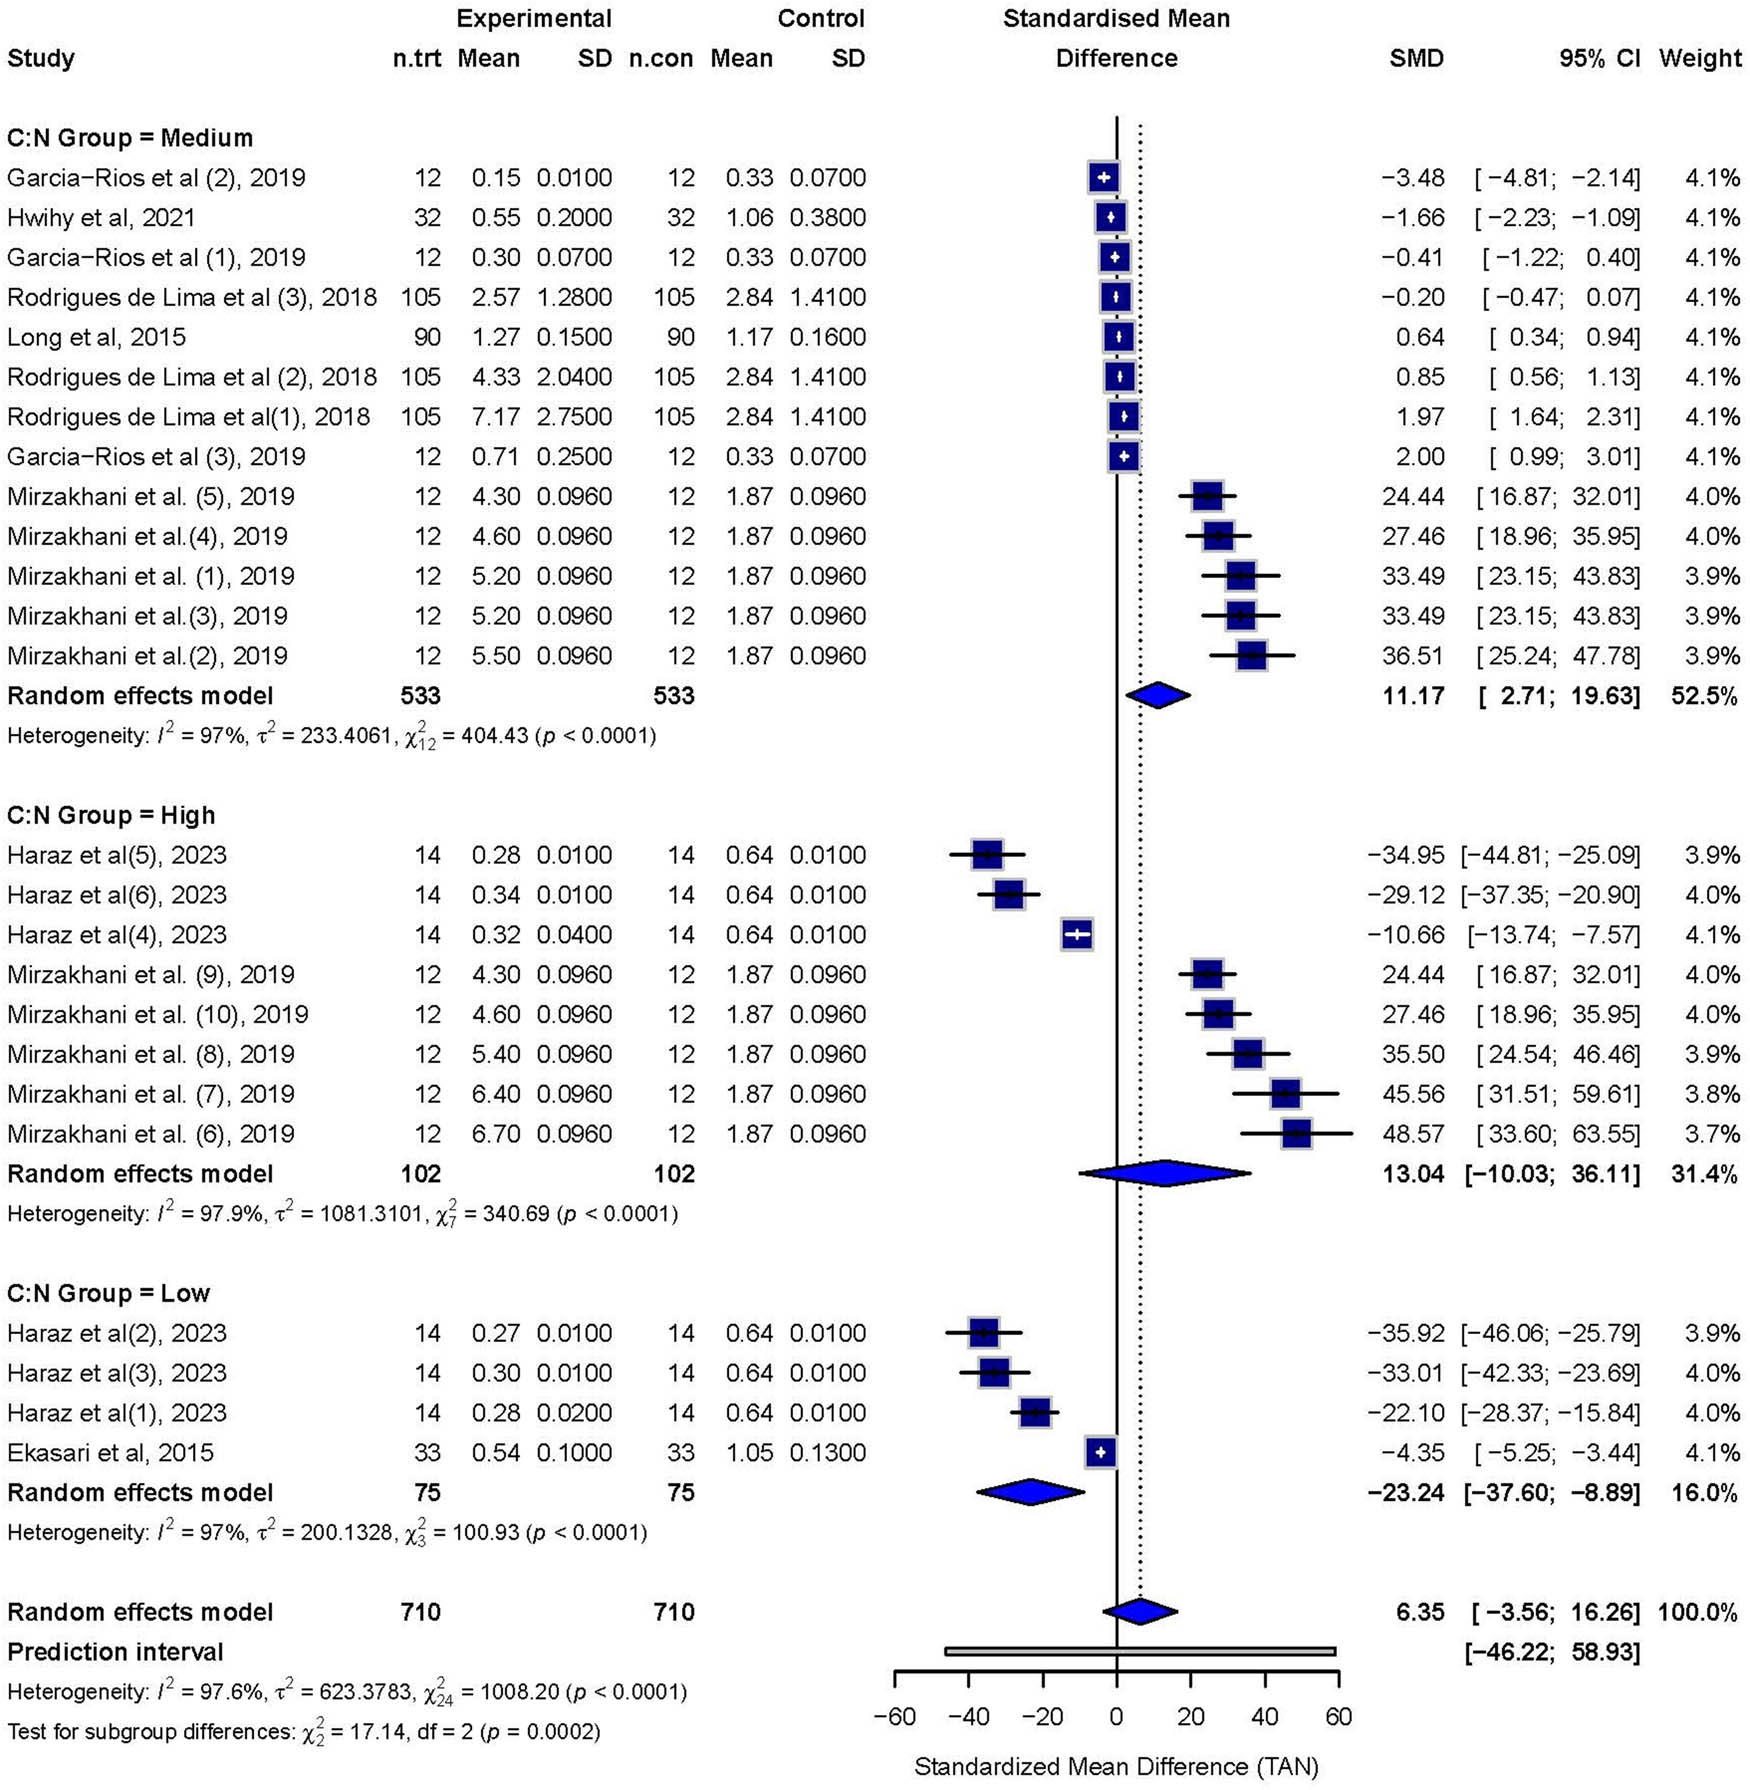
Figure 23
Forest plot of TAN by C:N ratio subgroup.
The results of the subgroup analysis affirm that C:N ratio is a critical determinant of performance in BFT systems. While higher C:N ratios were associated with improved FCR and SGR, they also resulted in elevated nitrite and TAN levels, likely due to oxygen limitation and delayed nitrification. Conversely, lower C:N ratios provided better TAN and nitrite control but yielded lower growth and high feed efficiency outcomes. These findings suggest that BFT performance can be optimized through context-specific C:N ratio variation, balancing microbial protein production with stable water quality. Therefore, an effective BFT system design should consider the following:
Continuous aeration scaled to microbial load and carbon input,
Real-time monitoring of nitrite, TAN, DO, and pH, and
Strategic adjustment of C:N ratio to match growth phase, stocking density, and feeding rate.
Overall, these results reinforce that C:N ratio is not only a key operational parameter but also a powerful lever for customizing BFT systems to diverse farming conditions, particularly in regions with variable infrastructure and environmental constraints.
4. Limitations of the study
The SDs in all the studies were very small, and this led to large SMDs. The problem was further compounded by the small sample size that we worked with. The selection criteria used to identify the different studies were quite rigorous and it follows the criteria that are normally used to identify meta-analysis studies. Thus, it was not possible to increase the sample size through adjustment of the selection criteria.
One of the advantages of BFT is the enhanced fish immunity. Many studies have shown that biofloc has many bioactive compounds. It was not possible in this study to carry out meta-analysis on any of the bioactive compounds as only two studies (based on the selection criteria) looked at tilapia immunity in BFT.
5. Future prospects of BFT in tilapia culture
The future of BFT in tilapia aquaculture lies in addressing the current technical, economic, and institutional limitations while capitalizing on the system’s potential for climate resilience, nutrient recycling, and low-input intensification. Realizing this potential will require advances in research, innovation, policy, and capacity development.
One promising research direction involves the diversification and localization of carbon inputs. Commonly used carbon sources such as molasses or wheat flour are not always cost-effective or sustainably available, particularly in rural or low-income contexts. Studies have shown that the type of carbon source not only affects microbial growth but also alters the nutritional and probiotic composition of biofloc aggregates (Crab et al., 2012; Dauda et al., 2018). Exploring alternative, locally available carbon sources such as cassava peel, banana residues, brewery waste, and sugarcane bagasse could reduce input costs and improve system sustainability. Moreover, blending multiple carbon sources may enhance microbial diversity and stability under fluctuating environmental conditions. However, these alternatives must be rigorously evaluated for C:N ratio balancing efficiency, bioavailability, and potential contaminants (Ogello et al., 2021).
Another critical frontier is the development of smart monitoring and automation systems. The technical complexity of BFT, particularly regarding microbial dynamics, DO control, and nutrient balance often exceeds the capacity of small and medium-scale farmers. Real-time sensor technologies for pH, DO, TAN, and turbidity, when integrated with automated aeration and carbon dosing systems, could dramatically reduce the operational burden and error margin (Flores-Iwasaki et al., 2025). Recent advances in machine learning also offer the possibility of predictive analytics to forecast system instability, allowing for pre-emptive interventions and reducing the likelihood of catastrophic system failure (Zuhaer et al., 2026).
In parallel, strategic investment in human capital and knowledge dissemination is essential. The unique biological and operational characteristics of BFT require specialized training not typically included in conventional aquaculture extension curricula. Incorporating BFT modules into university and vocational training programs, along with field-based demonstration projects, can bridge this knowledge gap. Strengthening public-private partnerships and enhancing extension services would also support widespread adoption, particularly in smallholder-dominated regions (Food and Agriculture Organization of the United Nations, 2016; Ogello et al., 2021).
Policy support will also be instrumental in scaling BFT. Governments can play a catalytic role by subsidizing energy-efficient equipment (e.g. solar-powered aerators), supporting local carbon source production, and facilitating access to credit or insurance products tailored to biofloc systems. Additionally, the establishment of quality standards and certification schemes for biofloc-grown fish could enhance consumer trust and market access (Serafini et al., 2025).
Finally, future research should move beyond traditional performance metrics to encompass environmental and economic evaluations. Life cycle assessments are necessary to quantify water use efficiency, nitrogen retention, and carbon emissions in BFT compared to conventional systems. Economic modelling across production scales could help identify where BFT offers the best return on investment, including under scenarios of climate variability or resource constraints. Furthermore, the potential for BFT integration with other systems such as recirculating aquaculture systems or integrated multi-trophic aquaculture offers promising avenues for maximizing resource use efficiency and system resilience.
Given its closed-loop design and low water requirement, BFT holds significant promise as a climate-smart aquaculture strategy. As water scarcity and temperature variability intensify under climate change, adaptable and energy-efficient models such as solar-integrated BFT systems may represent a viable path forward for resilient tilapia farming.
6. Conclusion
The meta-analysis showed that water quality parameters did not improve in the BFT systems. However, there was improvement in water quality parameters in the sub meta-analysis at low C:N ratio. The main determinant factor of water quality in BFT is the C:N ratio. It is suggested that the C:N ratio be closely monitored to avoid deterioration in water quality in a BFT system. The growth performance of tilapias improved in the BFT system, and this is attributed to the feeding tilapias’ ability to feed on the biofloc. The BFT is a promising technology that is gaining traction in the culturing of tilapias. However, there is need to carry out more research on its operational efficiency and economic viability.
Funding information
Authors state no funding involved.
Author contributions
Conceptualization and methodology, M.M.R-M. and N.A.G.M.; Investigation, Data curation, Analysis, Software Visualization, M.M.R-M.; Validation, N.A.G.M.; Writing – original draft, M.M.R-M.; Writing – review & editing, M.M.R-M. and N.A.G.M. All authors have read and approved the final version of the manuscript.
Conflict of interest statement
Authors state no conflict of interest.