
Fructans are nonstructural carbohydrates that differ in molecular structure and molecular weight and are naturally produced by plants and some microorganisms (Zhao et al., 2013). In plants, fructans are carbohydrate-storing polymers that can increase resistance to cold and drought and are found in large amounts in roots and bulbs (Vijn and Smeekens, 1999; Versluys et al., 2018). In the case of microorganisms, fructans protect their cells from drying, help form biofilms and can be used as a carbon source (Versluys et al., 2018). These compounds can be divided into 3 main groups: inulin-type fructans, levan-type fructans and branched-chain fructans. Inulin-type fructans mainly contain a β-2,1 fructosyl-fructose bond, levan-type fructans mainly contain a β-2,6 fructosyl-fructose bond, and branched-chain fructans contain significant amounts of both β-2,1 and β-2,6 fructosyl-fructose bonds. Despite the many interesting properties of fructans, the most important from the nutritional point of view seems to be the fact that they are not hydrolyzed by digestive enzymes. The product of their partial fermentation carried out by Lactobacillus and Bifidobacterium spp. in the cecum (CEC) are short-chain fatty acids (SCFA). These acids, in turn, not only provide energy for the host, but also stimulate the growth and activity of probiotic bacteria and inhibit the growth and development of pathogens (Zhao et al., 2013; Franko-Robles and López, 2015; Madej and Bednarczyk, 2016; Ma et al., 2017; You et al., 2022). Moreover, levan-type fructans have a number of other properties, such as hypocholesterolemic effects (Yamamoto et al., 1999), the ability to bind metal ions (Ohta et al., 1993), the ability to prevent constipation (Roberfroid et al., 1993), and anticancer and immunomodulatory effects (Calazans et al., 1997).
Despite these promising characteristics, there is still a scarcity of research on the use of levan as a dietary supplement in poultry. To the best of our knowledge, unlike inulin-type fructans, levan-type fructans have been used only once in poultry nutrition by Zhao et al. (2013) who studied the use of levan in broiler chickens. The combined effects of levan on production traits, egg quality, intestinal histomorphometry, immune-related organ morphology, and gut microbial ecology in broiler chickens are rarely comprehensively examined, as existing studies frequently concentrate on selected physiological parameters or growth performance outcomes (Ashfaq et al., 2020; Zhao et al., 2013). Moreover, the prospective dose-dependent responses to levan supplementation have not been completely elucidated, particularly in commercial broiler chicken genotypes under practical production conditions.
In general, the effects of different feeding strategies on the performance of laying hens can be easily determined on the basis of physical characteristics such as egg production (EP), feed intake (FI), and the feed conversion ratio (FCR). However, in the case of commercial poultry farming, the impact of nutrition on the immunological competences underlying production traits is difficult to assess. Therefore, it is necessary to conduct laboratory research that will lead to a better understanding of the immunomodulatory properties of feed additives, especially in light of the need for alternatives to antibiotics.
The aim of this study was to determine the effects of levan on the performance of birds and egg quality, the microbiological composition of the digestive tract, intestinal histomorphometry, and immune responses.
Material and methods
Ethical approval
The nutritional experiment involving laying hens was approved by the Local Ethical Committee for Animal Experiments in Wrocław (No 031/2022/P3, 16 November 2022).
Animals, diets and housing
The research was carried out at the Research and Education Station in Swojczyce, Poland (Wrocław University of Environmental and Life Sciences). A total of 120 laying hens of the Lohmann Brown line (26 wk of life) were used in the experiment. The hens were kept in a cage system under controlled microclimate conditions, which were in accordance with the line breeder recommendations (Lohmann, 2020). The birds were randomly divided into 5 experimental groups, each group consisted of 8 replications (cages), and each replication consisted of 3 hens (24 birds per group). The control group (group C) received the basal diet with no levan supplementation. The experimental groups received a basal diet supplemented with 0.1% (L0.1), 0.25% (L0.25), 0.5% (L0.5) or 1% (L1) levan (Simagchem Corporation®, Xiamen, China). The molecular weight of the levan was 504.43 Da. The hens were fed 130 g/hen/d. Access to water was unlimited. The experiment lasted 90 days. Table 1 shows the nutritional value of the levan additive, and Table 2 presents the composition and nutritional value of the basal diet. The chemical composition of the levan and the basal diet was determined according to AOAC (2005), and included dry matter (DM): AOAC, 930.15; crude ash: AOAC, 942.05; nitrogen: AOAC, 984.13; crude protein as 6.25 N; crude fat: AOAC, 920.39; crude fiber: AOAC, 978.10; and sugars: AOAC, 974.06. P and Ca contents were measured via an inductively coupled plasma emission spectrometer with an ultrasonic nebulizer (Varian VISTA-MPX ICP-OES, Victoria, Australia). All analyses were repeated 6 times.
Table 1.
Nutritional value of levan
| Nutrient | Analyzed value |
|---|---|
| Dry matter (%) | 96.81 |
| Crude ash (% DM) | 0.038 |
| Crude protein (% DM) | bd. |
| Crude fiber (% DM) | bd. |
| Crude fat (% DM) | bd. |
| Nitrogen-free extract (% DM) | 96.77 |
| Sugars (% DM) | 9.874 |
Table 2.
Composition and nutritional value of the basal diet
| Diet composition (%) | |
| Wheat 10.5% CP | 31.65 |
| Maize 7% CP | 30.00 |
| Soybean meal 46% CP | 15.31 |
| Sunflower meal 34% CP | 9.440 |
| Limestone | 7.720 |
| Premix | 4.000 |
| Soybean oil | 1.880 |
| Nutritional value | |
| Dry matter (%) – analyzed | 88.59 |
| Crude ash (% DM) – analyzed | 12.70 |
| Crude fat (% DM) – analyzed | 3.725 |
| Crude protein (% DM) – analyzed | 16.30 |
| Crude fiber (% DM) – analyzed | 4.012 |
| Metabolizable energy (kcal/kg DM) – calculated | 2640 |
| Total Ca (% DM) – analyzed | 3.802 |
| Total P (% DM) – analyzed | 0.564 |
* Premix composition: Ca – 213.5 g/kg; P – 45 g/kg; Na – 40 g/kg; Lys – 46 g/kg; Met – 67 g/kg; Thr – 20 g/kg; Trp – 0.700 g/kg; Arg – 3,200 g/kg; Ile – 1,600 g/kg; Val – 2,300 g/kg; vitamin A – 250,000 IU/kg; vitamin D3 – 250,000 IU/kg; vitamin E – 750 IU/kg; vitamin K – 75 mg/kg; vitamin B1 – 50 mg/kg; vitamin B2 – 100 mg/kg; vitamin B3 – 750 mg/kg; vitamin B5 – 250 mg/kg; vitamin B6 – 100 mg/kg; vitamin B7 – 1250 μg/kg; vitamin B12 – 625 μg/kg; choline – 10,000 mg/kg; folic acid – 25 mg/kg; Fe – 625 mg/kg; Mn – 2,500 mg/kg; Zn – 1,500 mg/kg; Cu – 375 mg/kg; I – 25 mg/kg; Se – 7.5 mg/kg; phytase – 18,725 FTU/kg.
Performance
The performance of laying hens, such as EP, egg weight (EW), daily egg mass (DEM), FI and FCR, was determined after the 30th, 60th and 90th days of the experiment. EP was defined as the number of eggs laid by birds in a given period and is presented as a percentage of laying. To determine the EW and DEM, the eggs were collected and weighed daily. To determine FI, the leftovers were also weighed daily. The FCR was determined by dividing the FI by the DEM.
Egg quality
Eggs for qualitative analyses were collected after the 30th, 60th, and 90th days of the experiment. Three eggs were collected randomly from each replicate (24 eggs per group). An Egg Force Reader from ORKA Food Technology (West Bountiful, UT, USA) was used to determine the breaking strength of the eggshell. Eggshell thickness was determined via a digital micrometer (SAWERON, Bydgoszcz, Poland). The shell thickness was expressed as the average of 3 measurements (sharp end, blunt end, and equator). Egg freshness based on Haugh units (HU) was determined via Egg Analyzer by ORKA Food Technology (West Bountiful, UT, USA). The color of the yolk was determined by the La Roche scale. Eggs intended for qualitative analyses were not stored but were analyzed 24 h after collection.
Microbiological analyses
On the 90th day of the experiment, 8 hens were randomly selected from each group and then euthanized. Euthanasia was carried out in accordance with Directive 2010/63/EU (European Union, 2010). Analyses of the number of bacteria of the genera Lactobacillus spp., Bifidobacterium spp., and those belonging to the Enterobacteriaceae family were performed. Samples of intestinal contents for tests were taken postmortem from the jejunum (JEJ) and the cecum (CEC). A total of 0.15 g of intestinal content was suspended in 1.35 ml of sterile PBS buffer (Merck KGaA, Darmstadt, Germany) and a series of decimal dilutions were made and inoculated into Petri dishes with MRS medium (Merck KGaA, Darmstadt, Germany) to determine the number of Lactobacillus spp., and surface inoculated on TOS-propionate agar (Merck KGaA, Darmstadt, Germany) with the addition of the MUP selective supplement (Merck KGaA, Darmstadt, Germany), on which bacteria from the Bifidobacterium spp. genus were identified. To determine the number of bacteria from the Enterobacteriaceae family, the samples were surface inoculated on VRGB medium (Merck KGaA, Darmstadt, Germany). Bacterial cultures of the genus Bifidobacterium spp. were carried out under anaerobic conditions.
Total bacterial genomic DNA was extracted from pooled intestinal contents (0.1 g per sample) collected separately from the cecum and jejunum of euthanized hens using the QIAamp Fast DNA Stool Mini Kit (QIAGEN, Hilden, Germany). The integrity of the extracted DNA was determined via electrophoresis in 0.7% agarose stained with Midori Green DNA Stain (Nippon Genetics Europe, Germany). The concentration of DNA was determined with a Biowave II UV/Vis spectrophotometer (Biochrom WPA, UK), and the purity was determined in terms of the 260/280 nm ratio. DNA was sequenced with the Illumina MiSeq next-generation sequencing platform via the MiSeq Reagent Kit v2 500-cycles (Illumina, USA) (weSEQ.IT Poland). In accordance with the quality of a single nucleotide, the raw data were filtered primarily by Trimmomatic version 0.33 (Bolger et al., 2014). Identification and removal of the primer sequence were performed via Cutadapt version 1.9.1 (Martin, 2011). PE reads obtained from previous steps were assembled via USEARCH version 10 (Magoč and Salzberg, 2011), followed by chimera removal via UCHIME version 8.1 (Edgar et al., 2011). The high-quality reads generated from the above steps were used in the following analysis. PE reads were assembled via Usearch v10 with the following parameter settings: minimum length of overlap, 10 bp; minimum similarity within the overlapping region, 90%; and maximum mismatch, 5 bp. The operational taxonomic unit (OTU) USEARCH version 10.0 (Edgar, 2013) was applied to cluster sequences with similarity greater than 97%. The conservative threshold for OTU filtration was 0.005% (Bokulich et al., 2013). The DADA2 method in QIIME2 version 2020.06 (Boylen et al., 2019) was applied to denoise sequences, generating ASVs. The conservative threshold for ASV filtration was 0.005%. Taxonomic annotation was performed via a classify-consensus blast in QIIME2, which identified the annotation with the highest consensus at N = 3 best hits, including parameters such as minimum similarity in sequence (90%), minimum coverage (90%) and minimum consensus (51%). A Venn diagram was used to illustrate shared and unique OTUs in the cecal microbiota among the dietary levan treatments. Beta-diversity was explored using NMDS based on OTU relative abundances. Due to the lack of biological replicates, the observed differences should be interpreted descriptively.
Intestinal histomorphometry
Samples of the duodenum (DUO), JEJ and ileum (IL) were collected from the birds. The surface area of the intestinal villi, the depth of the intestinal crypts, and the ratio of the length of the villi to the depth of the crypts (V/C) were determined in the collected samples. The area of the intestinal villi was calculated via the following formula: 2 π × (W/2) × L, where W is the villus width and L is the villus length. All the samples were fixed in 4% buffered formalin and then embedded in paraffin blocks. Five-micron-thick paraffin sections were cut from the blocks prepared on an HM325 rotary microtome (Epredia, Kalamazoo, MI, USA) and then stained with hematoxylin according to Mayer (Roth GmbH, Karlsruhe, Germany) and eosin (Poch S.A., Gliwice, Poland) via H&E staining. Cross-sectional analysis of the intestinal fragments was performed via a Nikon Eclipse Ni light microscope (Nikon, Melville, NY, USA) equipped with a video camera. The means were calculated from 3 measurements from each sample via NIS-Elements BR 5.41 imaging software (Nikon, Melville, NY, USA).
Immune organ sample processing
The thymus (THM) samples (n=8) were collected, fixed, processed and stained with H&E, similar to the intestines.
Spleen (SPL) and cecal tonsil (CT) samples from eight hens from each group were collected and fixed in 4% phosphate-buffered paraformaldehyde (pH 7.4) for 1 h. The samples were subsequently washed in 0.1 M phosphate buffer for 24 h and infiltrated with phosphate-buffered 30% sucrose for 5–7 days at 4°C. The tissues were then frozen in a cryomatrix (Thermo Scientific 6769006, Shandon Cryomatrix) at –30°C and sliced with a cryostat (CryoStar NX50, Epredia, Kalamazoo, MI, USA). The organ samples were cut into 10 μm serial sections, mounted on glass slides (Superfrost Ultra Plus, Thermo Scientific J3800AMNZ), air-dried overnight, and frozen at approximately –30°C.
Immunohistochemical staining and morphometric analysis
The slides were retrieved from the freezer and left for 30 min to defrost and dry. The sections were then washed in distilled water and PBS, and incubated for 20 min in Antibody Diluent with Background Reducing Component (Agilent, Santa Clara, CA, USA, S3022) solution to block any nonspecific reactions. This was followed by a one-hour incubation at room temperature with monoclonal mouse anti-chicken antibodies (SouthernBiotech, Birmingham, AL, USA) directed against the Bu-1 (clone AV20, 1:500), CD4 (clone CT-4, 1:200) and CD8α (clone CT-8, 1:200) antigens. After a few washes in PBS, the samples were incubated for 30 min with a secondary antibody via the EnVision FLEX+ system (Dako/Agilent, K8002). The signal was visualized by 3 min of incubation with diaminobenzidine chromogen (Agilent). The slides were dehydrated in a series of increasing alcohol concentrations, mounted with Euparal medium (ROTH) and covered.
The morphometric analysis consisted of measuring the areas covered by antigen-positive cells. The samples were observed with a Nikon Eclipse Ni microscope at magnifications of 200× (SPL and CT) and 100× (SPL’s germinal centers). The program NIS-Elements BR 5.41 allowed the reading and calculation of the positive reaction as a percentage of the field of view in areas of 344,000 μm2. The field of view of the CT image was selected starting from the lamina propria of the mucosa and moving toward the lumen. In the THM, the cortex to medulla (C/M) thickness ratio was also determined.
Blood sample analyses
Blood samples were taken from the cervical vein into tubes containing ethylenediaminetetraacetic acid (EDTA) (Equimed, Kraków, Poland). The isolation of lymphocytes and monocytes from the blood was performed as described previously (Szczypka et al., 2023). The blood was layered at a 1:1 ratio on the isolation mixture Histopaque®-1077 (Sigma-Aldrich, St. Louis, MO, USA). After centrifugation (3000 × g, 15 min, 4°C), the cells were collected from the interphase, washed with ice-cold phosphate-buffered saline (PBS) (Institute of Immunology and Experimental Therapy, Wrocław, Poland) with 1% bovine serum albumin (BSA) (Sigma-Aldrich, St. Louis, MO, USA) and centrifuged (380 × g, 7 min, 4°C). After two washes, the cells were suspended in PBS with 1% BSA, and the cell suspensions were incubated (30 min, 4°C) with monoclonal antibodies at the concentrations recommended by the manufacturer (Southern Biotech, Birmingham, AL, USA). The following monoclonal antibodies were used in this experiment: mouse anti-chicken monocyte/macrophage-FITC (KUL01), mouse anti-chicken Bu-1a-PE, mouse anti-chicken CD3-FITC, mouse anti-chicken TCRγδ-PE, mouse anti-chicken CD4-PE, and mouse anti-chicken CD8a- APC. The experiment also included staining with the appropriate isotype controls: mouse IgG1-APC, mouse IgG1-PE, and mouse IgG1-FITC. After incubation with monoclonal antibodies, the cells were washed and centrifuged (380 × g, 7 min, 4°C) two times with ice-cold PBS. The cells were subsequently fixed in PBS with 2% formaldehyde (Chempur, Piekary Śląskie, Poland). Fluorescence was measured via a flow cytometer (BD FACSCalibur, BD Biosciences, San Jose, CA, USA). The distribution of the cell surface markers was analyzed via CellQuest 3.1f. Pro software (Becton Dickinson, San Jose, CA, USA). We determined the percentages and total counts of monocytes and lymphocytes and the ratio of CD4+/CD8+ lymphocytes.
Statistical analysis
Statistical analyses were performed using Statistica ver. 13.1 software (TIBCO Software Inc., 2017), with the cage with 3 hens considered a replicate experimental unit for performance data (N = 8 per group). For the egg quality data, in order to exclude the risk of pseudoreplication, the values obtained from 3 eggs were averaged at the replicate cage level before statistical analysis (N = 8 per group) and entered into the statistical model as replicate cage means.. For other traits (the gut microbiota in the JEJ and CEC content; histomorphometric parameters of the intestine – DUO, JEJ and IL; immunohistochemistry and morphometry of lymphoid organs – SPL, CT, and THM; and blood analyses) the bird was used as the observation experimental unit (N = 8 per group). To determine the normality of the distribution, the Shapiro-Wilk test was performed. If the data were normally distributed, one-way ANOVA was performed, where differences between groups were assessed using the Tukey test. ANOVA was conducted according to the following model:
where Yij is the observed dependent variable, μ is the overall mean, αi is the effect of the diet, and δij is the random error.If the data were not normally distributed, the Kruskal–Wallis test was performed. Differences were considered statistically significant when P<0.05. The results are presented as the mean, standard error of the mean (SEM), and standard deviation (SD).
Results
Performance
Table 3 presents the performance results of laying hens after the 30th, 60th and 90th days of the experiment.
Table 3.
Performance of laying hens
| Parameter | C | L0.1 | L0.25 | L0.5 | L1 | SEM | P-value |
|---|---|---|---|---|---|---|---|
| 30th day | |||||||
| EP (%) | 90.47 | 92.19 | 92.76 | 93.52 | 92.38 | 0.493 | 0.387 |
| DEM (g per hen) | 56.00 | 55.35 | 57.05 | 56.05 | 56.60 | 0.252 | 0.268 |
| EW (g) | 57.07 | 56.77 | 58.13 | 57.10 | 58.05 | 0.257 | 0.329 |
| FI (g) | 129.1 | 129.6 | 129.6 | 129.6 | 129.9 | 0.118 | 0.587 |
| FCR | 2.306 | 2.346 | 2.273 | 2.314 | 2.298 | 0.011 | 0.351 |
| 60th day | |||||||
| EP (%) | 91.04 a | 94.12 ab | 94.42 ab | 95.00 b | 93.68 ab | 0.392 | 0.015 |
| DEM (g per hen) | 58.16 | 57.59 | 59.33 | 57.71 | 58.14 | 0.373 | 0.630 |
| EW (g) | 59.71 | 58.94 | 60.81 | 59.01 | 59.73 | 0.397 | 0.544 |
| FI (g) | 129.1 | 129.1 | 128.3 | 129.1 | 129.1 | 0.213 | 0.757 |
| FCR | 2.222 | 2.247 | 2.165 | 2.241 | 2.225 | 0.014 | 0.445 |
| 90th day | |||||||
| EP (%) | 92.07 a | 94.35 ab | 95.16 ab | 95.96 b | 94.08 ab | 0.361 | 0.010 |
| DEM (g per hen) | 58.85 | 59.17 | 59.83 | 59.14 | 58.82 | 0.257 | 0.759 |
| EW (g) | 60.54 | 60.39 | 61.12 | 60.34 | 60.18 | 0.271 | 0.854 |
| FI (g) | 129.5 | 128.9 | 129.7 | 129.3 | 127.2 | 0.552 | 0.773 |
| FCR | 2.205 | 2.180 | 2.170 | 2.188 | 2.165 | 0.012 | 0.886 |
No statistically significant differences were found in the performance of laying hens after 30 days of the experiment. After 60 days of the experiment, birds from the L0.5 group were characterized by significantly higher (P<0.05) EP compared to the C group. The situation was similar after 90 days of the experiment, when birds from the L0.5 group were also characterized by significantly higher (P<0.05) EP compared to the C group.
Egg quality
Table 4 shows the egg quality parameters after 30, 60 and 90 days of the experiment.
Table 4.
Egg quality
| Parameter | C | L0.1 | L0.25 | L0.5 | L1 | SEM | P-value |
|---|---|---|---|---|---|---|---|
| 30th day | |||||||
| Breaking strength (kg/cm2) | 5.518 | 5.942 | 5.759 | 5.801 | 5.863 | 0.049 | 0.168 |
| Thickness (mm) | 0.366 | 0.380 | 0.378 | 0.385 | 0.385 | 0.003 | 0.247 |
| Yolk color | 10.87 | 11.16 | 11.08 | 10.95 | 11.08 | 0.078 | 0.629 |
| HU | 96.35 | 96.19 | 93.72 | 93.89 | 94.94 | 0.463 | 0.256 |
| 60th day | |||||||
| Breaking strength (kg/cm2) | 5.301 a | 5.763 b | 5.633 ab | 5.665 ab | 5.607 ab | 0.048 | 0.035 |
| Thickness (mm) | 0.347 | 0.360 | 0.346 | 0.357 | 0.346 | 0.003 | 0.470 |
| Yolk color | 10.62 | 10.70 | 11.16 | 11.08 | 10.70 | 0.071 | 0.351 |
| HU | 83.32 | 85.42 | 85.29 | 82.82 | 83.57 | 0.551 | 0.270 |
| 90th day | |||||||
| Breaking strength (kg/cm2) | 5.504 | 5.739 | 5.865 | 5.766 | 5.867 | 0.050 | 0.527 |
| Thickness (mm) | 0.368 | 0.363 | 0.361 | 0.360 | 0.361 | 0.002 | 0.921 |
| Yolk color | 8.545 | 8.750 | 8.779 | 8.579 | 8.829 | 0.099 | 0.869 |
| HU | 91.85 | 94.26 | 93.20 | 92.03 | 93.33 | 0.548 | 0.782 |
The use of different levels of levan had no effect on egg quality parameters after 30 days of the experiment. After 60 days, eggs from the L0.1 group were characterized by significantly greater breaking strength (P<0.05) than eggs from the C group. After 90 days, no statistically significant differences were found in the assessed parameters.
The gut microbiota
The L0.25 and L0.5 groups were characterized by a significantly greater (P<0.05) number of Lactobacillus spp. bacteria in the JEJ than the C and L1 groups (Figure 1 a). Moreover, the L0.25 group was characterized by a significantly greater (P<0.05) number of Lactobacillus spp. bacteria than the L0.1 group (Figure 1 a). No statistically significant differences were found for Bifidobacterium spp. in JEJ among the assessed groups (Figure 1 b). However, hens in the L0.1, L0.25 and L0.5 groups were characterized by a significantly lower (P<0.05) number of bacteria from the Enterobacteriaceae family in the JEJ than those in the C group (Figure 1 c). The CEC did not significantly differ in terms of the number of Lactobacillus spp. or Enterobacteriaceae (Figure 1 d and 1 f). However, hens in the L0.1, L0.25 and L1 groups were characterized by a significantly greater (P<0.05) number of Bifidobacterium spp. bacteria than those in the C group (Figure 1 e).
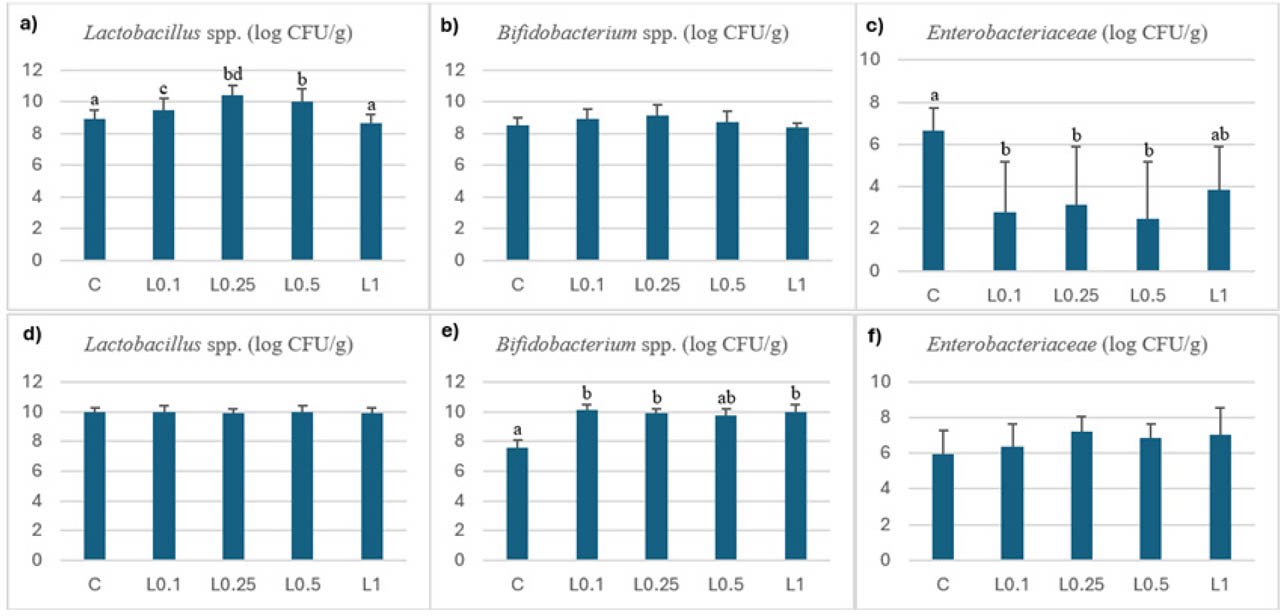
Figure 1.
The number of Lactobacillus spp., Bifidobacterium spp., and Enterobacteriaceae family bacteria in the JEJ and CEC (mean ± SD, N=8); a, b – values above bars with different letters differ significantly at the level of P<0.05; C – control group; L0.1, L0.25, L0.5, L1 – groups with the addition of 0.1%, 0.25%, 0.5% and 1% levan, respectively.
16S rRNA sequencing was performed to characterize the microbiota composition of the contents of JEJ and CEC. In the cecal contents, the total number of OTUs/ASVs was comparable across dietary treatments. The control group contained 233 OTUs/ASVs, while hens fed diets supplemented with levan showed slightly higher richness, with 253 OTUs/ASVs at 0.1%, 265 at 0.25%, 260 at 0.5%, and 263 at 1.0% supplementation. Venn diagram analysis indicated that 110 OTUs/ASVs were shared among all groups, representing a common core microbiota. In addition, each treatment group exhibited unique OTUs/ASVs. The control group contained 28 unique OTUs/ASVs, whereas 25 unique OTUs/ASVs were observed in the 0.1% levan group. The 0.25%, 0.5%, and 1.0% levan-supplemented groups each harbored 24 unique OTUs/ASVs. Due to the absence of biological replicates per treatment, these observations should be interpreted descriptively (Supplementary Figure 1). The Shannon diversity index showed variation among dietary treatments, with values of 6.35 in the C group, 6.80 at 0.1% levan, 6.96 at 0.25%, 6.69 at 0.5%, and 6.37 at 1.0% supplementation. Alpha diversity appeared to be higher at low to moderate levan concentrations, with the highest value observed at 0.25%, while the highest supplementation level resulted in a Shannon index comparable to the control (Supplementary Table 1). Non-metric multidimensional scaling (NMDS) analysis showed an excellent two-dimensional representation of the data, with a stress value of 0.0004, indicating minimal distortion of the original distance matrix. However, due to the limited number of samples and the lack of biological replicates, the ordination should be interpreted descriptively (Supplementary Figure 2). The 8 bacterial phyla were subjected to phylogenetic analysis. Phylogenetic classification revealed that Actinobacteriota, Firmicutes and Bacteroidota were the predominant phyla in laying hens from all the groups. However, in the C group, the relative abundance of Firmicutes (32.5%) was lower than that in the hens in the groups receiving a diet supplemented with levan (44.6–57.1%), and the relative abundance of Actinobacteriota was estimated to be 49.3%, whereas in the treated hens, the level of Actinobacteria varied between 6.8 and 14.2% (Figure 2 a). These differences were reflected in the massive reduction in Coriobacteriia in samples taken from hens fed a diet supplemented with levan (4.9–12.3%) and the increase in Clostridia (24.6–35.1%) compared with those in the C group (42.3% and 13.6%, respectively) (Figure 2 b). A significant dose-dependent increase in Bacilli was also observed (Figure 2 b). The relative abundance of bacteria in each order was also compared, confirming the analysis of phyla and classes. In hens from the C group, the relative abundance of Coriobacteriales (23.5%) was dramatically greater than that in hens with levan-supplemented diets (6.6–14.5%) and the abundances of Clostridia_UCG_014 and Lactobacillales increased when the levan was in the diet (6.9–12.7% and 9.8–18.3%, respectively), in comparison to those in the C group (1.8 and 5.3%, respectively) (Figure 2 c). Analysis of the relative abundance of bacteria in the families revealed striking differences in the effect of supplementation with levan in increasing unclassified Clostridia_UCG_014 (5.7–11.8%), Bacteroidaceae (7.9–12.2%) and Lactobacillaceae (9.1–17.8%) compared with those in the C group (1.6, 4.7, and 3.1%), respectively, and decreasing Eggerthellaceae in the C (23.5%) and treated groups (2.5–7.9%) (Figure 2 d). These results were reflected in the relative abundance of bacteria at the genus level. The relative abundances of unclassified Muribaculaceae and Enterorhabdus were greater in hens with no levan in the diet (7.8 and 14.2%, respectively) than in the levan-treated groups, with values estimated to be 3.3–5.6% and 1.2–5.1%, respectively. An increasing effect was observed for the relative abundances of Limosilactobacillus (4.1–8.7%) and Bacteroides (6.1–9.2%) in hens supplemented with levan in comparison with those in the C group (2.7 and 3.9%, respectively) (Figure 2 e). Phylogenetic analysis of the relative abundance of bacterial species clearly revealed a dose-dependent effect of the supplementation of the diet, with 0.1 and 0.25% of levan in the diet in one cluster related to the C group and 0.5 and 1.0% levan in another cluster related to the C group. The taxonomic assignments are presented in Figure 3.
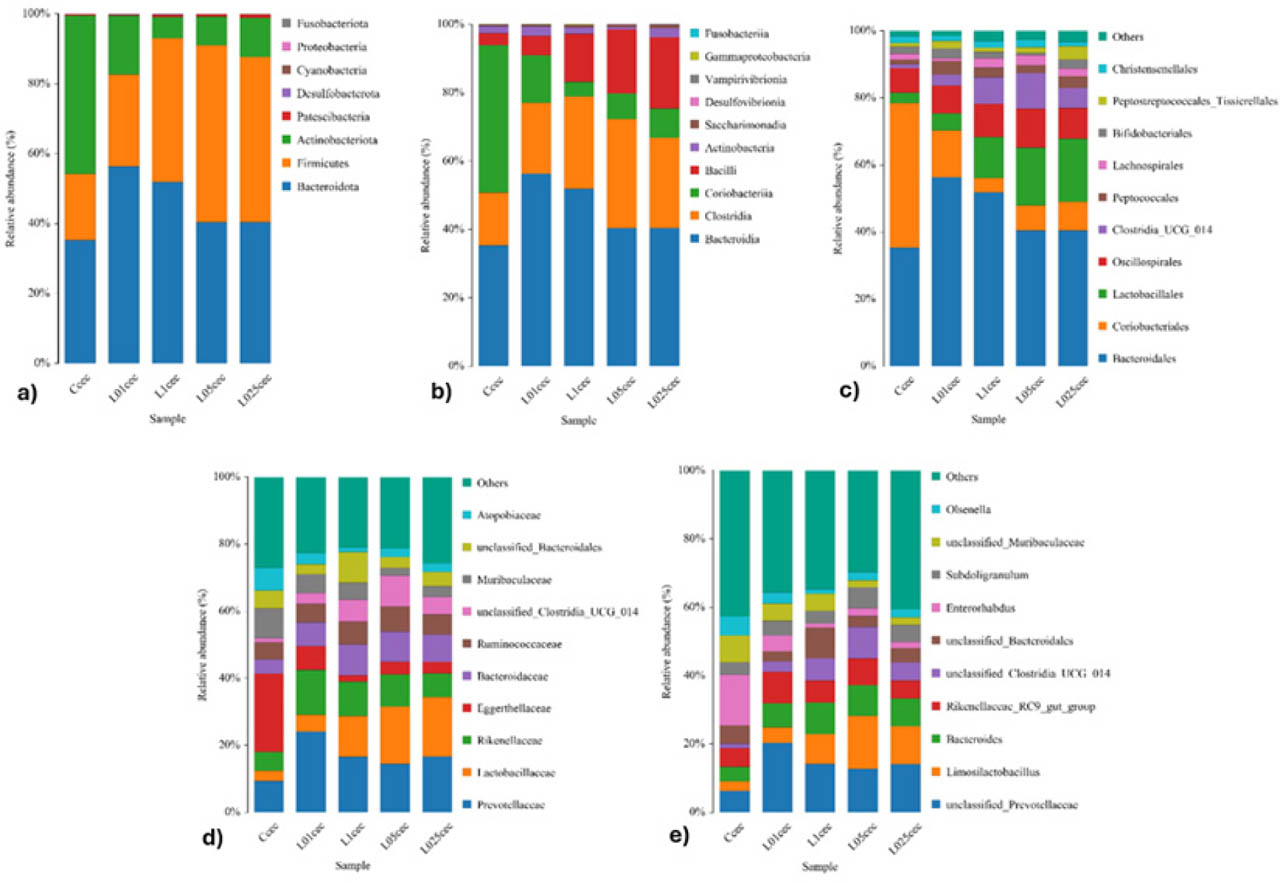
Figure 2.
Relative abundance of individual phyla (2 a), classes (2 b), orders (2 c), families (2 d), and genera (2 e) of bacteria in the CEC of laying hens.
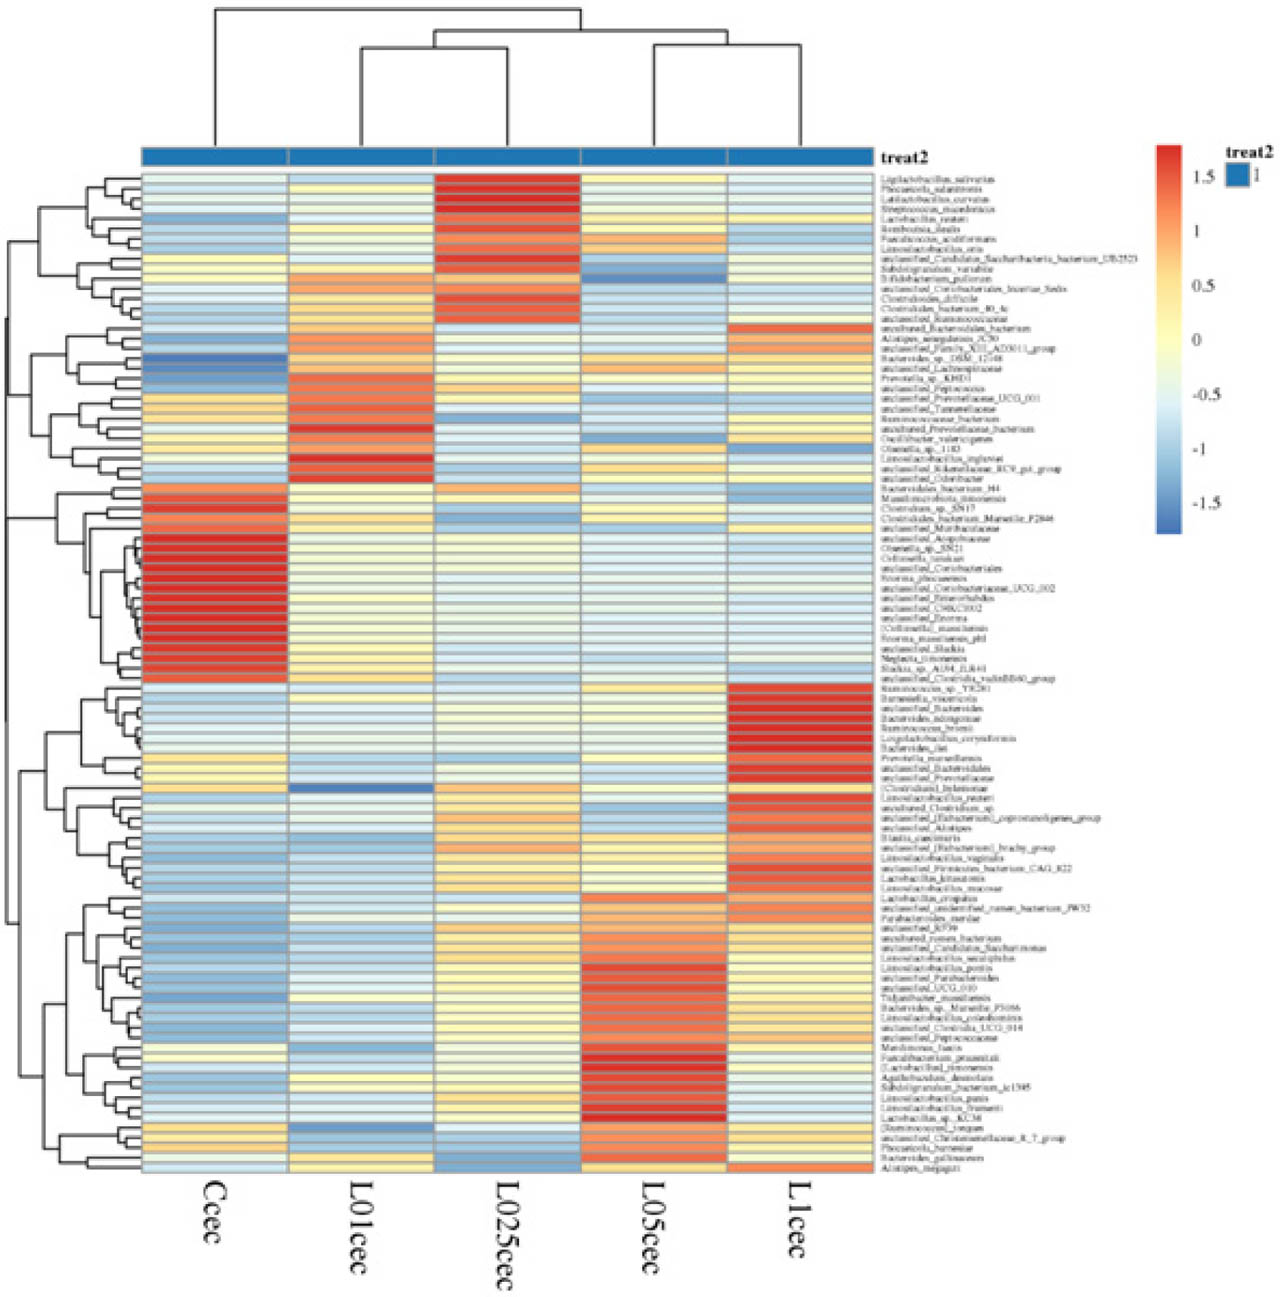
Figure 3.
The taxonomic assignments in CEC.
In the samples of intestinal contents taken from the JEJ, showed lower complexity and no differences were observed.
Histomorphometry of individual parts of the small intestine
Compared with those in groups L0.25 and L1, the intestinal villi in groups C, L0.1 and L0.5 were significantly longer (P<0.05) in the DUO (Figure 4). In the case of JEJ, significantly longer (P<0.05) intestinal villi were observed in the C and L0.1 groups than in the L0.25 and L1 groups (Figure 4). There were no differences in the surface area of the intestinal villi in the DUO and IL, but in the JEJ, the intestinal villi from the C and L0.1 groups were characterized by a significantly larger (P<0.05) surface area than those from the other groups (Figure 5). In the L.025, L0.5 and L1 groups, significantly deeper (P<0.05) intestinal crypts were found in the DUO than in the other groups (Figure 6). Compared with the L.025 group the C and L0.1 groups were characterized by significantly deeper (P<0.05) crypts in the JEJ (Figure 6). In the IL, no statistically significant differences were found in terms of intestinal crypt depth (Figure 6). The V/C ratio was significantly lower (P<0.05) in the DUO from the L1 group than in that from the C group (Figure 7). There were no statistically significant differences in the discussed ratios in the JEJ or the IL (Figure 7).
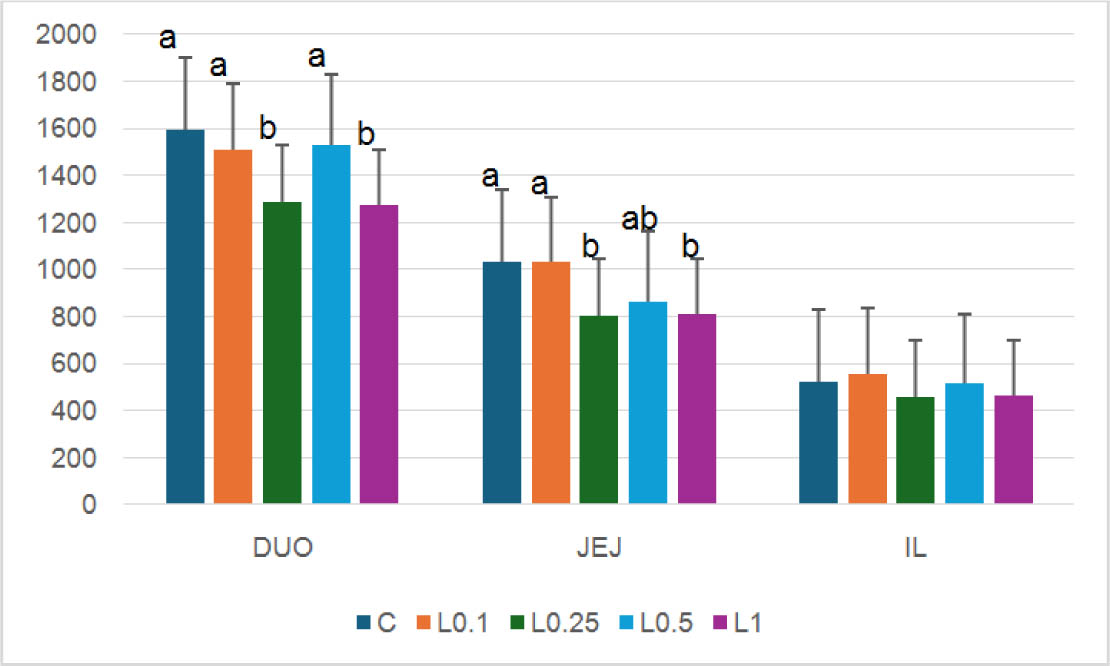
Figure 4.
Length of intestinal villi (μm) in DUO, JEJ and IL (mean ± SD, N=8); a, b – values above bars with different letters differ significantly at the level of P<0.05; DUO – duodenum; JEJ – jejunum; IL – ileum; C – control group; L0.1, L0.25, L0.5, L1 – groups with the addition of 0.1%, 0.25%, 0.5% and 1% levan, respectively.
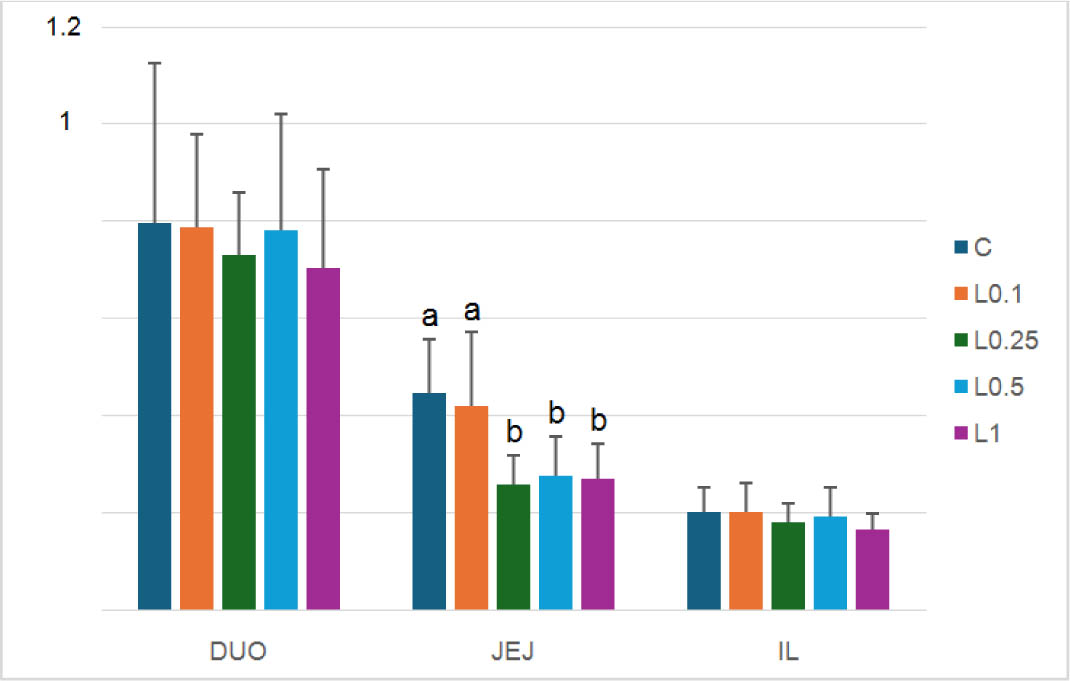
Figure 5.
Intestinal villi surface area (mm2) in DUO, JEJ and IL (mean ± SD, N=8); a, b – values above bars with different letters differ significantly at the level of P<0.05; DUO – duodenum; JEJ – jejunum; IL – ileum; C – control group; L0.1, L0.25, L0.5, L1 – groups with the addition of 0.1%, 0.25%, 0.5% and 1% levan, respectively.
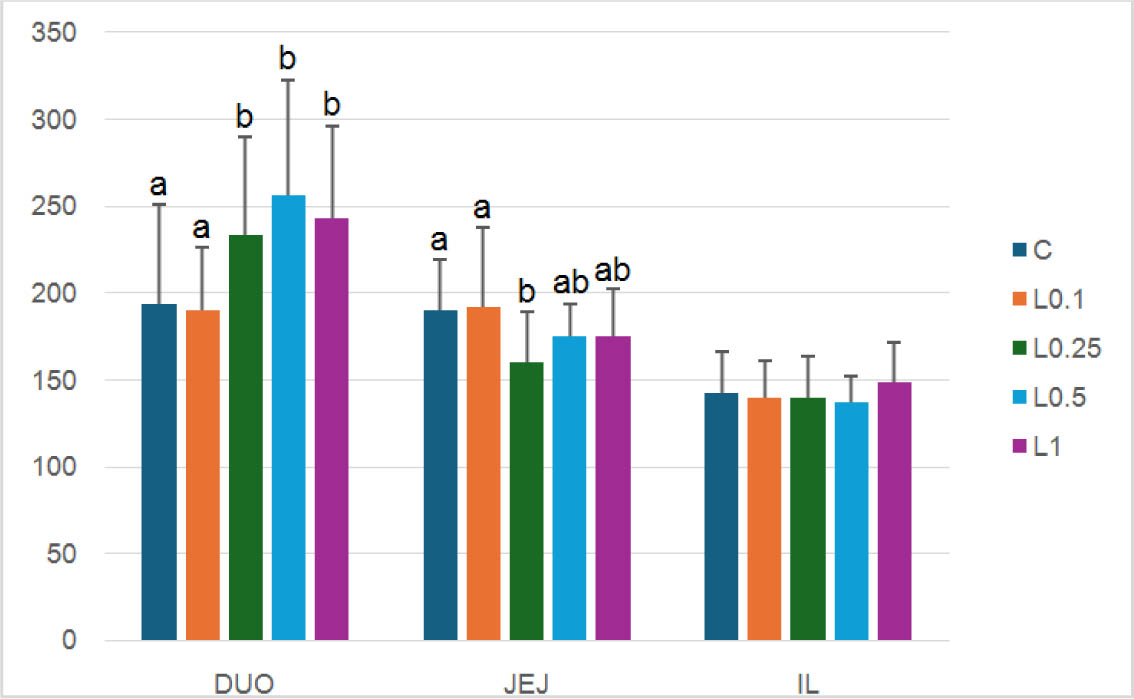
Figure 6.
Depth of intestinal crypts (μm) in DUO, JEJ and IL (mean ± SD, N=8); a, b – values above bars with different letters differ significantly at the level of P<0.05; DUO – duodenum; JEJ – jejunum; IL – ileum; C – control group; L0.1, L0.25, L0.5, L1 – groups with the addition of 0.1%, 0.25%, 0.5% and 1% levan, respectively.
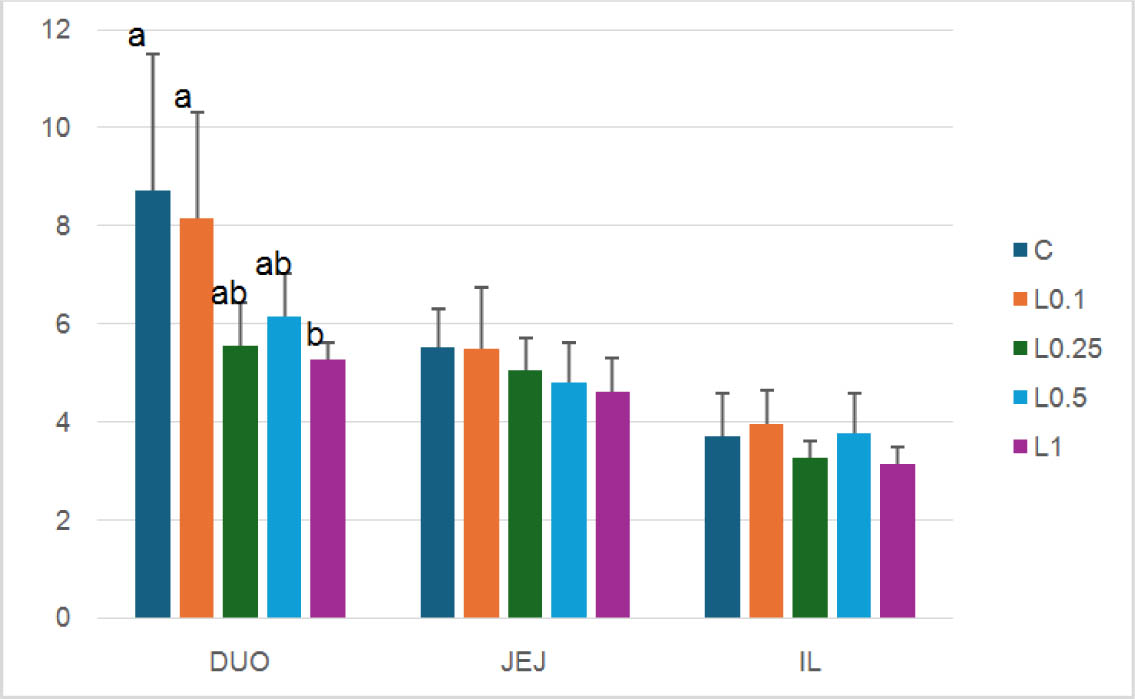
Figure 7.
The V/C ratio in DUO, JEJ and IL (mean ± SD, N=8); a, b – values above bars with different letters differ significantly at the level of P<0.05; DUO – duodenum; JEJ – jejunum; IL – ileum; C – control group; L0.1, L0.25, L0.5, L1 – groups with the addition of 0.1%, 0.25%, 0.5% and 1% levan, respectively.
Morphometry of the THM and specific immune cell composition in the SPL and CT
In the present study the C/M ratio was significantly lower (P<0.05) in the L0.25, L0.5 and L1 groups than in the C group (Figure 8). The lowest value was noted in the L0.25 group.
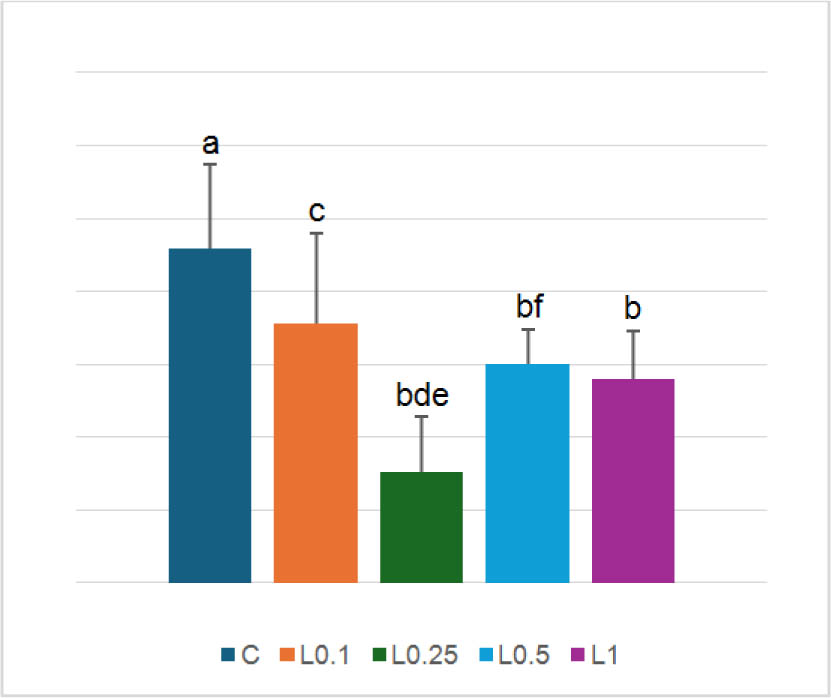
Figure 8.
The cortex to medulla thickness ratio in THM (mean ± SD, N=8); a, b – values above bars with different letters differ significantly at the level of P<0.05; C – control group; L0.1, L0.25, L0.5, L1 – groups with the addition of 0.1%, 0.25%, 0.5% and 1% levan, respectively.
In the present study, the numbers of B lymphocytes (Bu-1+), helper T lymphocytes (CD4+), and cytotoxic cells (T lymphocytes and NK cells) (CD8α+) were estimated in the CT and SPL of laying hens receiving different levels of levan in the feed (Figures 9 and 10). There were no statistically significant differences in the number of Bu-1+ cells in the SPL between the assessed groups. A significantly lower (P<0.05) number of CD8α+ cells was recorded in the SPL of hens in the L0.25 group than in those in the C group. In the CT, the number of Bu-1+, CD4+ and CD8+ cells did not differ significantly between the experimental groups and the C group (Figure 10). Only differences in the number of Bu-1+ and CD4+ cells were observed between groups receiving different concentrations of levan.
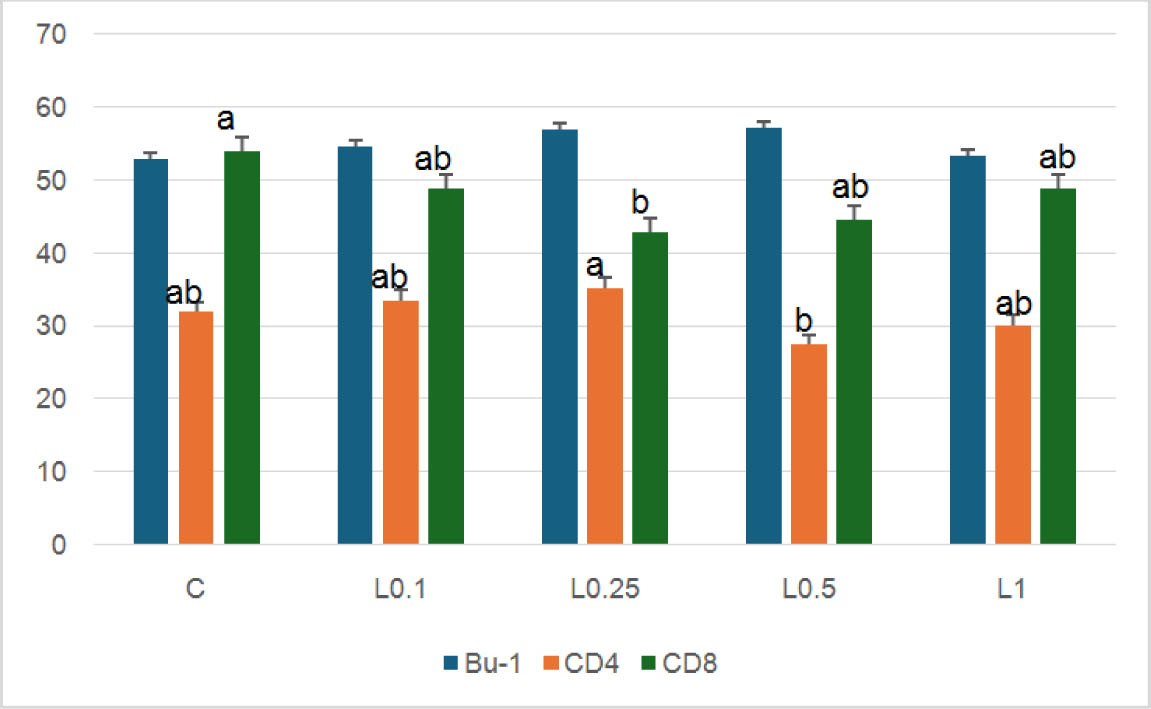
Figure 9.
The number of Bu-1+, CD4+ and CD8α+ cells in the SPL (mean ± SD, N=8); a, b – values above bars with different letters differ significantly at the level of P<0.05; C – control group; L0.1, L0.25, L0.5, L1 – groups with the addition of 0.1%, 0.25%, 0.5% and 1% levan, respectively.
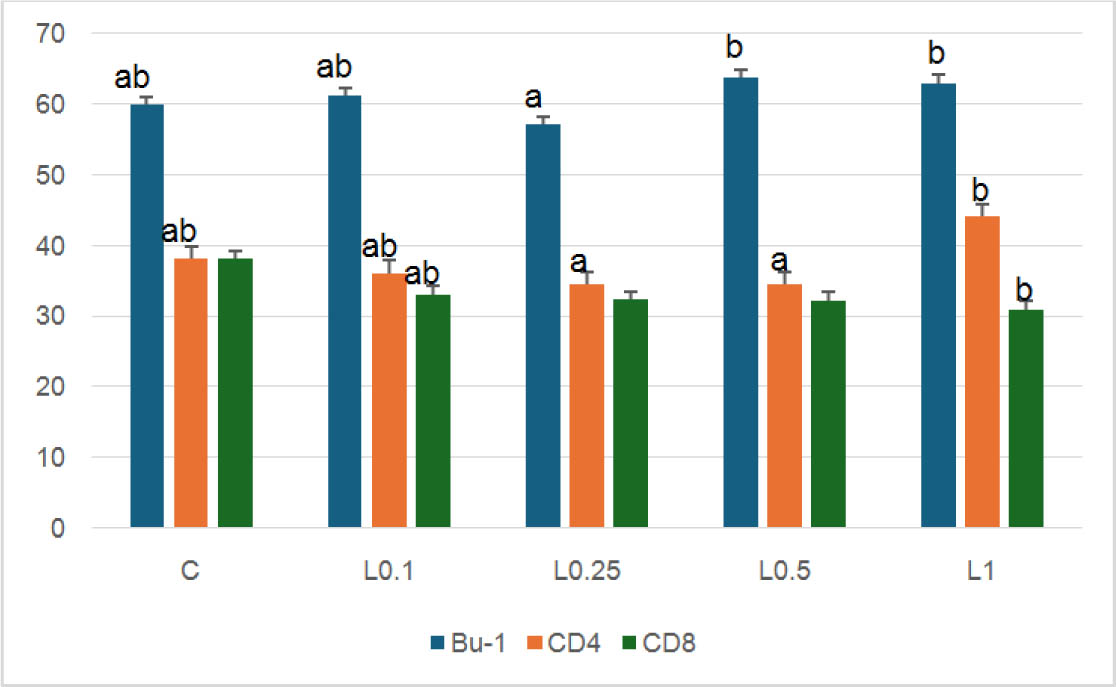
Figure 10.
The number of Bu-1+, CD4+ and CD8α+ cells in the CT (mean ± SD, N=8); a, b – values above bars with different letters differ significantly at the level of P<0.05; C – control group; L0.1, L0.25, L0.5, L1 – groups with the addition of 0.1%, 0.25%, 0.5% and 1% levan, respectively.
In the SPL, the CD4+/CD8+ cell ratio was also calculated (Figure 11). Compared with the C group, the L0.25 group presented a significantly greater (P<0.05) CD4+/CD8+ cell ratio.
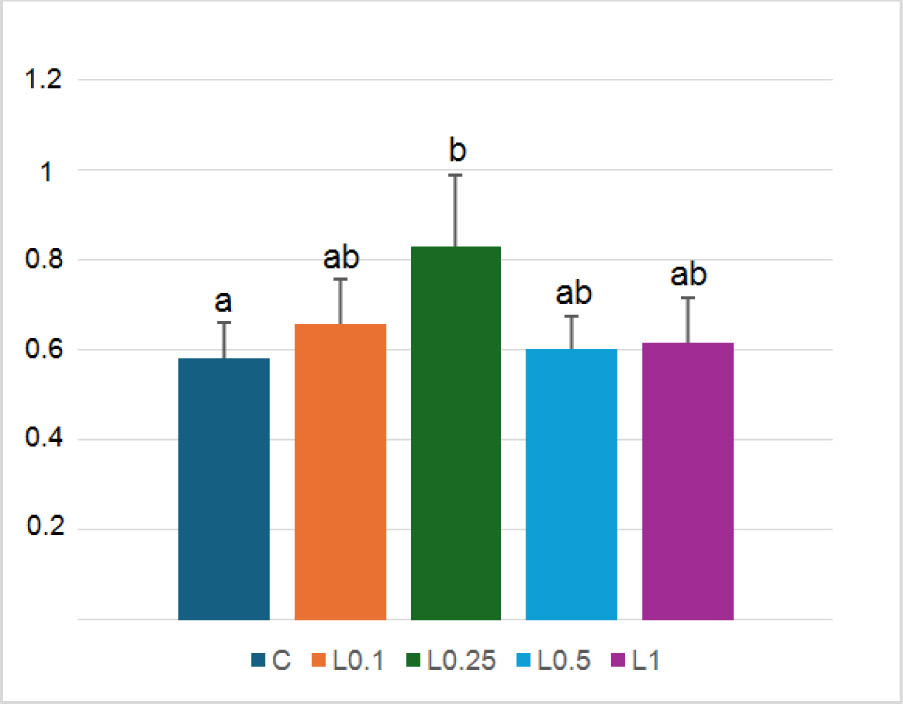
Figure 11.
CD4+/CD8α+ cells ratio in the SPL (mean ± SD, N=8); a, b – values above bars with different letters differ significantly at the level of P<0.05; C – control group; L0.1, L0.25, L0.5, L1 – groups with the addition of 0.1%, 0.25%, 0.5% and 1% levan, respectively.
Populations of blood lymphocytes and monocytes
Table 5 presents the results related to the populations of lymphocytes and monocytes in the blood of the tested birds.
Table 5.
Populations of blood lymphocytes and monocytes
| Type of cells | C | L0.1 | L0.25 | L0.5 | L1 | SEM | P-value | |
|---|---|---|---|---|---|---|---|---|
| KUL01+ cells | % | 15.46 ab | 22.01 a | 19.42 ab | 20.13 ab | 14.55 b | 1.422 | 0.042 |
| Total count (×106/ml) | 5.990 | 10.11 | 9.090 | 8.540 | 5.540 | 0.892 | 0.087 | |
| Bu-1a+ cells | % | 25.39 | 29.01 | 27.20 | 24.68 | 27.74 | 0.787 | 0.235 |
| Total count (×106/ml) | 9.720 | 12.44 | 12.69 | 10.65 | 9.600 | 0.657 | 0.108 | |
| CD3+ cells | % | 60.48 a | 47.38 b | 46.14 b | 47.99 b | 54.01 ab | 2.688 | 0.001 |
| Total count (×106/ml) | 23.52 | 20.63 | 21.11 | 20.19 | 19.58 | 0.677 | 0.693 | |
| CD4+ cells | % | 40.80 ab | 37.23 b | 37.48 b | 36.27 b | 44.48 a | 1.514 | 0.001 |
| Total count (×106/ml) | 15.80 | 16.48 | 17.38 | 15.30 | 16.08 | 0.350 | 0.931 | |
| CD8+ cells | % | 16.47 a | 11.44 b | 10.39 b | 12.80 ab | 11.95 b | 1.040 | 0.002 |
| Total count (×106/ml) | 6.360 | 5.020 | 4.860 | 5.390 | 4.260 | 0.347 | 0.245 | |
| CD3+/TCRγδ+ cells | % | 14.97 | 14.28 | 13.22 | 12.67 | 14.60 | 0.432 | 0.578 |
| Total count (×106/ml) | 5.830 | 6.150 | 6.140 | 5.460 | 5.340 | 0.168 | 0.900 | |
| CD4+/CD8+ ratio | 2.630 b | 3.320 ab | 3.650 ab | 2.990 ab | 3.930 a | 0.230 | 0.014 |
In the L0.1 group, there was a significantly greater (P<0.05) percentage of monocytes (KUL01+ cells) than in the L1 group. None of the concentrations of levan affected the population of Bu-1a+ cells, either the percentage or total count. Levan supplementation decreased (P<0.05) the percentage of T cells (CD3+ cells) compared with that in the C group. This effect was observed after the administration of levan at concentrations of 0.1%, 0.25% and 0.5%. A similar downward trend was observed after the addition of 1% levan; however, this change was not statistically significant. Levan, regardless of the concentration used, did not affect the percentage of CD4+ cells compared with that in the C group. However, statistically significant (P<0.05) differences were detected between the levan groups. The percentage of CD4+ cells was lower in the L0.1, L0.25 and L0.5 groups than in the L1 group. Levan at concentrations of 0.1%, 0.25% and 1% decreased (P<0.05) the percentage of CD8+ cells compared with that in the C group. After 0.5% levan administration, a similar downward trend was observed; however, this difference was not statistically significant. Levan at a concentration of 1% increased (P<0.05) the CD4+/CD8+ ratio compared with that in the C group. The use of levan at other concentrations showed a similar upward trend, but it was not statistically significant. There were no changes in the total count of T cells (CD3+, CD4+ and CD8+ cells) after levan supplementation. Levan, regardless of the concentration used, did not affect either the percentage or total count of the TCRγδ+ cell subpopulation.
Discussion
The improvement in EP is probably due to the general prebiotic properties of levan causing changes in the gastrointestinal microflora, nutrient absorption and the surface of the intestinal epithelium. Notably, these are the first studies in which levan was used as a feed additive in the diet of laying hens. To date, the fructan that has been used primarily in poultry nutrition is inulin. Chen et al. (2005), who used inulin in the feed of laying hens, reported that inulin significantly increased (P<0.05) EP. Similar to our research, the use of this additive had no effect on EW or FI. Other results were obtained by Shang et al. (2010), who reported no significant effect of different inulin concentrations on EP or other production parameters. Świątkiewicz et al. (2010) also reported that inulin has no effect on egg performance parameters. Park and Park (2012) reported that the use of inulin in the nutrition of laying hens significantly increased (P<0.05) EP. Additionally, Shang et al. (2020) reported that inulin supplementation, especially at 15 g/kg, can significantly increase (P<0.05) EP and EW, and significantly reduce (P<0.05) the FCR.
The literature indicates that the use of low doses of fructans increases the absorption of nutrients, including minerals such as calcium, which should translate into improved eggshell quality (Azorin-Ortuno et al., 2009). The present study seems to confirm this tendency, especially considering that a difference in breaking strength was observed in the L0.1 group. Similar results were obtained by Shang et al. (2010), who reported that inulin had no effect on egg quality parameters. Different results were presented by Park and Park (2012), who reported that the addition of fructan in the form of inulin significantly increased HU, eggshell thickness and breaking strength. They did not observe an effect of the addition of inulin on the color of the yolk, which is natural because fructans are not dyes. Other results were also obtained by Shang et al. (2020), who reported that the addition of inulin can have a positive effect on eggshell thickness. These findings, similar to those of the present study, revealed no effect of the use of fructans on HU.
The results confirmed that levan has prebiotic properties and stimulates the growth of probiotic bacteria, while inhibiting the development of potentially pathogenic microflora. This is because bacteria from the genera Lactobacillus spp. and Bifidobacterium spp. use fructans much more efficiently in the fermentation process than other groups of bacteria do. The byproducts of this process are short-chain fatty acids (SCFAs) (Chen, 2003) which acidify the gastrointestinal environment and, in turn, limit the opportunities for the development of other microorganisms. Similar results were obtained by Shang et al. (2010), who reported that the addition of 2% inulin significantly increased (P<0.05) the number of Bifidobacterium spp. in CEC. Park and Park (2012) reported that the addition of inulin significantly increased (P<0.05) the number of Lactobacillus spp. and Bifidobacterium spp. and significantly decreased (P<0.05) the number of Escherichia coli and Salmonella in CEC. Abdelqader et al. (2013) noted that the addition of inulin significantly increased (P<0.05) the number of Lactobacillus spp. and Bifidobacterium spp. in CEC. The obtained results are, to some extent, consistent with the results of other authors who also indicated Firmicutes, Actinobacteria and Bacteroidetes as the dominant phyla (Li et al., 2018; Song et al., 2020). Li et al. (2018), however, did not demonstrate such a strong effect of inulin and wheat bran use on the development of the microbiological profile of birds as the present study did. However, it should be taken into account that they euthanized the birds on the 11th day of life; the lack of a visible effect on the composition of the gastrointestinal microflora may therefore be due to the young age of the birds. Xia et al. (2021) also did not find that the inclusion of inulin in the basal diet significantly affects the composition and diversity of the gastrointestinal microbiota. The differences in the results are most likely due to the effects of different durations of prebiotic use, which, in the case of this study, were longer and lasted 90 days.
The changes described in the histomorphometric parameters of the small intestine of laying hens under the influence of levan provide new information on the potential use of fructans as prebiotics. It is generally believed that a greater length of the intestinal villi increases the surface area capable of better absorbing available nutrients (Caspary, 1992). However, the increased length of the intestinal villi means that more energy and nutrients are needed to replace the intestinal mucosa more quickly. The use of additional nutrients to regenerate the mucosa may therefore come at the expense of the energy needed to maintain the animal’s performance (Rehman et al., 2007). On the other hand, shortening of the intestinal villi and deepening of the crypts may lead to poor absorption of nutrients and, consequently, poorer performance of the animal (Xu et al., 2003). Deepened crypts indicate rapid tissue turnover, allowing intestinal villi renewal in response to normal sloughing or inflammation induced by pathogens or their toxins (Yason et al., 1987). An increase in the V/C ratio is related to increased epithelial cell turnover (Chichlowski et al., 2007), and longer intestinal villi are associated with activated cell mitosis (Samanya and Yamauchi, 2002). On the basis of the results obtained in this study, the changes observed in the epithelium of the small intestine are a negative effect of the use of levan because they lead to a reduction in the absorption surface. However, it should be noted that on the surface of the intestinal villi, in addition to enterocytes (absorptive cells), there is also a variable number of goblet cells and enteroendocrine cells, which do not have absorbent properties. Therefore, the absorptive surface of the intestinal villi is largely dependent on the mutual proportions of absorptive, goblet and enteroendocrine cells (Awad et al., 2011). Therefore, this should be the aim of future research on the possibility of using fructans in poultry nutrition. The effects of fructans on the histomorphometric parameters of the small intestine of laying hens have not been widely studied. Research has focused on broiler chickens, whose production cycle is much shorter; therefore, the obtained results cannot be translated to laying hens. Abdelqader et al. (2013) reported that the addition of inulin to the diet of laying hens significantly increases (P<0.05) the length of intestinal villi and the depth of crypts in DUO, JEJ and IL.
In the thymus, intensive proliferation, maturation and selection of thymocytes take place in the cortex, whereas mature CD4+ or CD8+ cells predominate in the medulla (Nagy et al., 2021). A decrease in the C/M ratio usually indicates thinning of the cortex or widening of the medulla, which may not be observed for similar organ weights and lobule diameters (Elmore, 2006). In chickens, the physiological involution of the thymus begins at approximately 2–4 months of age and is dependent on the strain (Ciriaco et al., 2003; Ayman et al., 2020). In the present study, the thymuses came from layers aged 39 weeks, i.e. with an advanced involution process. In several cases, blurring of the boundary between the cortex and the medulla was observed. The decrease in the C/M ratio resulting from the relative thinning of the cortex in relation to the medulla indicates that the addition of levan may accelerate the process of thymic involution in laying hens.
It can be concluded that levan may cause some immunosuppression, especially in CD8+ cells in the SPL and in the CT (Figures 9 and 10). This is contrary to the results obtained by Janardhana et al. (2009), who reported that the use of mannan-oligosaccharides (MOS) and fructo-oligosaccharides (FOS) causes immunosuppression in the CT of broiler chickens. There was a significant decrease (P<0.05) in the number of Bu-1+ lymphocytes in the CT. These results can be explained by the ability of levan to promote the growth of beneficial microorganisms, such as Lactobacillus spp. and Bifidobacterium spp., and to inhibit the growth of Enterobacteriaceae and Clostridum spp. Another possible mediator of immunosuppression may be byproducts of levan fermentation, such as SCFAs, which in turn may bind to receptors expressed on leukocytes and affect their function (Janardhana et al., 2009). The effect of MOS on human lymphocytes has been well documented (Nelson et al., 1984; Muchmore et al., 1990; Nelson et al., 1991). These studies have shown that in vivo, mannan can cause suppression directly by blocking T or B-cell receptors or indirectly by inducing the production of prostaglandin E2 by monocytes or antigen-presenting cells, which in turn can attenuate the proliferative response of T cells to mitogens and inhibit the formation of B-cell colonies in the SPL and lymph nodes (Jelinek and Lipsky, 1985; Jelinek et al., 1985). The results of the present study revealed that levan appears to have a similar effect on laying hens. Compared with the C group, the L0.25 group presented a significantly greater CD4+/CD8+ cell ratio in the SPL. This was due to a decrease in the number of CD8+ cells in the L0.25 group. These results are consistent with those obtained by Huang et al. (2015), who noted that the use of inulin in the diet of broiler chickens increases the ratio of CD4+ to CD8+ lymphocytes.
On the basis of the results related to the population of blood lymphocytes and monocytes, it can also be concluded that the use of levan in the nutrition of laying hens causes some immunosuppression, including T CD8+ cells. Kim et al. (2011), reported that the heterophil:lymphocyte ratio and basophil leukocyte count were significantly lower (P<0.05) in birds receiving MOS supplementation in the feed. These results are inconsistent with those obtained by Mohebbifar et al. (2013), who noted no effect of the use of prebiotics in bird nutrition on white blood cell counts in laying hens. Other results were obtained by Helal et al. (2015), who reported that the use of prebiotics in the diet of broiler chickens significantly increased (P<0.05) the total number of leukocytes and the percentage of lymphocytes. Additionally, Biswas et al. (2019) reported that the inclusion of a prebiotic in the form of MOS in the diet of broiler chickens significantly increased the immune response rates in the blood of tested animals.
Conclusion
The addition of levan to the diet of laying hens had a positive effect on the performance of the birds, especially in the EP context. At low doses, levan had a positive effect on several egg quality parameters, such as breaking strength. The use of levan as a feed additive promoted the development of the gastrointestinal microflora by promoting the growth of Lactobacillus spp. and Bifidobacterium spp. bacteria and inhibiting the growth of Enterobacteriaceae bacteria. Exploratory 16S rRNA-based profiling of pooled samples suggested shifts in bacterial community composition. Without additional tests, such as determining the mutual ratio of enterocytes, goblet cells and enteroendocrine cells, it is difficult to clearly determine the effect of levan on the intestinal epithelium. Levan, its fermentation products, as well as changes in the composition of the microflora of the digestive tract of laying hens may have some immunosuppressive effects, as confirmed by examination of lymphatic organs and the population of lymphocytes and monocytes in the blood. Taking into account all the indicators examined, the best solution seems to be the addition of 0.5% levan to the diet of laying hens. However, despite many confirmed positive effects, it is crucial to find solutions that allow for the effective acquisition of levan, which significantly reduces its price. Until this point, the use of levan in a large-scale production has been rather unlikely.
Notes
[9] Competing interests
The authors declare that they have no known competing financial interests or personal relationships that could have appeared to influence the work reported in this paper.
[10] Contributed by Authors’ contributions
DK: conceptualization and design, methodology, investigation, data interpretation, writing – original draft preparation, funding acquisition. MKo: conceptualization and design, methodology, supervision. JPM: methodology, data interpretation, writing – review and editing. MK-B: methodology, data interpretation, writing – review and editing. MKu: methodology, data interpretation, writing – review and editing. ML: methodology, data interpretation, writing – review and editing. MS: methodology, data interpretation, writing – review and editing. EP: formal analysis, investigation, writing – review and editing. CC: formal analysis, investigation, data interpretation. SF: formal analysis, investigation. ZL: methodology.