
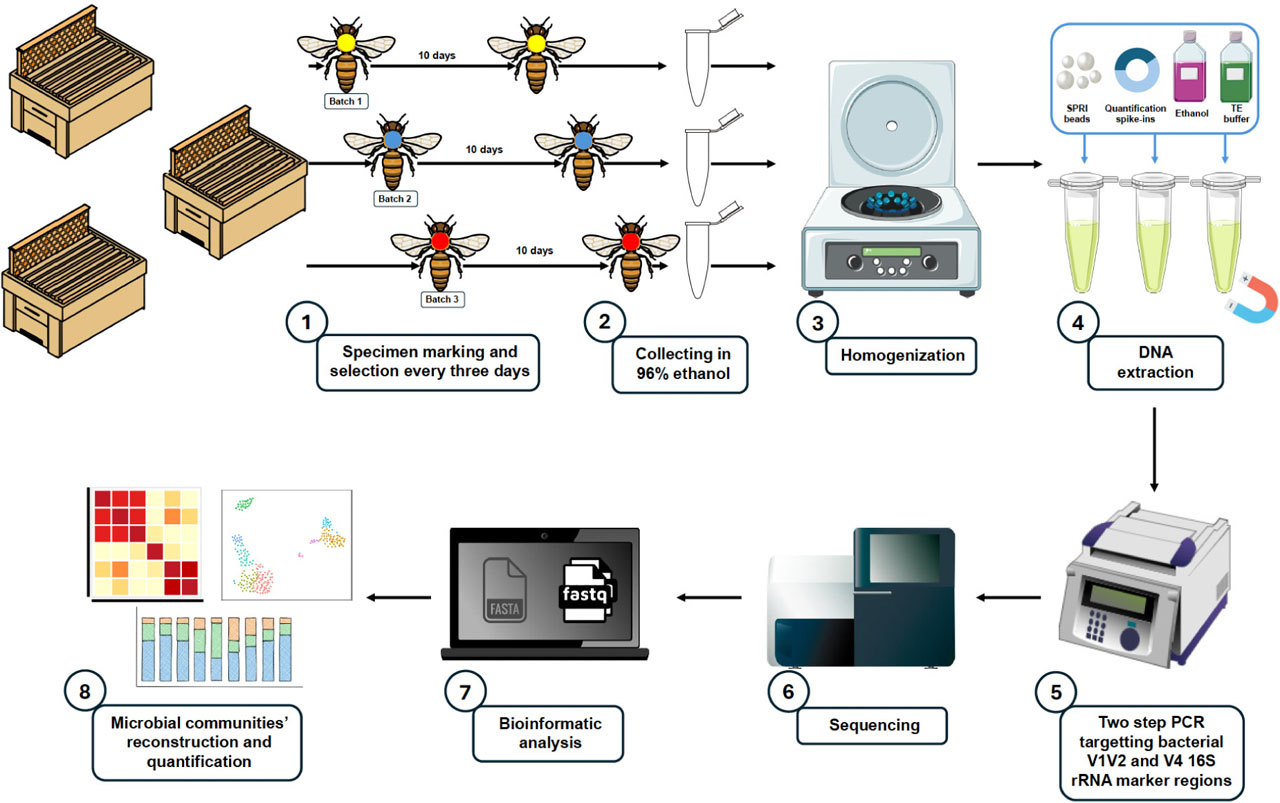
Figure 1.
The experimental workflow of the study.
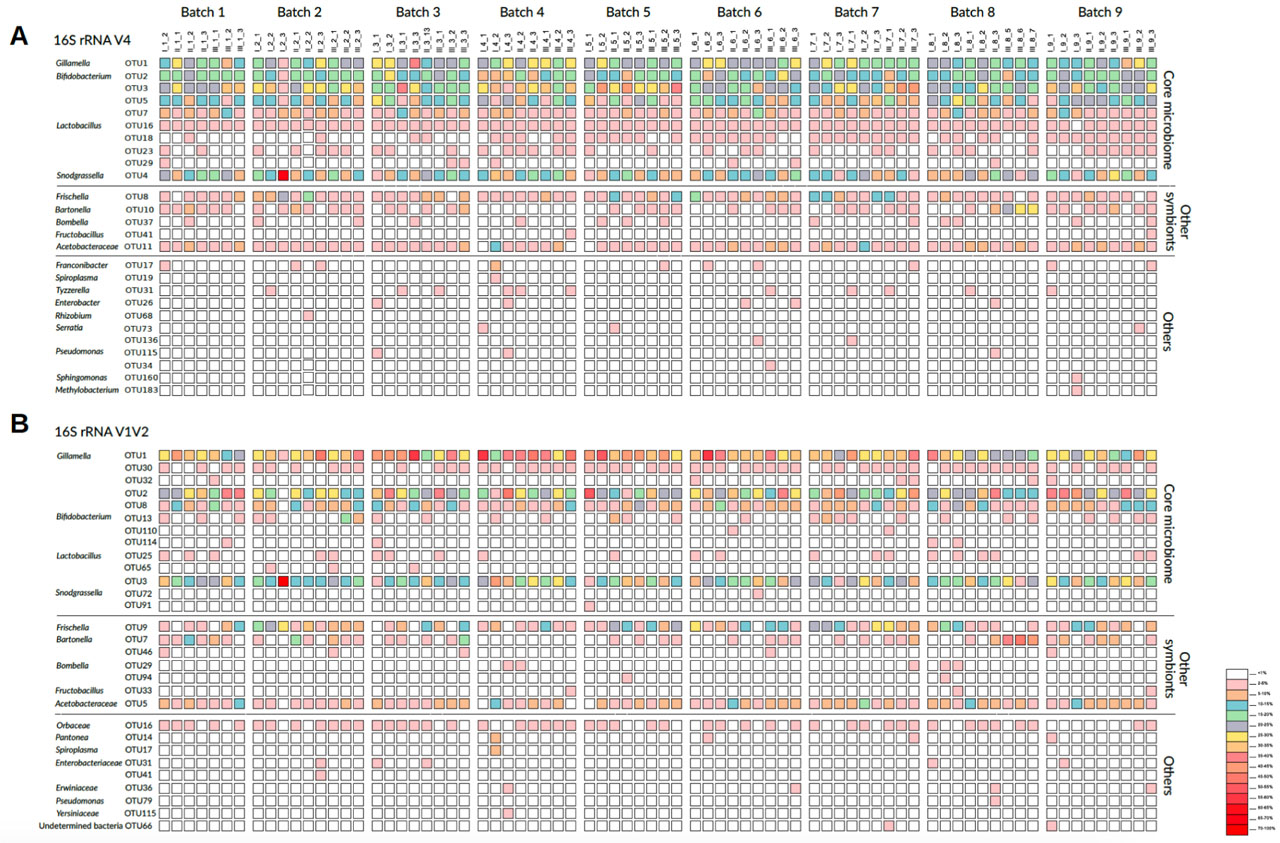
Figure 2.
The bacterial relative abundance across the studied batches. A. Reconstruction based on bacterial 16S rRNA hypervariable region V4. B. Reconstruction based on bacterial 16S rRNA hypervariable region V1–V2.
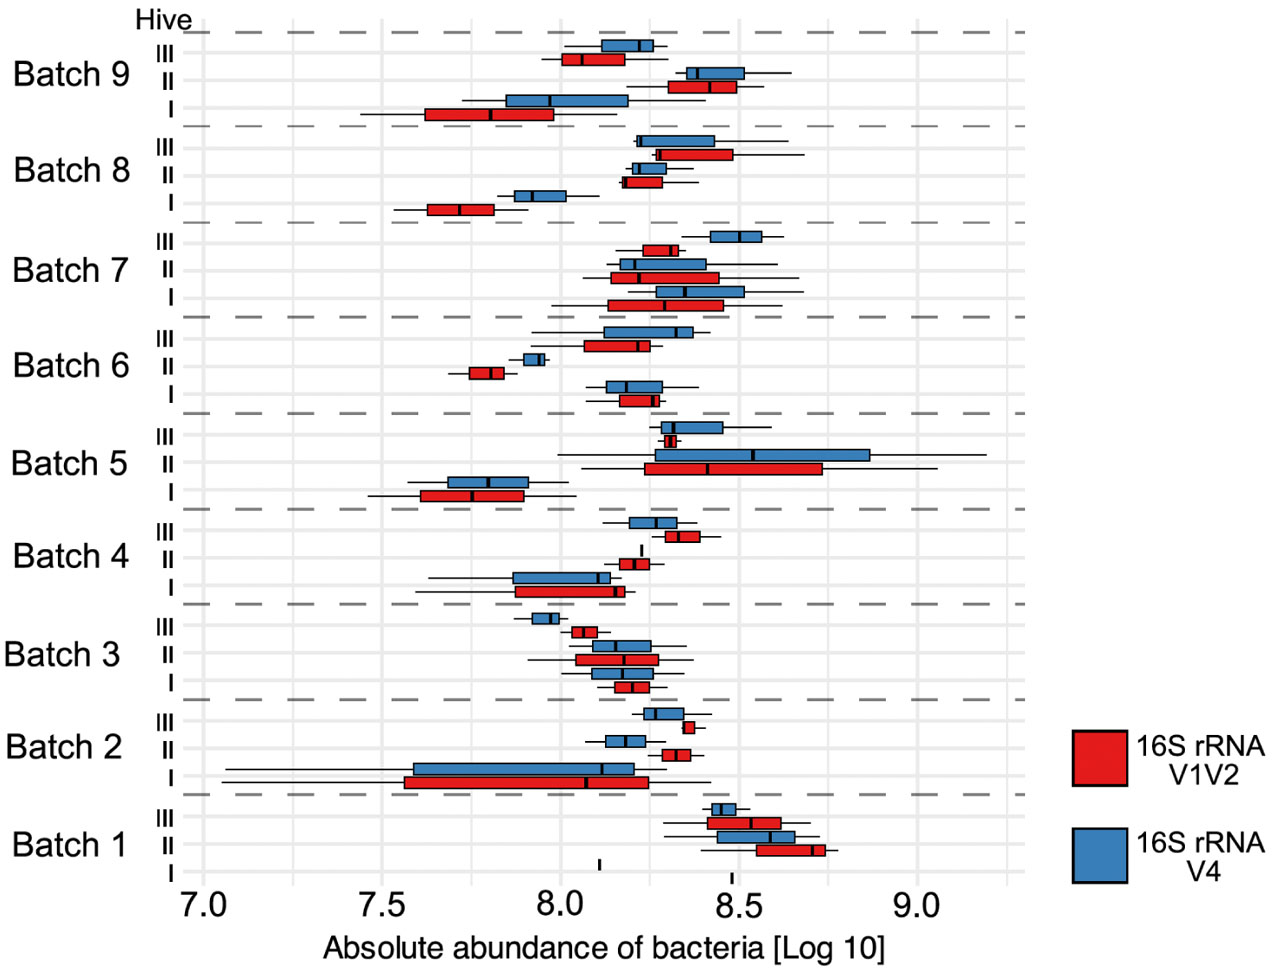
Figure 3.
Comparison of the absolute abundance of bacteria between batches and used marker gene regions.