
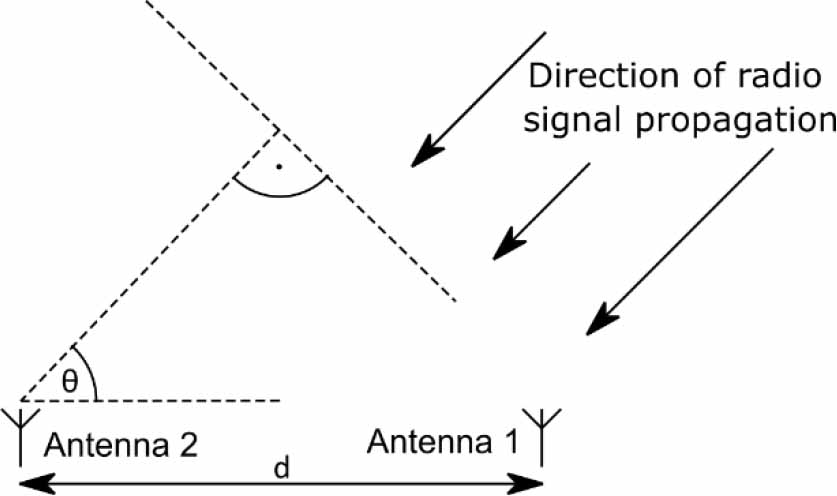
Fig. 1.
Graphical representation of the angle of arrival
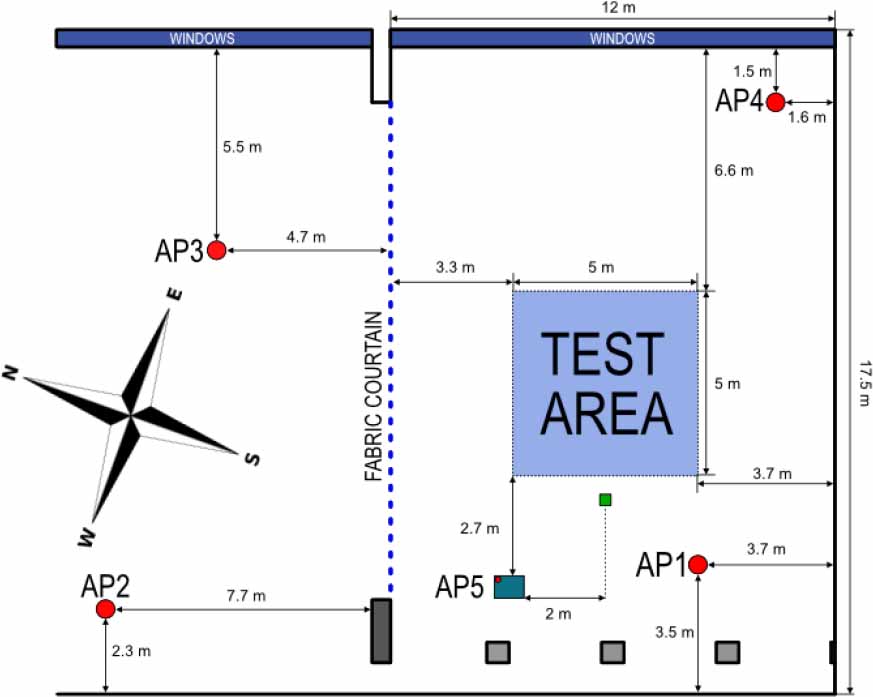
Fig. 2.
Equipment layout in the building
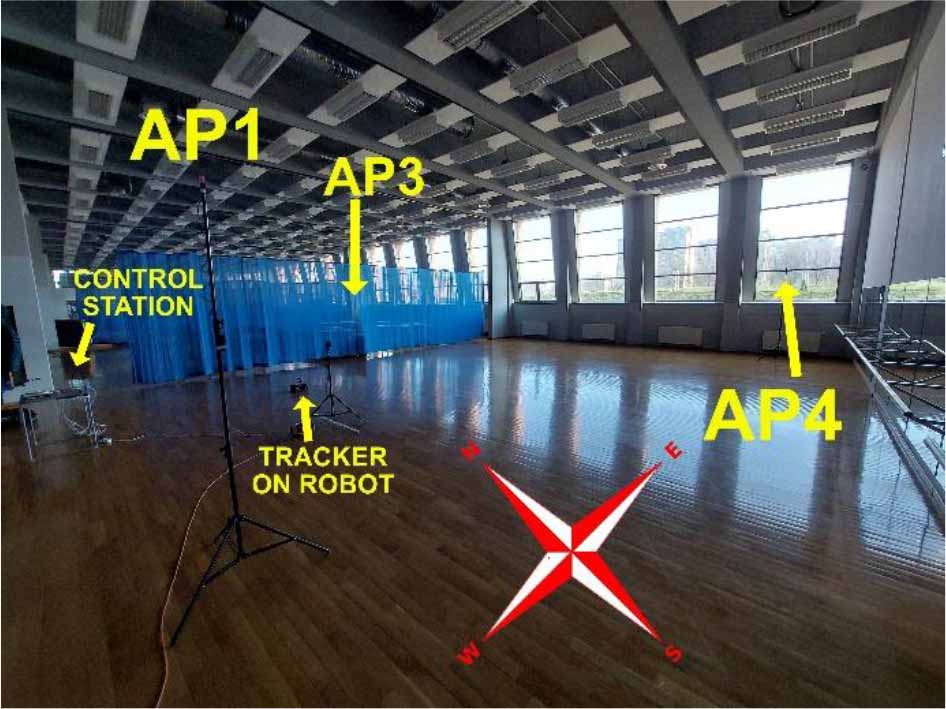
Fig. 3.
Equipment layout in 3D view
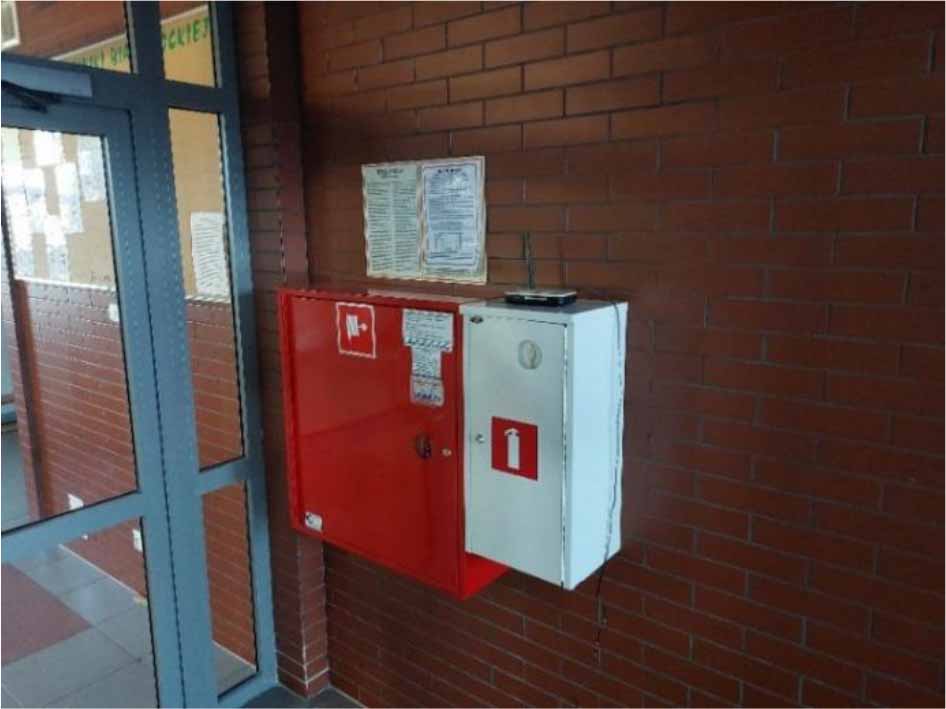
Fig. 4.
Wi-Fi router placed in the NLOS zone
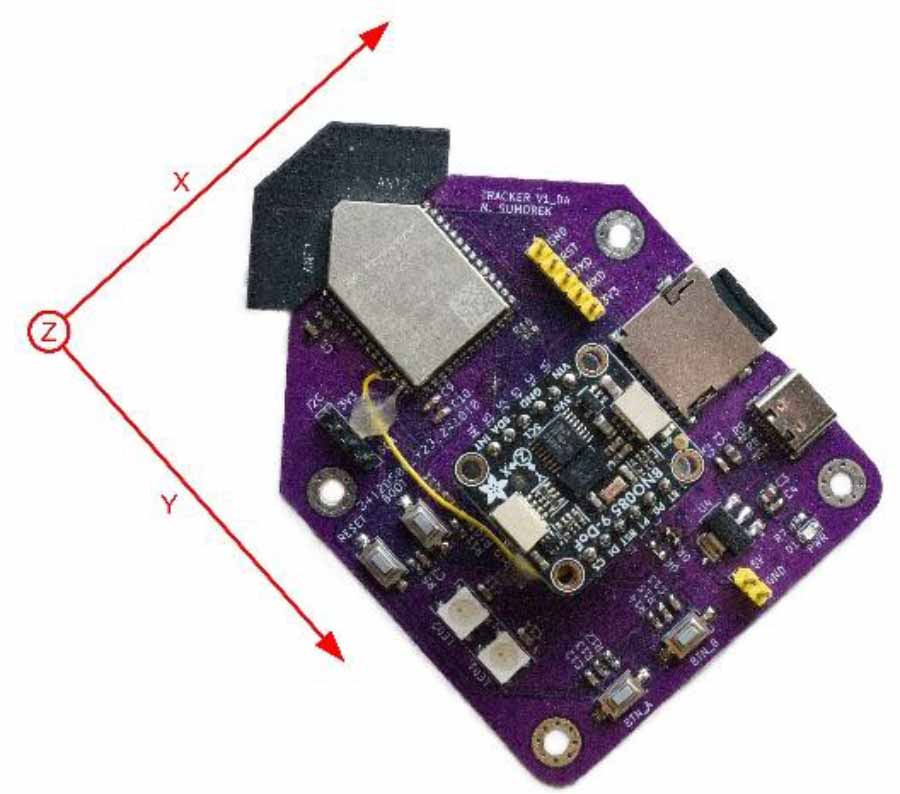
Fig. 5.
The tracker with the IMU orientation marked
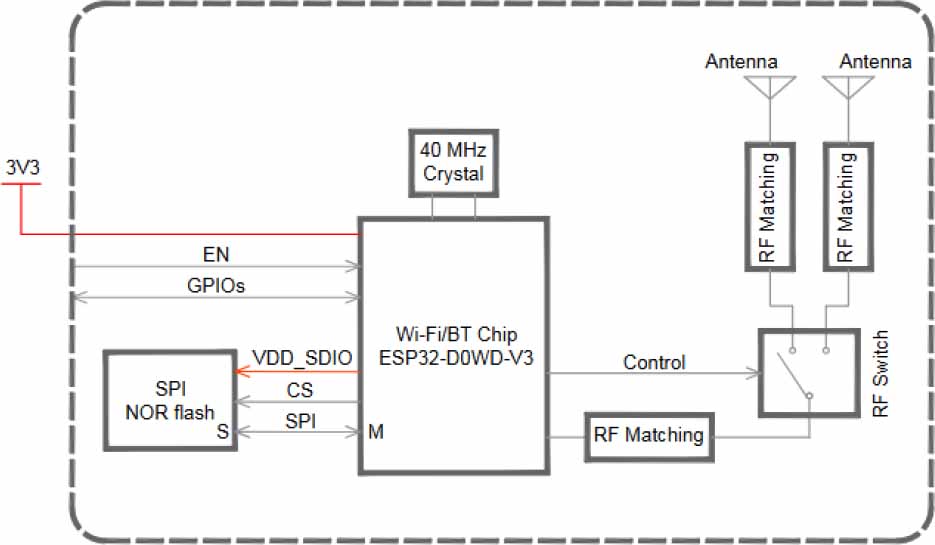
Fig. 6.
The internal structure of the ESP32-WROOM-DA system [16]
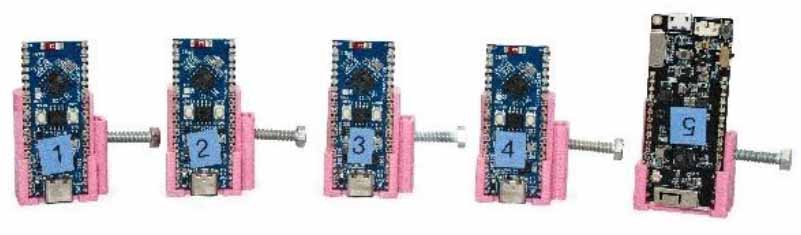
Fig. 7.
ESP32 units used as APs
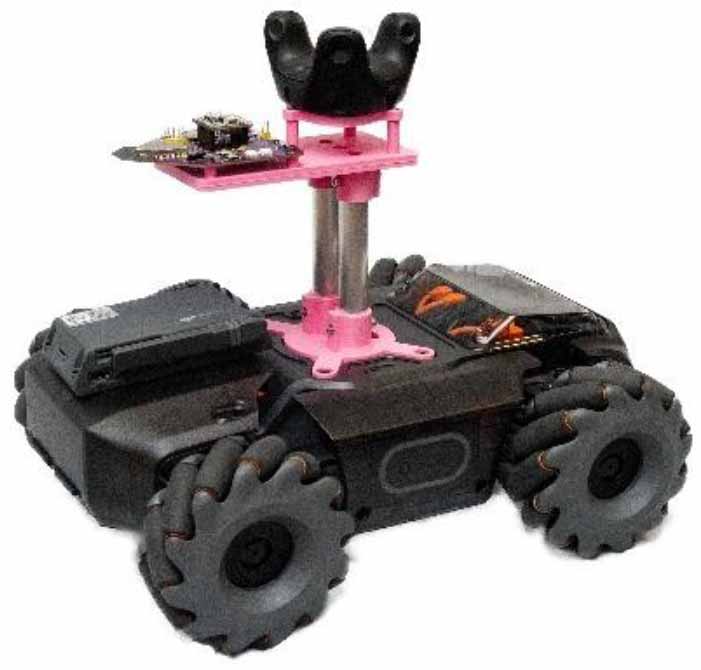
Fig. 8.
Robomaster S1 robot with tracker mounted
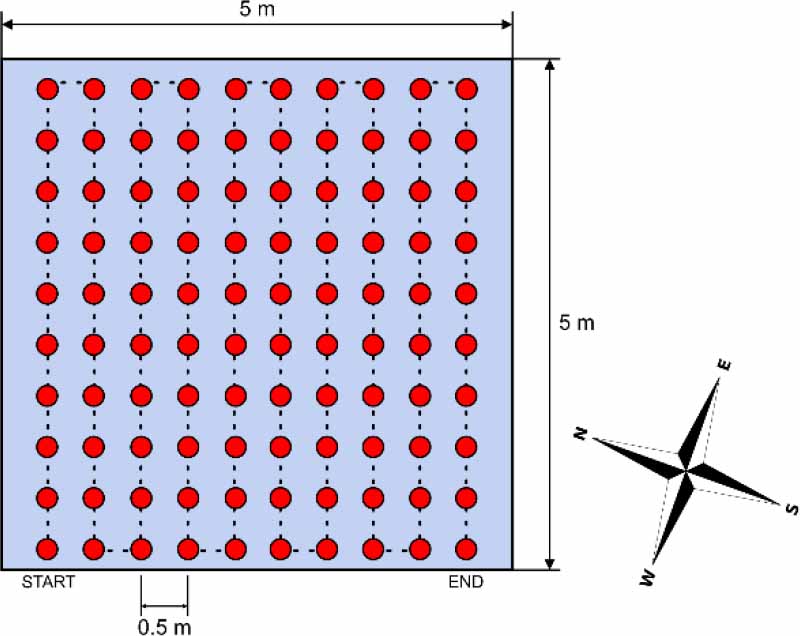
Fig. 9.
The measurement route of the training set with marked measurement locations
Tab. 1.
Quaternion mappings [17]
| BNO08X physical axis aligned | Mapping quaternion | |||||
|---|---|---|---|---|---|---|
| X | Y | Z | Qw | Qx | Qy | Qz |
| East | North | Up | 1 | 0 | 0 | 0 |
| North | West | Up | (√2)/2 | 0 | 0 | (√2)/2 |
| West | South | Up | 0 | 0 | 0 | 1 |
| South | East | Up | (√2)/2 | 0 | 0 | -(√2)/2 |
Tab. 2.
Number of classes in the training set and their percentage share in the set
| West | East | North | South |
|---|---|---|---|
| 256 | 199 | 184 | 97 |
| 34,8% | 27,0% | 25,0% | 13,2% |
Tab. 3.
Number of classes in the test set and their percentage share in the set
| West | East | North | South |
|---|---|---|---|
| 39 | 28 | 29 | 15 |
| 35,1% | 25,2% | 26,1% | 13,5% |
Tab. 4.
Metrics of individual classes for the k-NN model
| Class | Recall | Precision | F1 |
|---|---|---|---|
| ‘East’ | 0.46 | 0.41 | 0.43 |
| ‘North’ | 0.34 | 0.43 | 0.38 |
| ‘South’ | 0.13 | 0.33 | 0.19 |
| ‘West’ | 0.64 | 0.50 | 0.56 |
Tab. 5.
Metrics for the k-NN model
| Precision macro | Recall macro | F1 macro | Micro score | MCC |
|---|---|---|---|---|
| 0.42 | 0.40 | 0.39 | 0.45 | 0.23 |
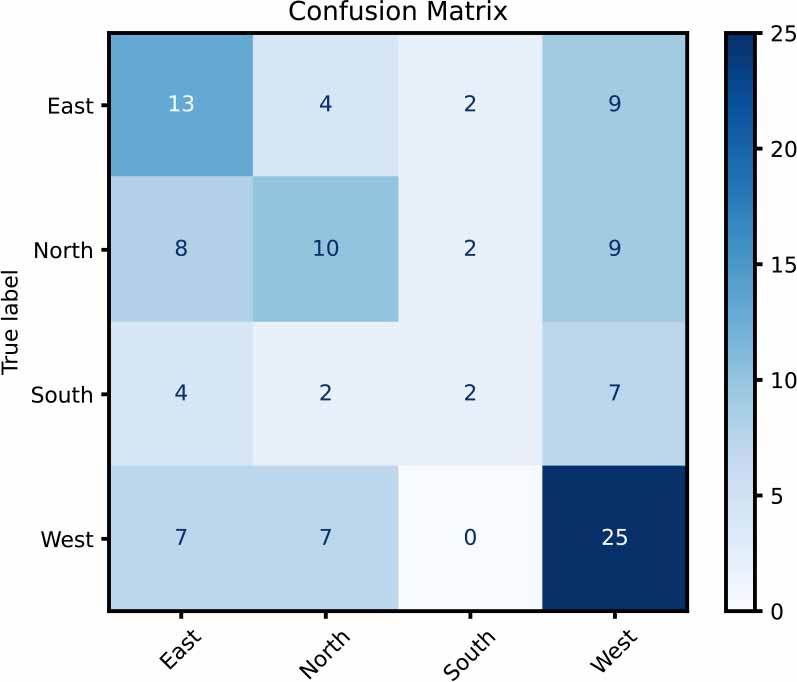
Fig. 10.
Confusion matrix for the k-NN model
Tab. 6.
Metrics of individual classes for the SVC model
| Class | Recall | Precision | F1 |
|---|---|---|---|
| ‘East’ | 0.46 | 0.42 | 0.44 |
| ‘North’ | 0.31 | 0.38 | 0.34 |
| ‘South’ | 0.27 | 0.22 | 0.24 |
| ‘West’ | 0.44 | 0.45 | 0.44 |
Tab. 7.
Metrics for the SVC model
| Precision macro | Recall macro | F1 macro | Micro score | MCC |
|---|---|---|---|---|
| 0.37 | 0.37 | 0.37 | 0.39 | 0.16 |
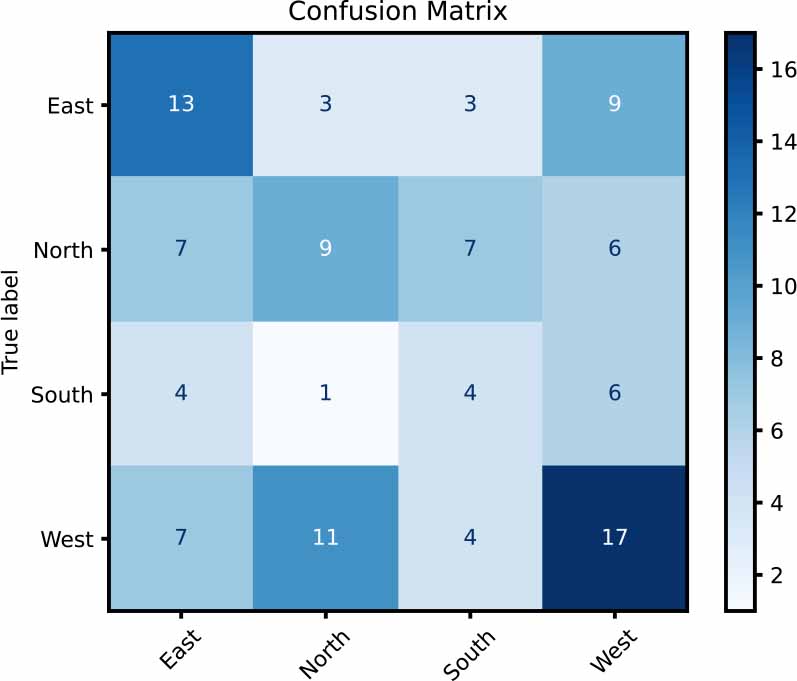
Fig. 11.
Confusion matrix for the SVM model
Tab. 8.
Class metrics for Random Forest Classifier
| Class | Recall | Precision | F1 |
|---|---|---|---|
| ‘East’ | 0.50 | 0.37 | 0.42 |
| ‘North’ | 0.24 | 0.39 | 0.30 |
| ‘South’ | 0.00 | 0.00 | 0.00 |
| ‘West’ | 0.62 | 0.47 | 0.53 |
Tab. 9.
Class metrics for Random Forest Classifier
| Precision macro | Recall macro | F1 macro | Micro score | MCC |
|---|---|---|---|---|
| 0.31 | 0.34 | 0.31 | 0.41 | 0.16 |
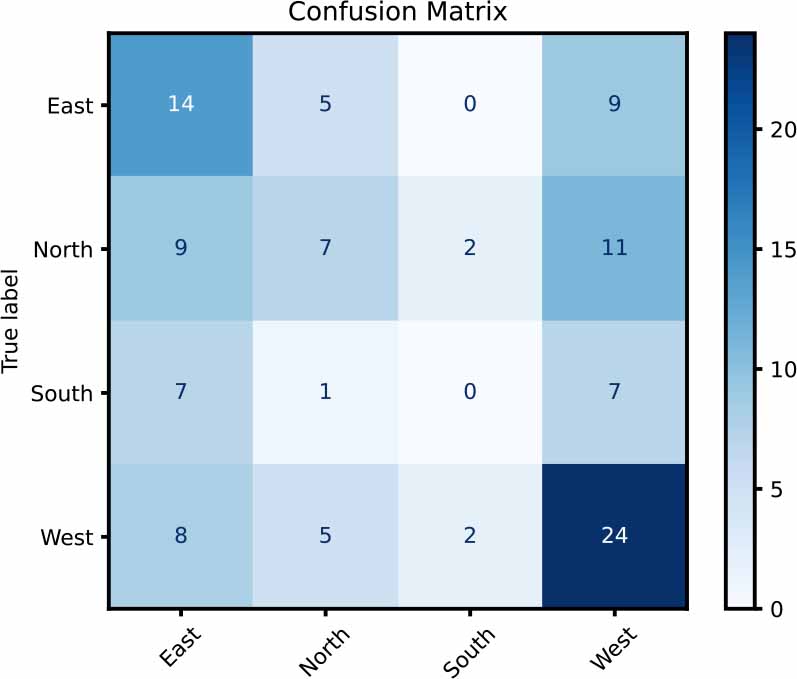
Fig. 12.
Confusion matrix for the Random Forest model
Tab. 10.
Class metrics for MLP Classifier
| Class | Recall | Precision | F1 |
|---|---|---|---|
| ‘East’ | 0.54 | 0.39 | 0.45 |
| ‘North’ | 0.34 | 0.40 | 0.37 |
| ‘South’ | 0.13 | 0.20 | 0.16 |
| ‘West’ | 0.46 | 0.47 | 0.47 |
Tab. 11.
Class metrics for MLP Classifier
| Precision macro | Recall macro | F1 macro | Micro score | MCC |
|---|---|---|---|---|
| 0.37 | 0.37 | 0.36 | 0.41 | 0.18 |
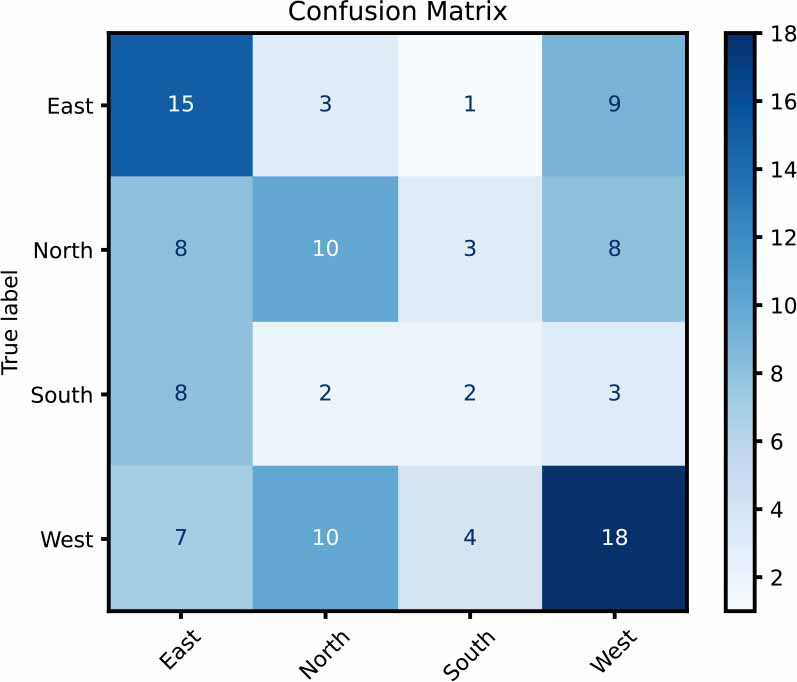
Fig. 13.
Confusion matrix for the MLP Classifier model