
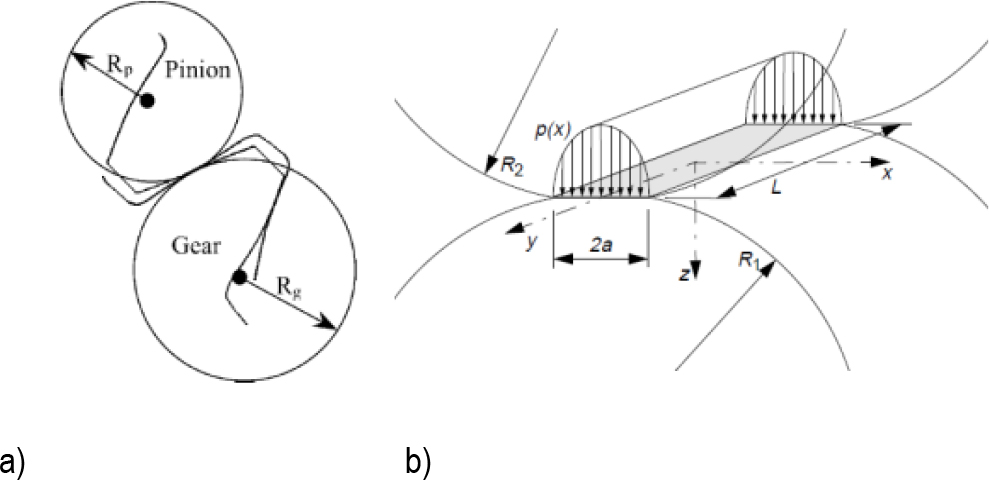
Fig. 1.
Cylinders simulate two gear teeth in an RCF test (a), and Hertzian contact between two rollers(b) [15]
Tab.1.
Chemical composition of commercially available (Cr-Mo) and newly developed Ni-doped Cr-Mo alloy (Cr-Mo-1.55 Ni)
| Chemical composition mass (%) | ||||||||||
|---|---|---|---|---|---|---|---|---|---|---|
| C | P | S | Si | Mn | Cr | Ni | M o | C u | Bal | |
| Cr-Mo | 0.21 | 0.0 02 | 0.0 03 | 0.25 | 0.6 5 | 1.1 5 | 0.2 2 | 0.2 1 | 0.1 8 | 97.12 |
| Cr-Mo-1.55 Ni | 0.18 | 0.0 02 | 0.0 03 | 0.24 | 0.6 5 | 1.1 3 | 1.5 5 | 0.2 1 | 0.1 8 | 95.85 |
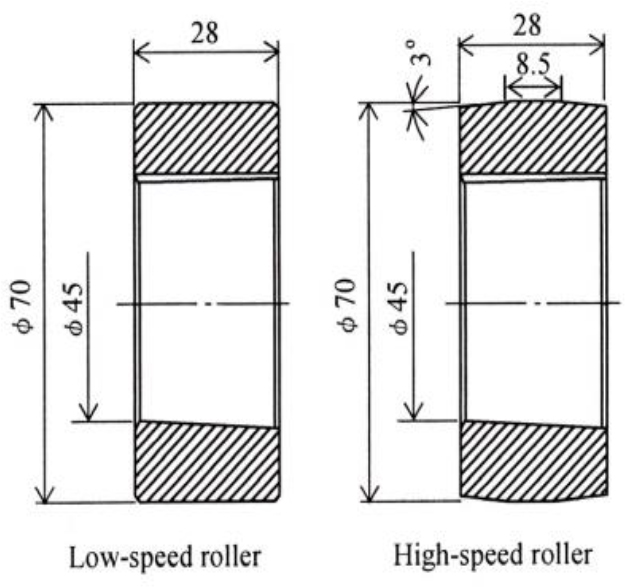
Fig. 2.
Dimension of test discs [27]
Tab. 2.
SAE90 lubricant property
| Parameter | Value |
|---|---|
| Kinematic viscosity @40 °C | 155 |
| Kinematic viscosity @100 °C | 15.5 |
| Density | 7.28 lbs/gal |
| Specific gravity | 0.875 |
Tab. 3.
Parameters during the run-in and RCF Experiment
| Test Stages | Description | High-speed disc(rpm) | Low-speed disc (rpm) | Slip ratio | SRR |
|---|---|---|---|---|---|
| K3, K6, k8 & k9 | Run-in & RCF | 2800 | 1400 | -1 & 0.5 | 0.66 |
Tab.4.
Load stages on RCF Experiment
| Load stage | Normal force (N) | Hertzian pressure (Mpa) | Half pressure width (mm) | Load sub-stage | No_Cyles for high speed *10^3 | No_Cyles for low speed *10^3 | Time need (hr) | Oil To |
|---|---|---|---|---|---|---|---|---|
| K3 | 1090.8 | 514 | 0.159 | K3-1 | 20 | 10 | 7.15’ | 80 |
| K3-2 | 60 | 30 | 21.428’ | |||||
| K3-3 | 100 | 50 | 35.714’ | |||||
| K6 | 3749.7 | 953 | 0.295 | K6-1 | 200 | 100 | 71.428’ | 90 |
| K6-2 | 800 | 400 | 4.762hr | |||||
| K6-3 | 1880 | 940 | 11.191hr | |||||
| K8 | 6513.131 | 1256 | 0.388 | K8-1 | 200 | 100 | 71.428’ | 90 |
| K8-2 | 800 | 400 | 4.762hr | |||||
| K8-3 | 1880 | 940 | 11.191hr | |||||
| K9 | 8184.95 | 1408 | 0.435 | K9-1 | 2880 | 1440 | 17.143 hrs | 90 |
| Total | 8820 | = 4,410 | 52.5 hrs | |||||
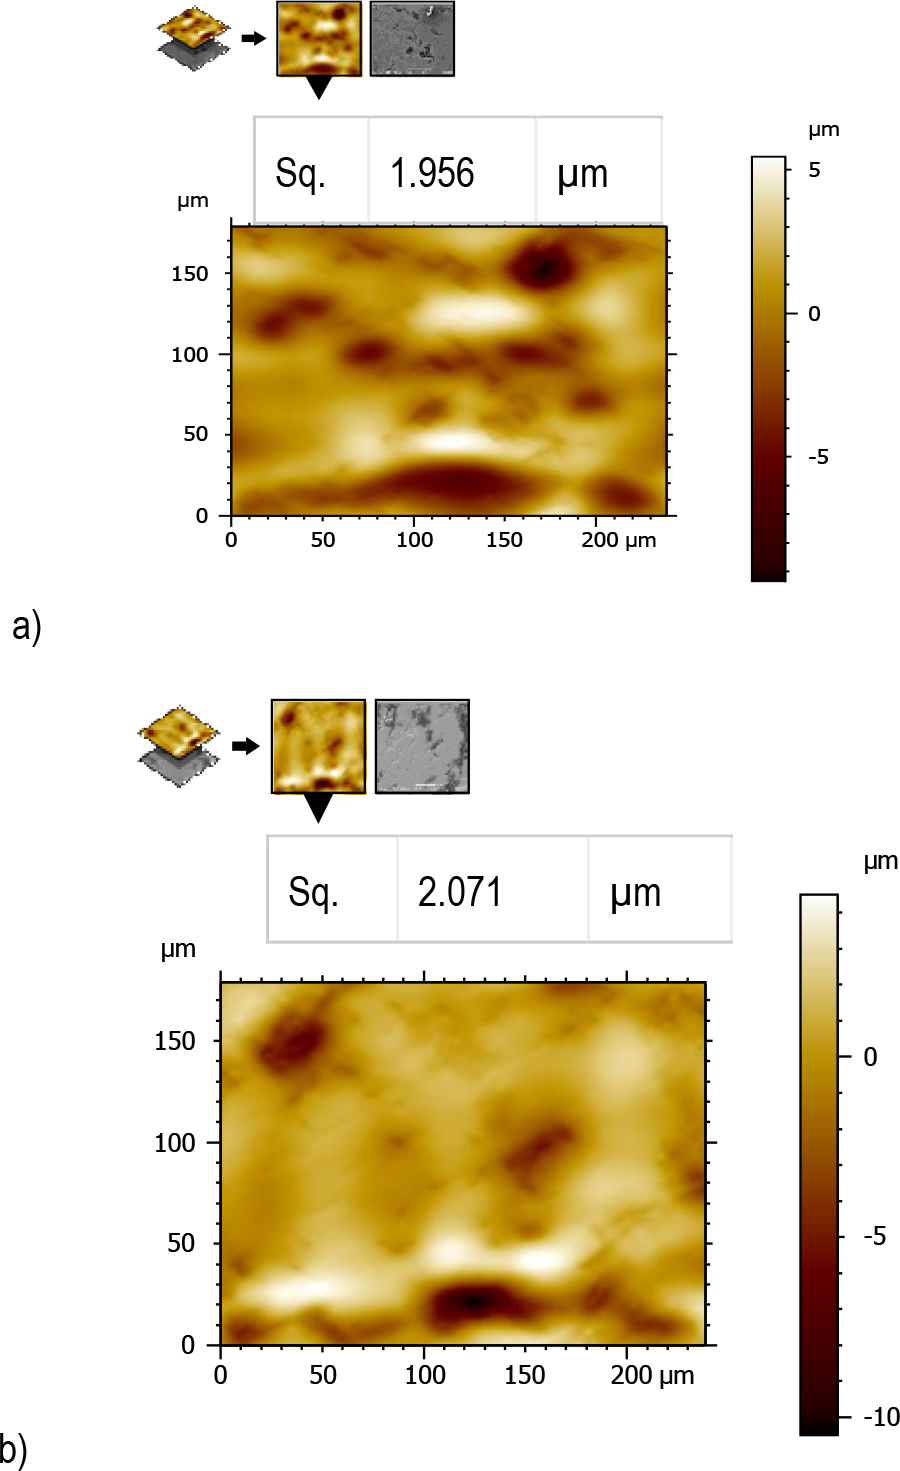
Fig. 3.
High-speed disc Surface map of Cr-Mo alloy steel (a), and low-speed disc (b)
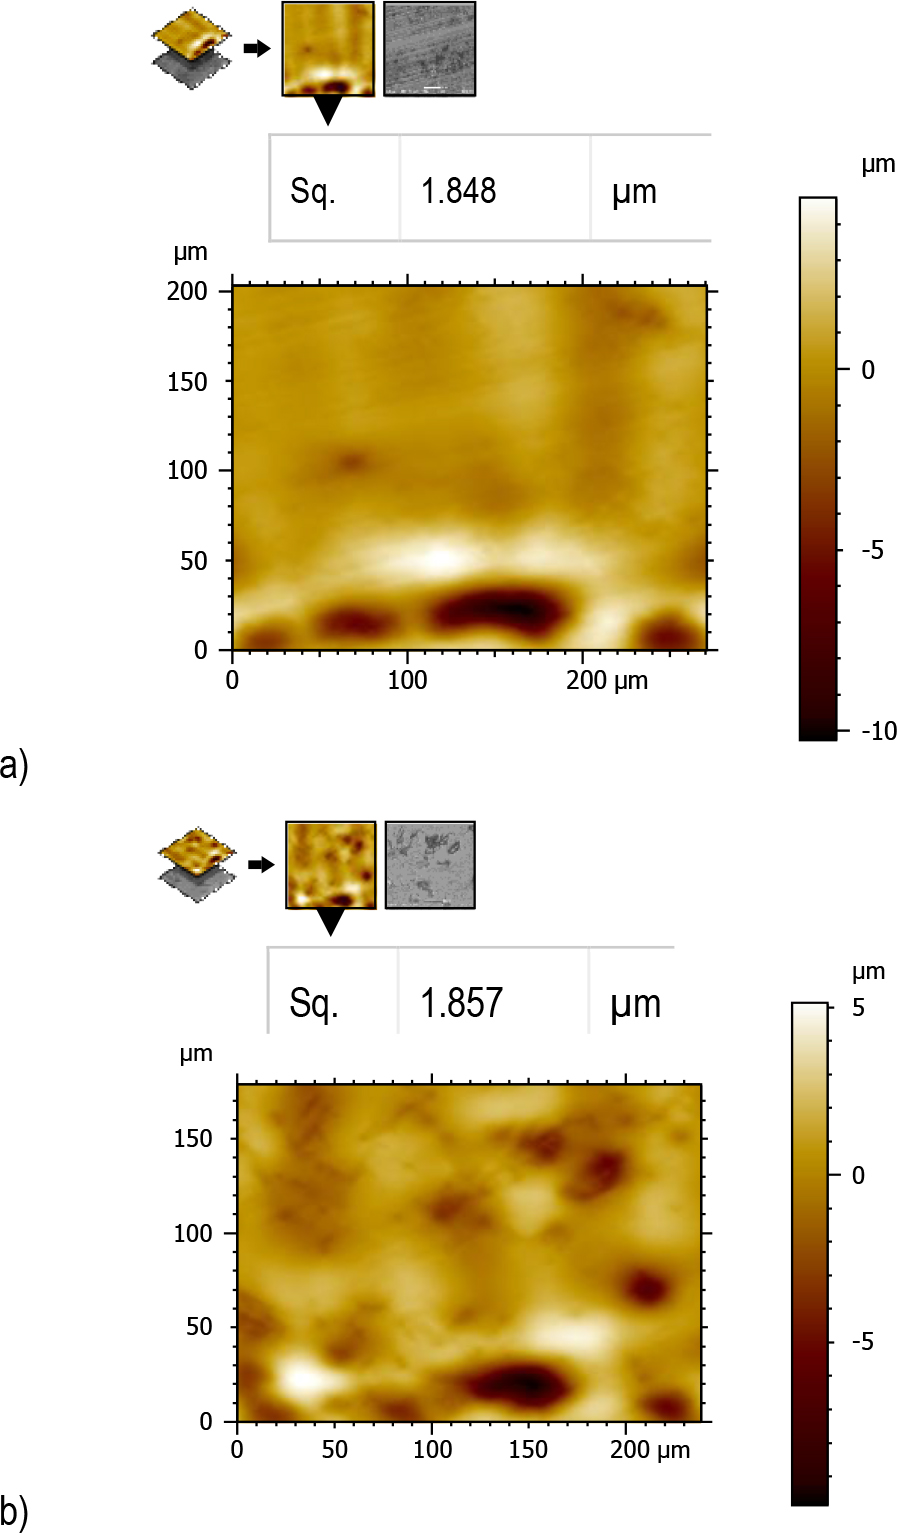
Fig. 4.
Surface map of Ni-doped Cr-Mo alloy steel (a), and high-speed disc after low-speed disc (b)
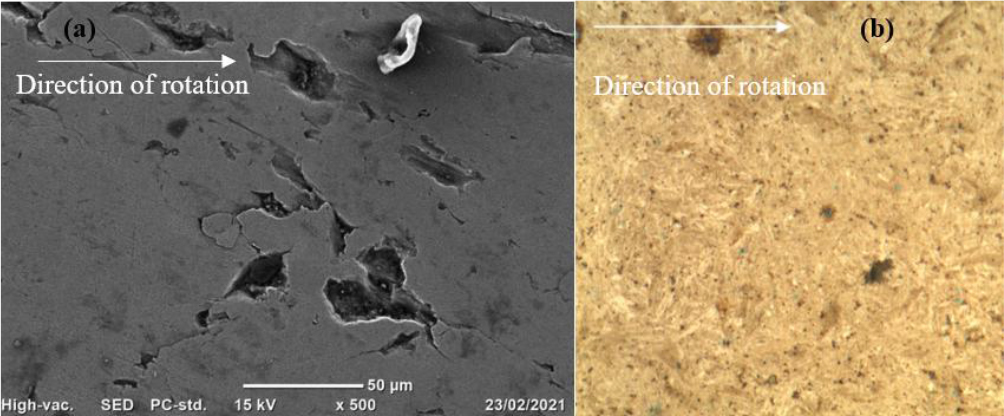
Fig. 5.
High-speed Cr-Mo alloy steel after RCF test, (a) SEM Micrograph and (b) OM Micrograph
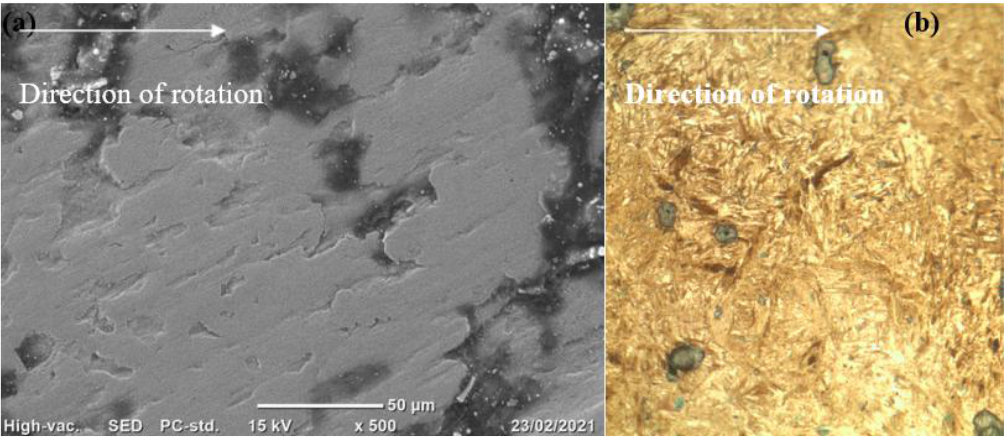
Fig. 6.
Low-speed Cr-Mo alloy steel after RCF test, (a) SEM Micrograph, and (b) OM Micrograph
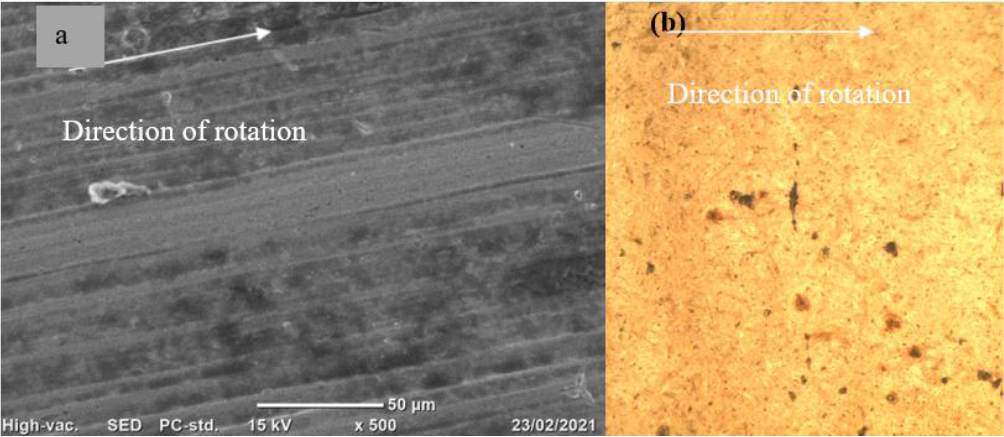
Fig. 7.
High-speed Ni-doped Cr-Mo alloy steel after RCF test (a) SEM Micrograph, and (b) OM Micrograph
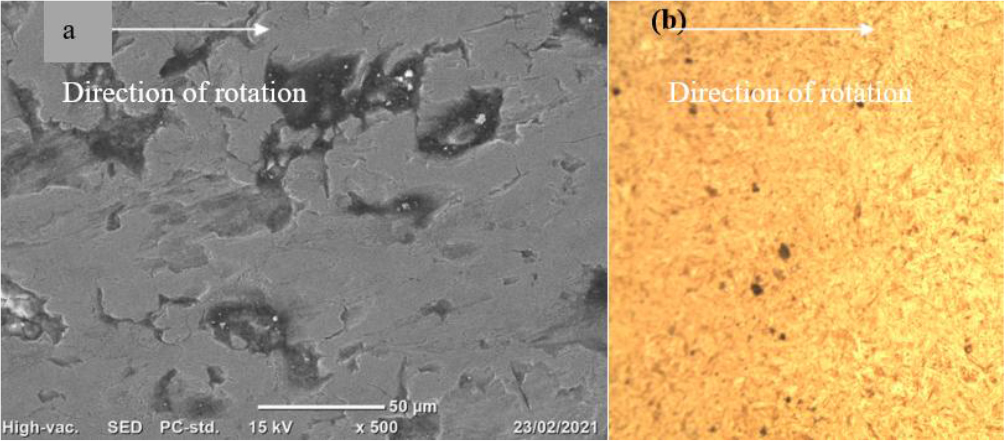
Fig. 8.
Low-speed Ni-doped Cr-Mo alloy steel after RCF, (a) SEM Micrograph, and (b) OM Micrograph
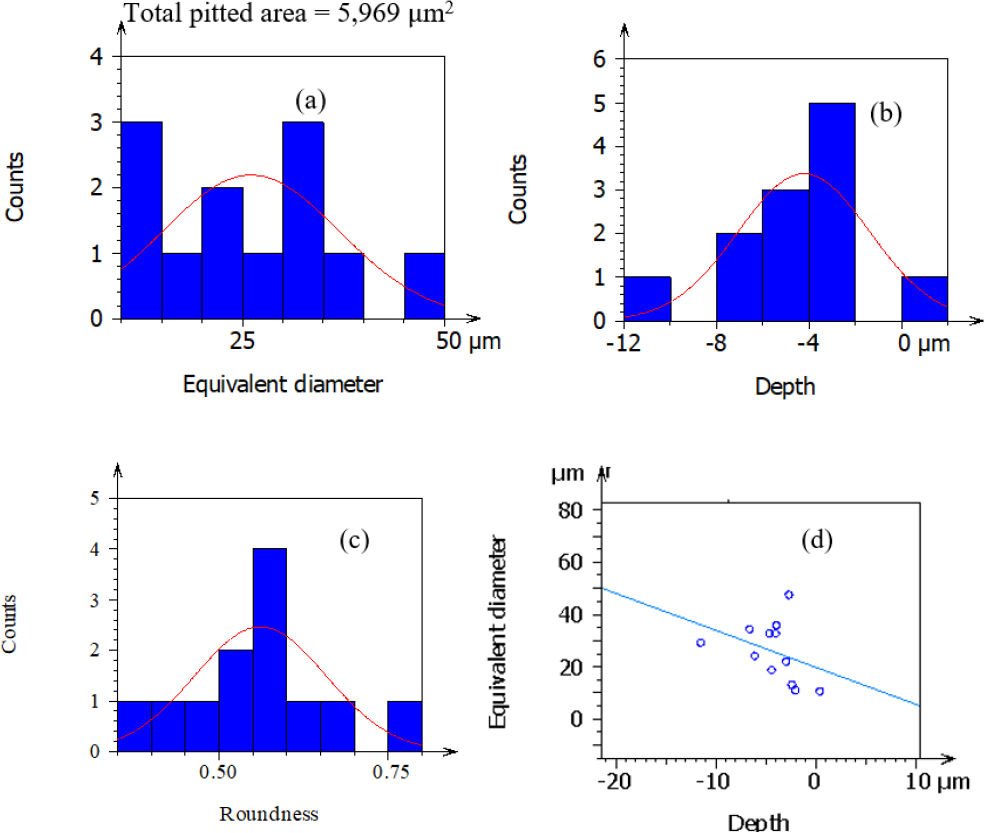
Fig. 9.
Ni-doped Cr-Mo alloy steel of low-speed micropits (a) equivalent diameter, (b) depth, (c) shape, (d) correlation b/n micropits depth and micropits equivalent diameter
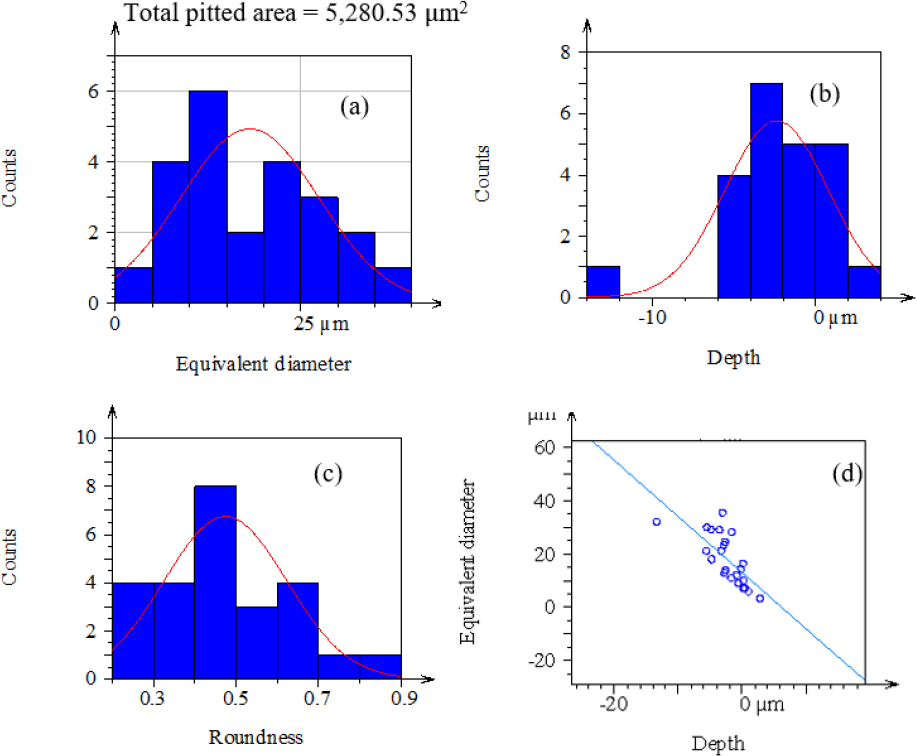
Fig. 10.
Ni-doped Cr-Mo alloy steel of high-speed micropits (a) equivalent diameter, (b) depth, (c) shape, (d) correlation b/n micropits depth and micropits equivalent diameter
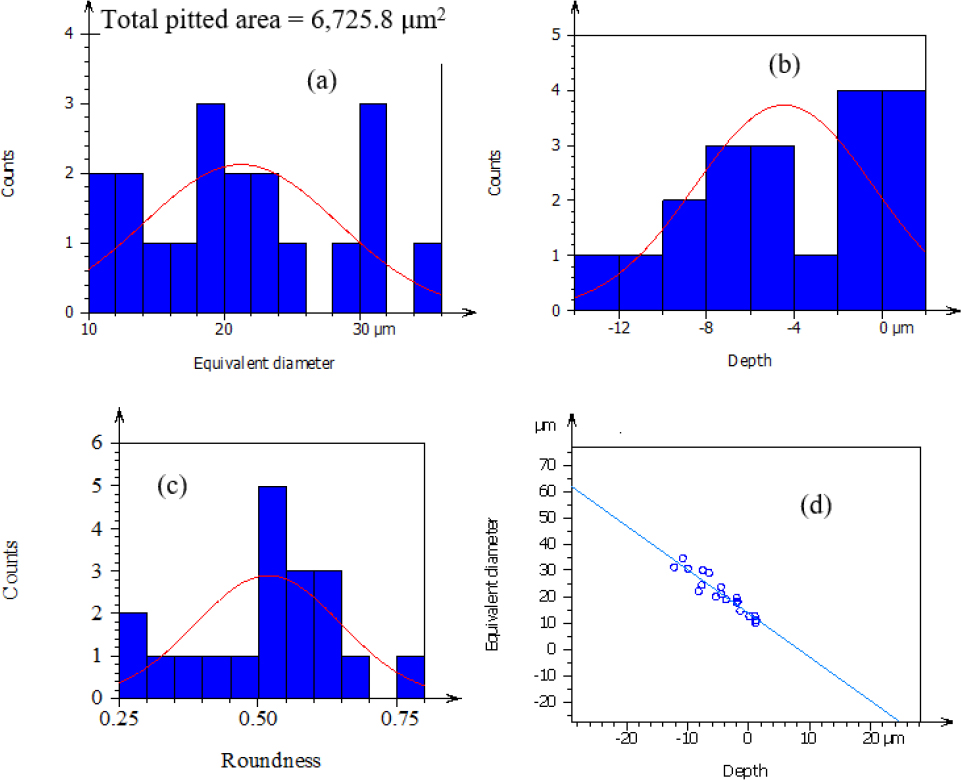
Fig. 11.
Cr-Mo alloy steel of low-speed micropits (a) equivalent diameter, (b) depth, (c) shape, (d) correlation b/n micropit depth and micropit equivalent diameter
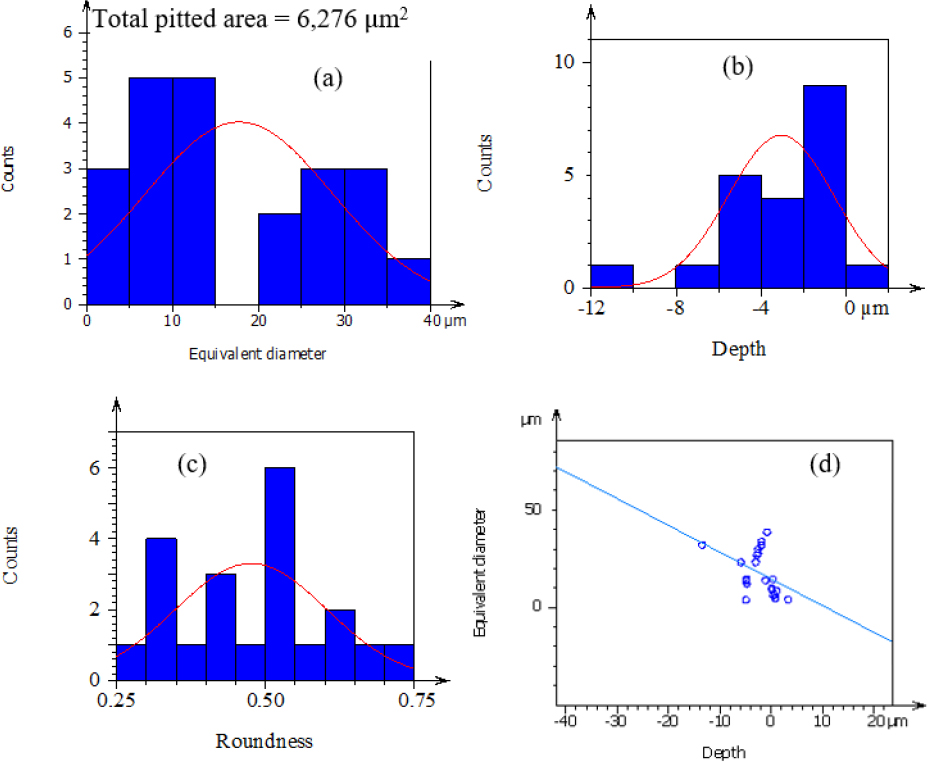
Fig. 12.
Cr-Mo alloy steel of high-speed micropits of (a) equivalent diameter, (b) depth, (c) shape, (d) correlation b/n micropit depth and micropit equivalent diameter
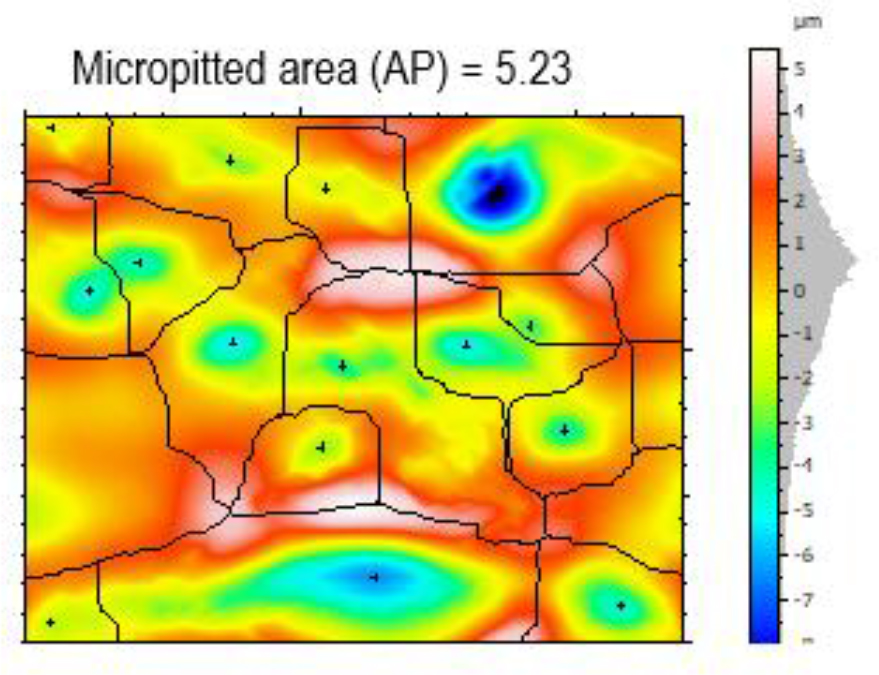
Fig.13.
Evaluation of Surface damage of Cr-Mo alloy high-speed disc
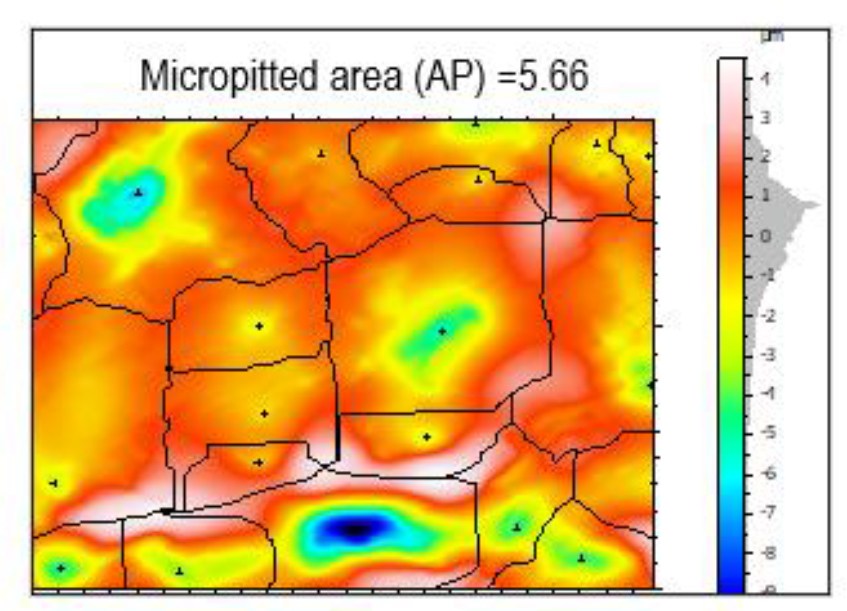
Fig. 14.
Evaluation of Surface damage of Cr-Mo alloy low-speed disc
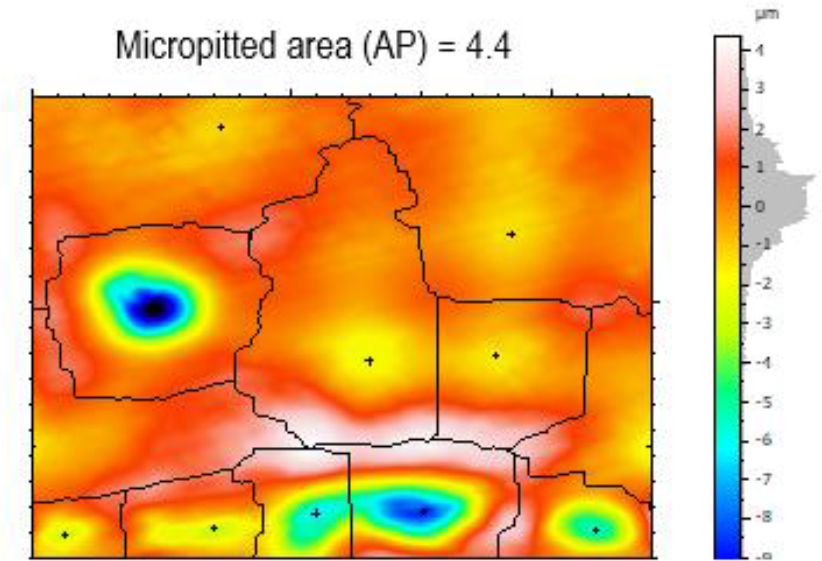
Fig. 15.
Evaluation of Surface damage of Ni-doped Cr-Mo alloy steel of high-speed disc
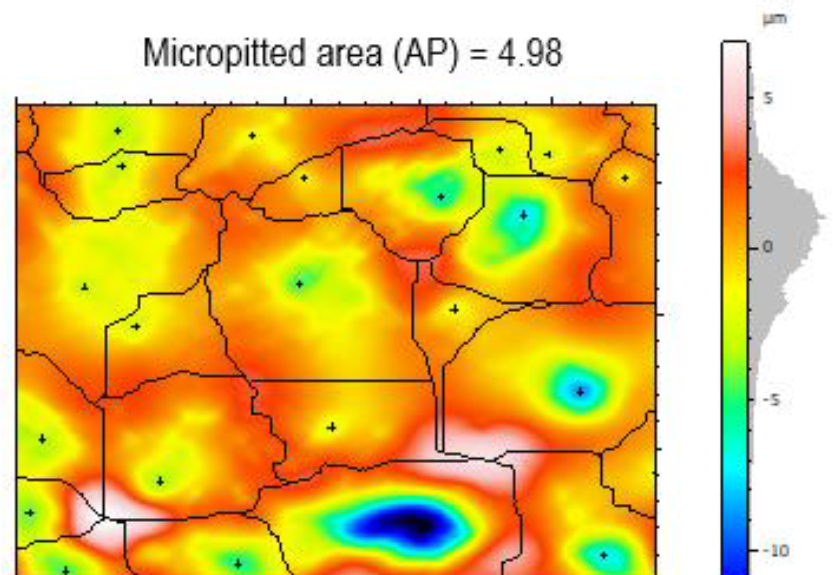
Fig. 16.
Evaluation of Surface damage of Ni-doped Cr-Mo alloy steel of low-speed disc