
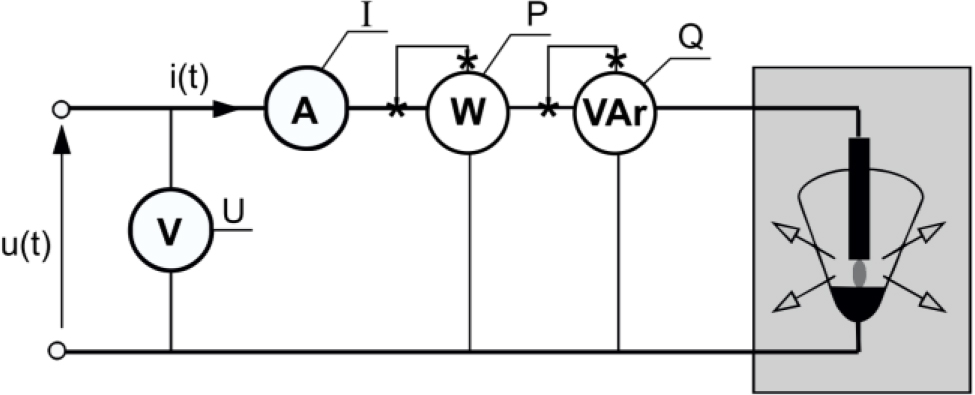
Fig. 1.
Arc lamp circuit [16]
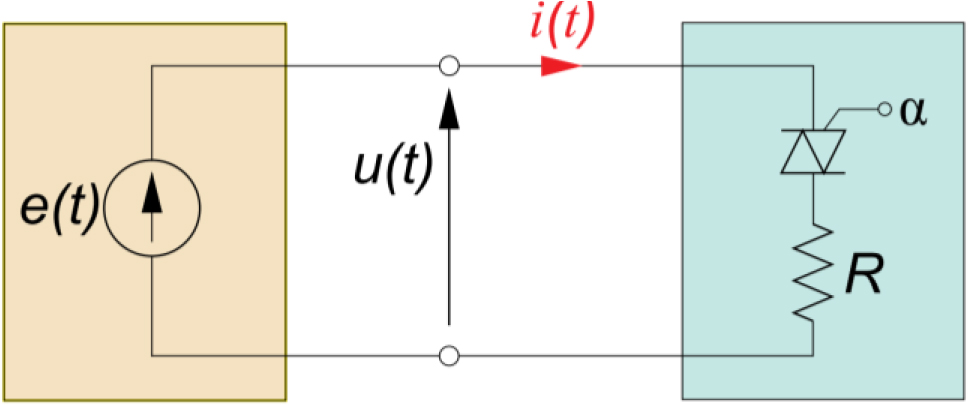
Fig. 1.
Purely resistive circuit with TRIAC [17]
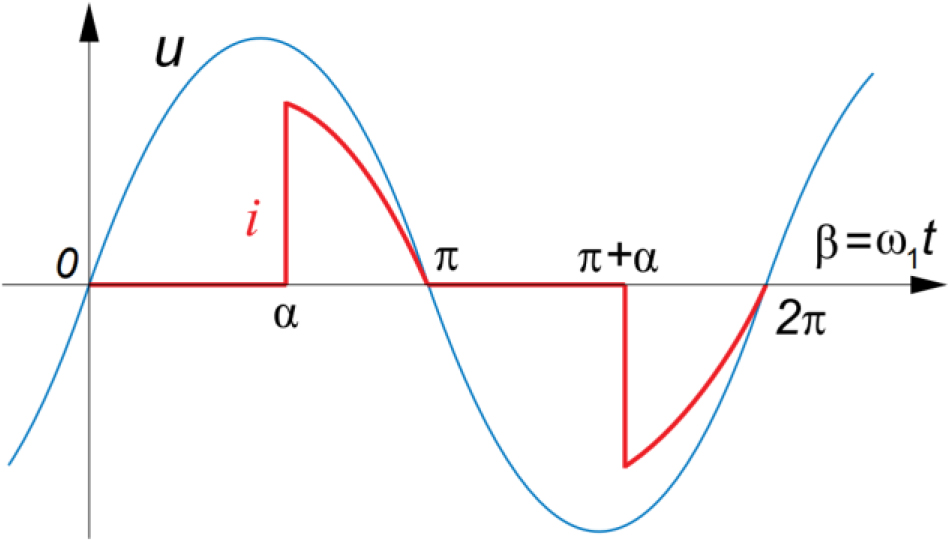
Fig. 2.
Current waveform in the circuit with TRIAC [17]
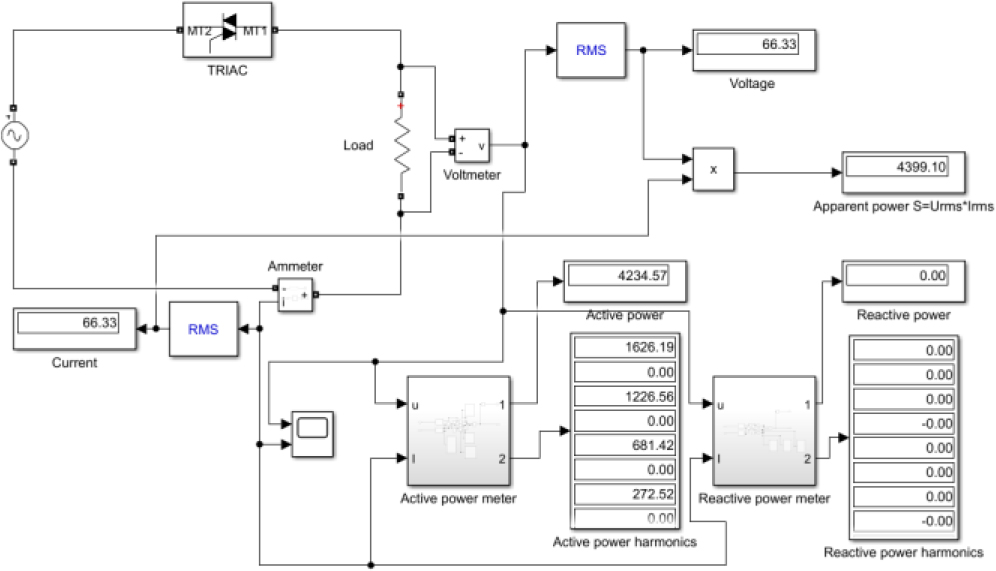
Fig. 3.
Circuit diagram in MATLAB-Simulink application
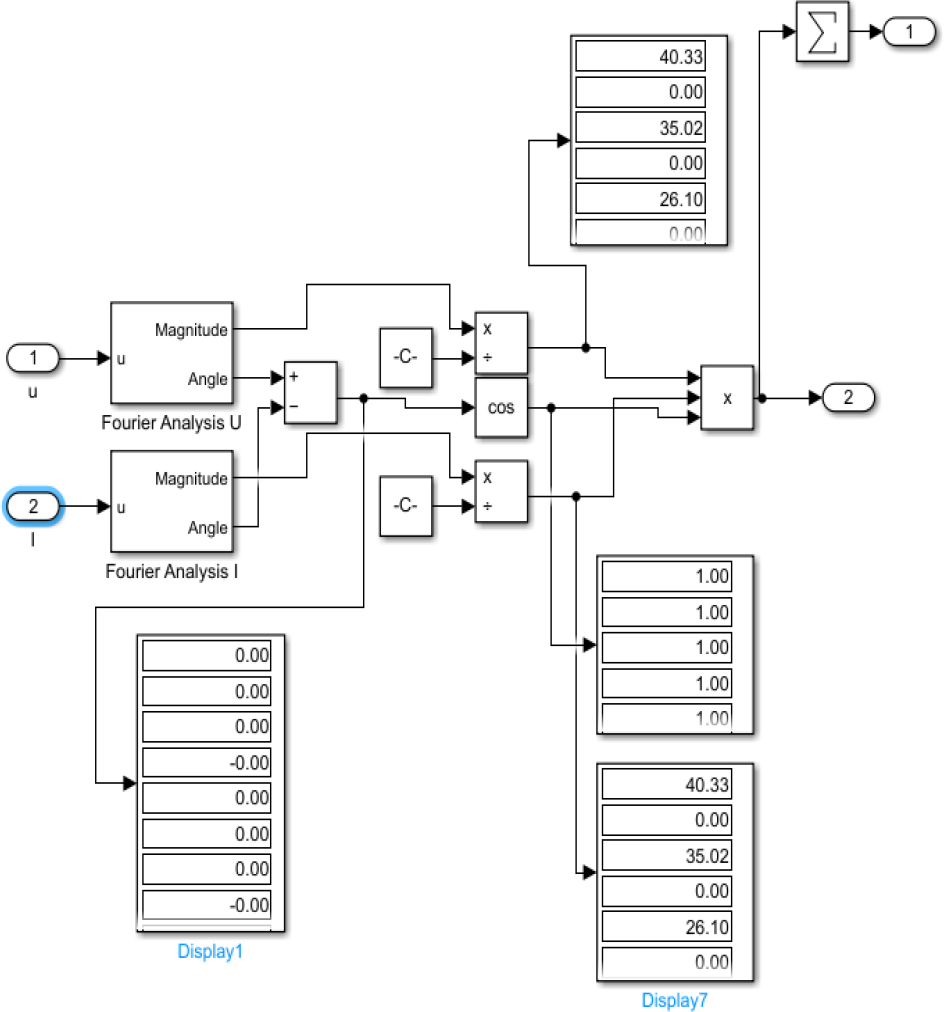
Fig. 4.
MATLAB-Simulink active power meter diagram
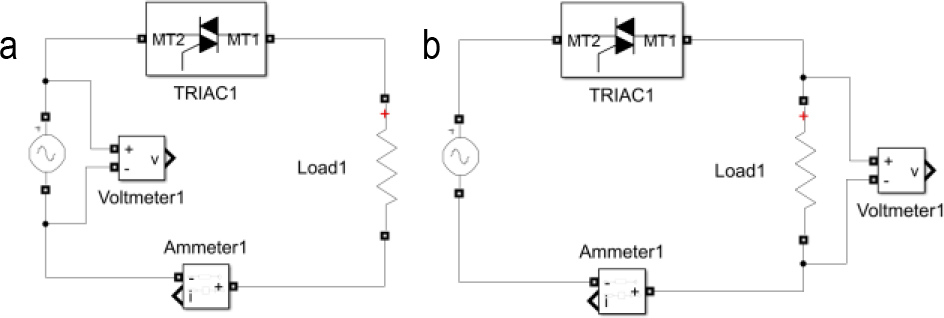
Fig. 5.
Connection diagrams a) supply voltage measurement b) voltage measurement at the receiver
Tab. 1.
Simulation results table
| Circuit type | TRIAC firing angle | Active power | Reactive power | Apparent power | power factor | Voltage | Current |
|---|---|---|---|---|---|---|---|
| ⸰ | kW | kVar | kVA | V | A | ||
| a | 0 | 48.4 | 0 | 48.4 | 1 | 220 | 220 |
| b | 0 | 48.4 | 0 | 48.4 | 1 | 220 | 220 |
| a | 90 | 24.2 | 15.4 | 34.2 | 0.71 | 220 | 155.6 |
| b | 90 | 23.8 | 0 | 24.2 | 1 | 155.6 | 155.6 |
| a | 135 | 4.4 | 7.7 | 14.6 | 0.3 | 220 | 66.3 |
| b | 135 | 4.23 | 0 | 4.4 | 1 | 66.3 | 66.3 |
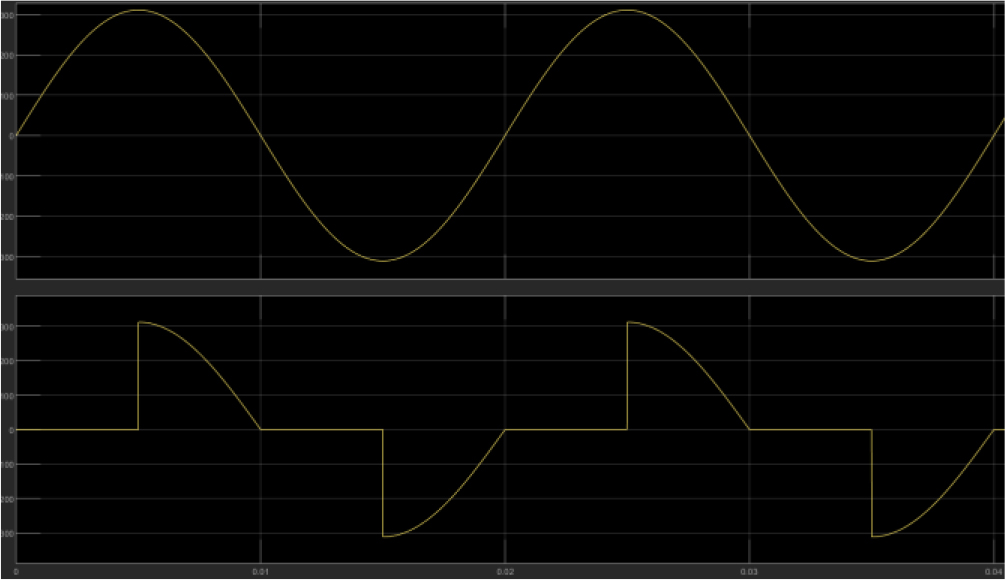
Fig. 6.
Voltage and current waveform for the TRIAC firing angle of 90° incircuit a)
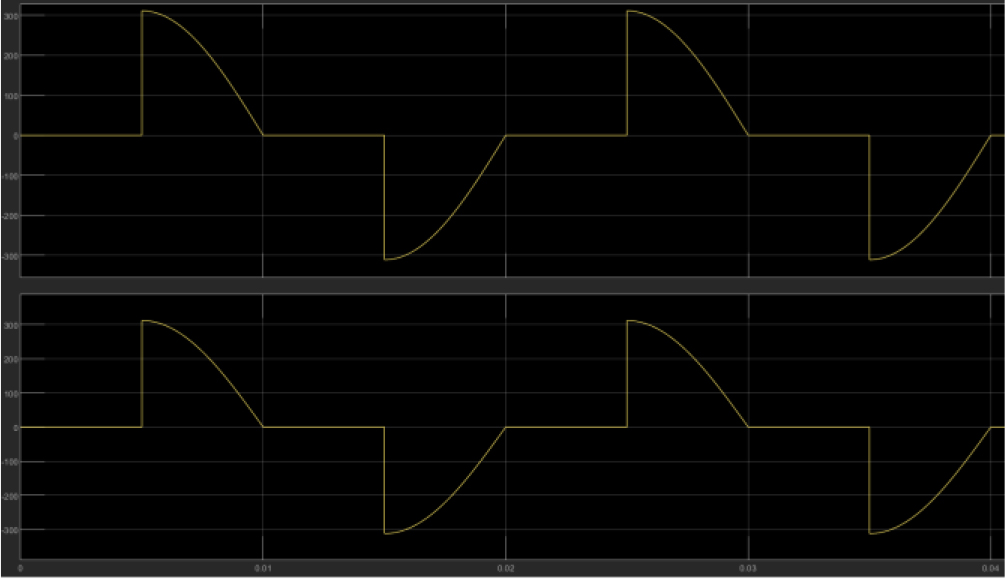
Fig. 7.
Voltage and current waveform for the TRIAC firing angle of 90°in circuit b)
Tab. 2.
Real object results table
| Circuit type | TRIAC firing angle | Active power | Reactive power | Apparent power | power factor | Voltage | Current |
|---|---|---|---|---|---|---|---|
| ⸰ | W | Var | VA | V | mA | ||
| a | 0 | 43.1 | 0 | 43.1 | 1 | 103 | 420 |
| b | 0 | 43.1 | 0 | 43.1 | 1 | 103 | 420 |
| a | 90 | 20.9 | 21.1 | 29.7 | 0.71 | 102.8 | 288.9 |
| b | 90 | 19.4 | 0 | 19.4 | 1 | 67.6 | 286.3 |
| a | 135 | 4.2 | 12.9 | 13.5 | 0.31 | 102.8 | 131.6 |
| b | 135 | 4 | 0 | 4 | 1 | 30.7 | 129.9 |
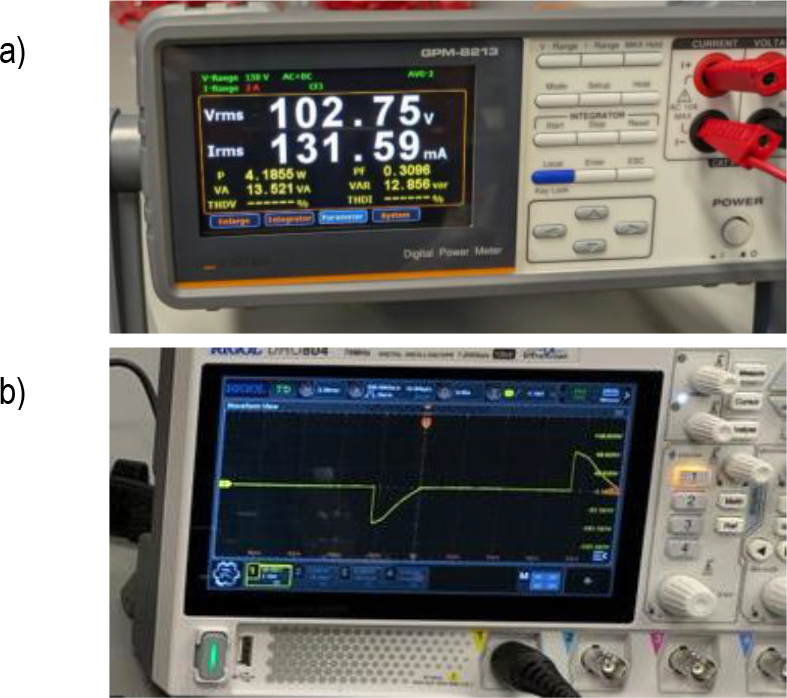
Fig. 8.
Real object test results: a) power and power factor measurement, b) signal waveform on a resistive load