
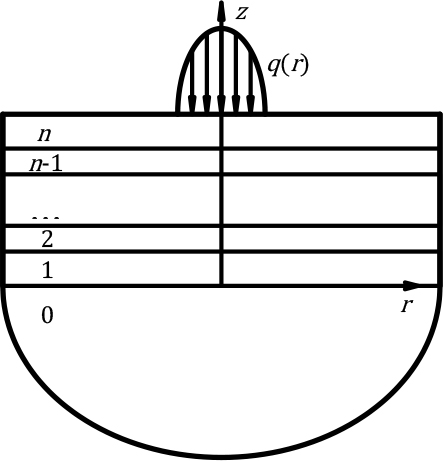
Fig. 1.
The scheme of considered problem
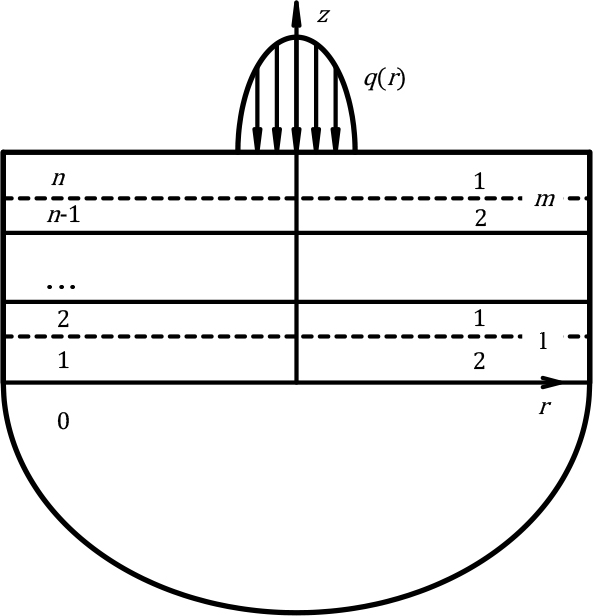
Fig. 2.
The scheme of considered problem
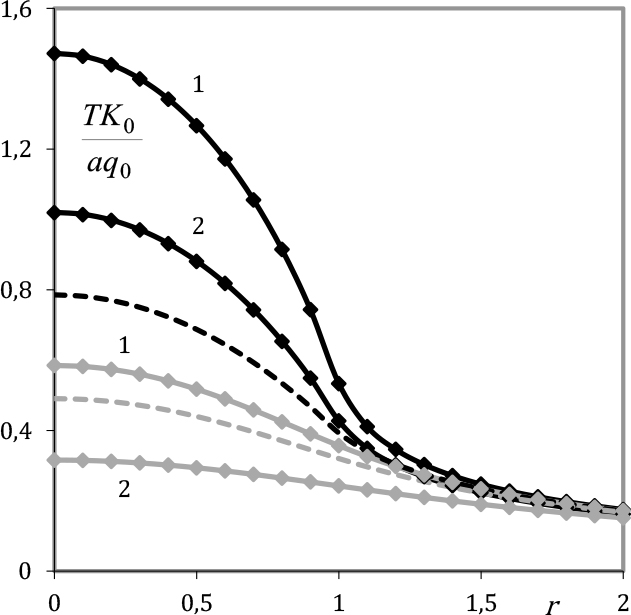
Fig. 3.
Distributions of the temperature over the surface z = h (black lines and rhombi) and over z = 0 (grey lines and rhombi), dashed lines – the distributions of the temperature for the homogeneous half-space: 1 – κ2 = 1; 2 – κ2 = 5; n = 20
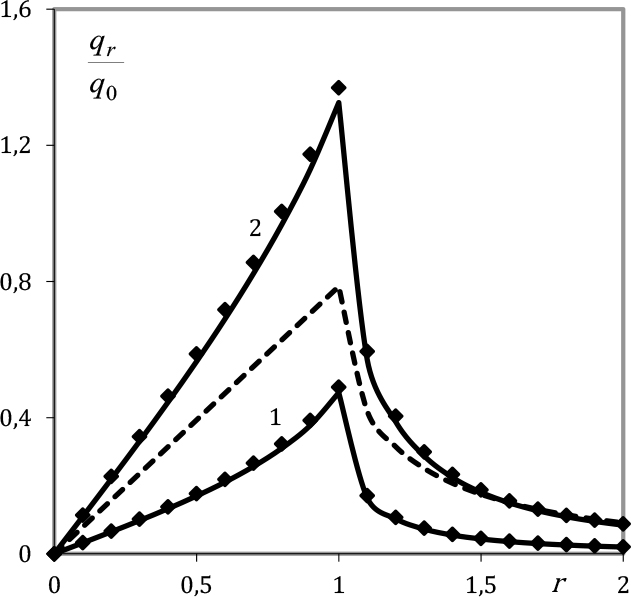
Fig. 4.
Distributions of the radial heat flux along the surface z = h, dashed line – the distributions of the radial heat flux for the homogeneous half-space: 1 – κ2 = 1; 2 – κ2 = 5; n = 20.
Tab. 1.
Dependence of the dimensionless parameters , , on the dimensionless parameter κ2and number of the layers n
| κ2 | n | εTsur,% | εTint,% | εqsur,% | |||
|---|---|---|---|---|---|---|---|
| 1 | ∞ | 1.4723 | 0.5847 | 0.4733 | |||
| 160 | -0.0011 | -0.0002 | 0.5103 | ||||
| 80 | -0.0036 | -0.0007 | 0.9445 | ||||
| 40 | -0.0135 | -0.0028 | 1.7952 | ||||
| 20 | -0.0537 | -0.0113 | 3.4317 | ||||
| 10 | -0.2146 | -0.0451 | 6.5039 | ||||
| 5 | ∞ | 1.0200 | 0.3158 | 13256 | |||
| 160 | -0.0017 | -0.0007 | 0.4731 | ||||
| 80 | -0.0064 | -0.0017 | 0.9078 | ||||
| 40 | -0.0252 | -0.0054 | 1.7408 | ||||
| 20 | -0.1005 | -0.0204 | 3.2928 | ||||
| 10 | -0.4007 | -0.0799 | 6.0922 |
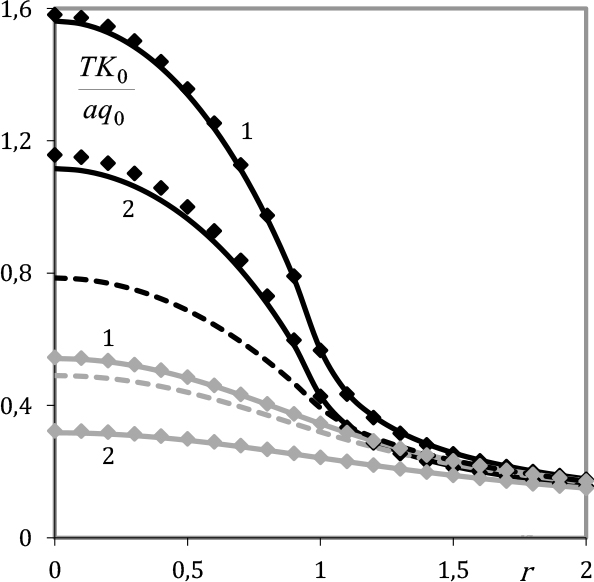
Fig. 5.
Distributions of the temperature over the plane z = h (black lines and rhombi) and over the plane z = 0 (grey lines and rhombi), dashed lines – the distributions of the temperature for the isotropic homogeneous half-space with the heat conductivity coefficient K0: 1 – K2/K0 = 1; 2 – K2/K0 = 5 ; m = 10
Tab. 2.
Dependence of the dimensionless parameters , on the dimensionless parameter K2/K0 and number of the representative cells m
| K2/K0 | m | εTsur,% | εTint,% | ||
|---|---|---|---|---|---|
| 1 | ∞ | 1.5630 | 0.5420 | ||
| 80 | 0.1613 | 0.0992 | |||
| 40 | 0.3173 | 0.1965 | |||
| 20 | 0.6171 | 0.3854 | |||
| 10 | 1.1698 | 0.7407 | |||
| 5 | 2.1096 | 1.3661 | |||
| 5 | ∞ | 1.1164 | 0.3217 | ||
| 80 | 0.4999 | 0.2566 | |||
| 40 | 0.9858 | 0.5106 | |||
| 20 | 1.9225 | 0.9844 | |||
| 10 | 3.6628 | 2.0010 | |||
| 5 | 6.6678 | 3.8612 |
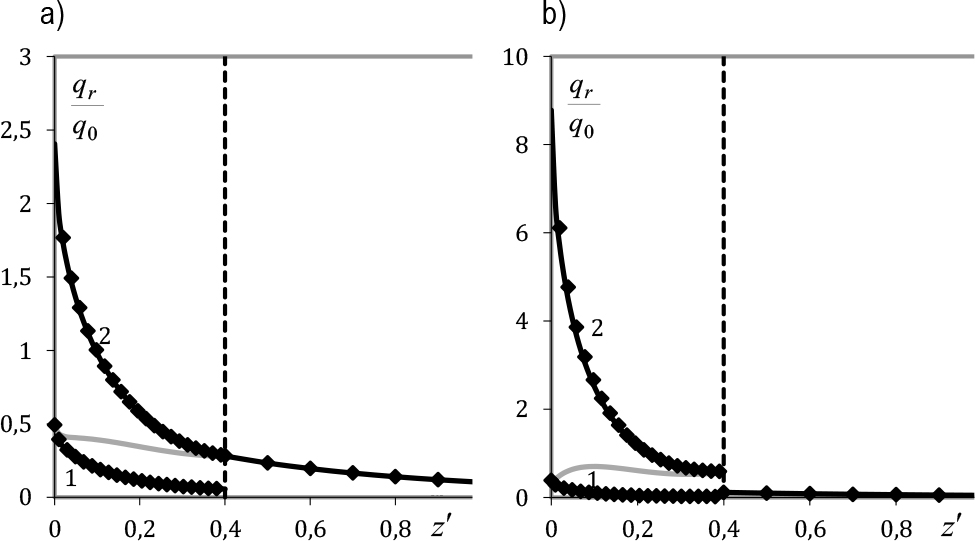
Fig. 6.
Distributions of the radial heat flux on the cylindrical surface r = 1 (black lines and rhombi): fig. a) – K2/K0 = 1; fig. b) – K2/K0 = 5; grey line – the distribution of the average radial heat flux; vertical dashed line – the interface of the coating and base; m = 20; z′ = h – z
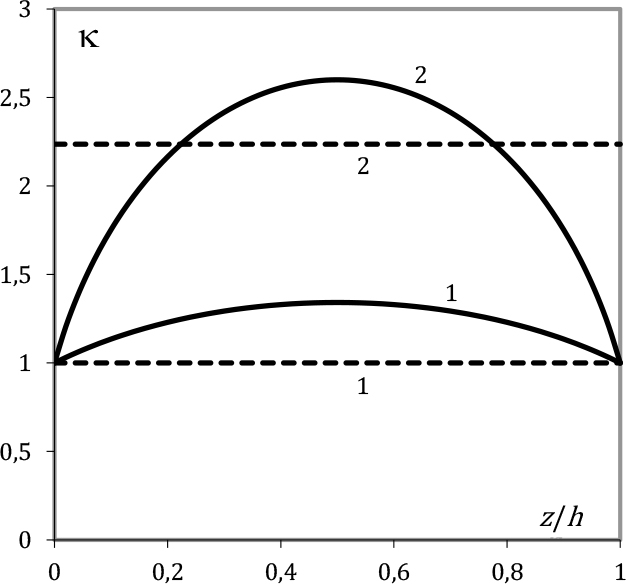
Fig. 7.
Graphs of the function κ(z): continuous lines – coatings described in section C: 1 – K1/K0 = 0.2, K2/K0 = 1; 2 – K1/K0 = 0.2, K2/K0 = 5; dashed lines – coatings described in section A: 1 – κ2 = 1; 2 – κ2 = 5
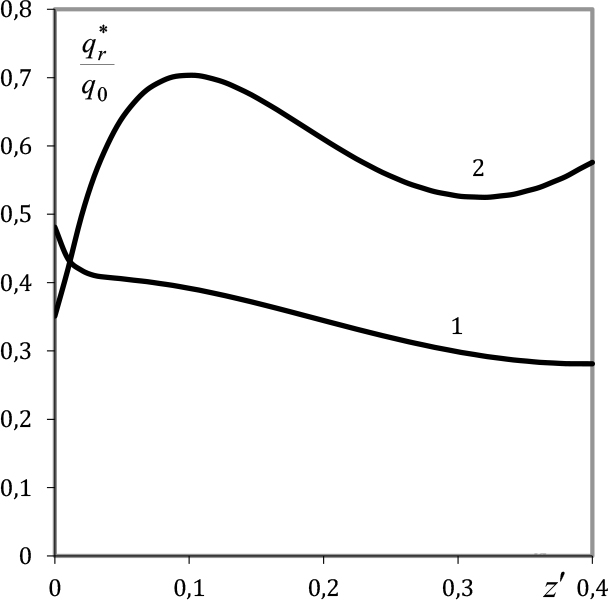
Fig. 8.
Distributions of the average radial heat flux on the cylindrical surface r = 1 (coatings described in section C): 1 – K1/K0 = 0.2, K2/K0 = 1; 2 – K1/K0 = 0.2, K2/K0 = 5; m = 20; z′ = h – z