
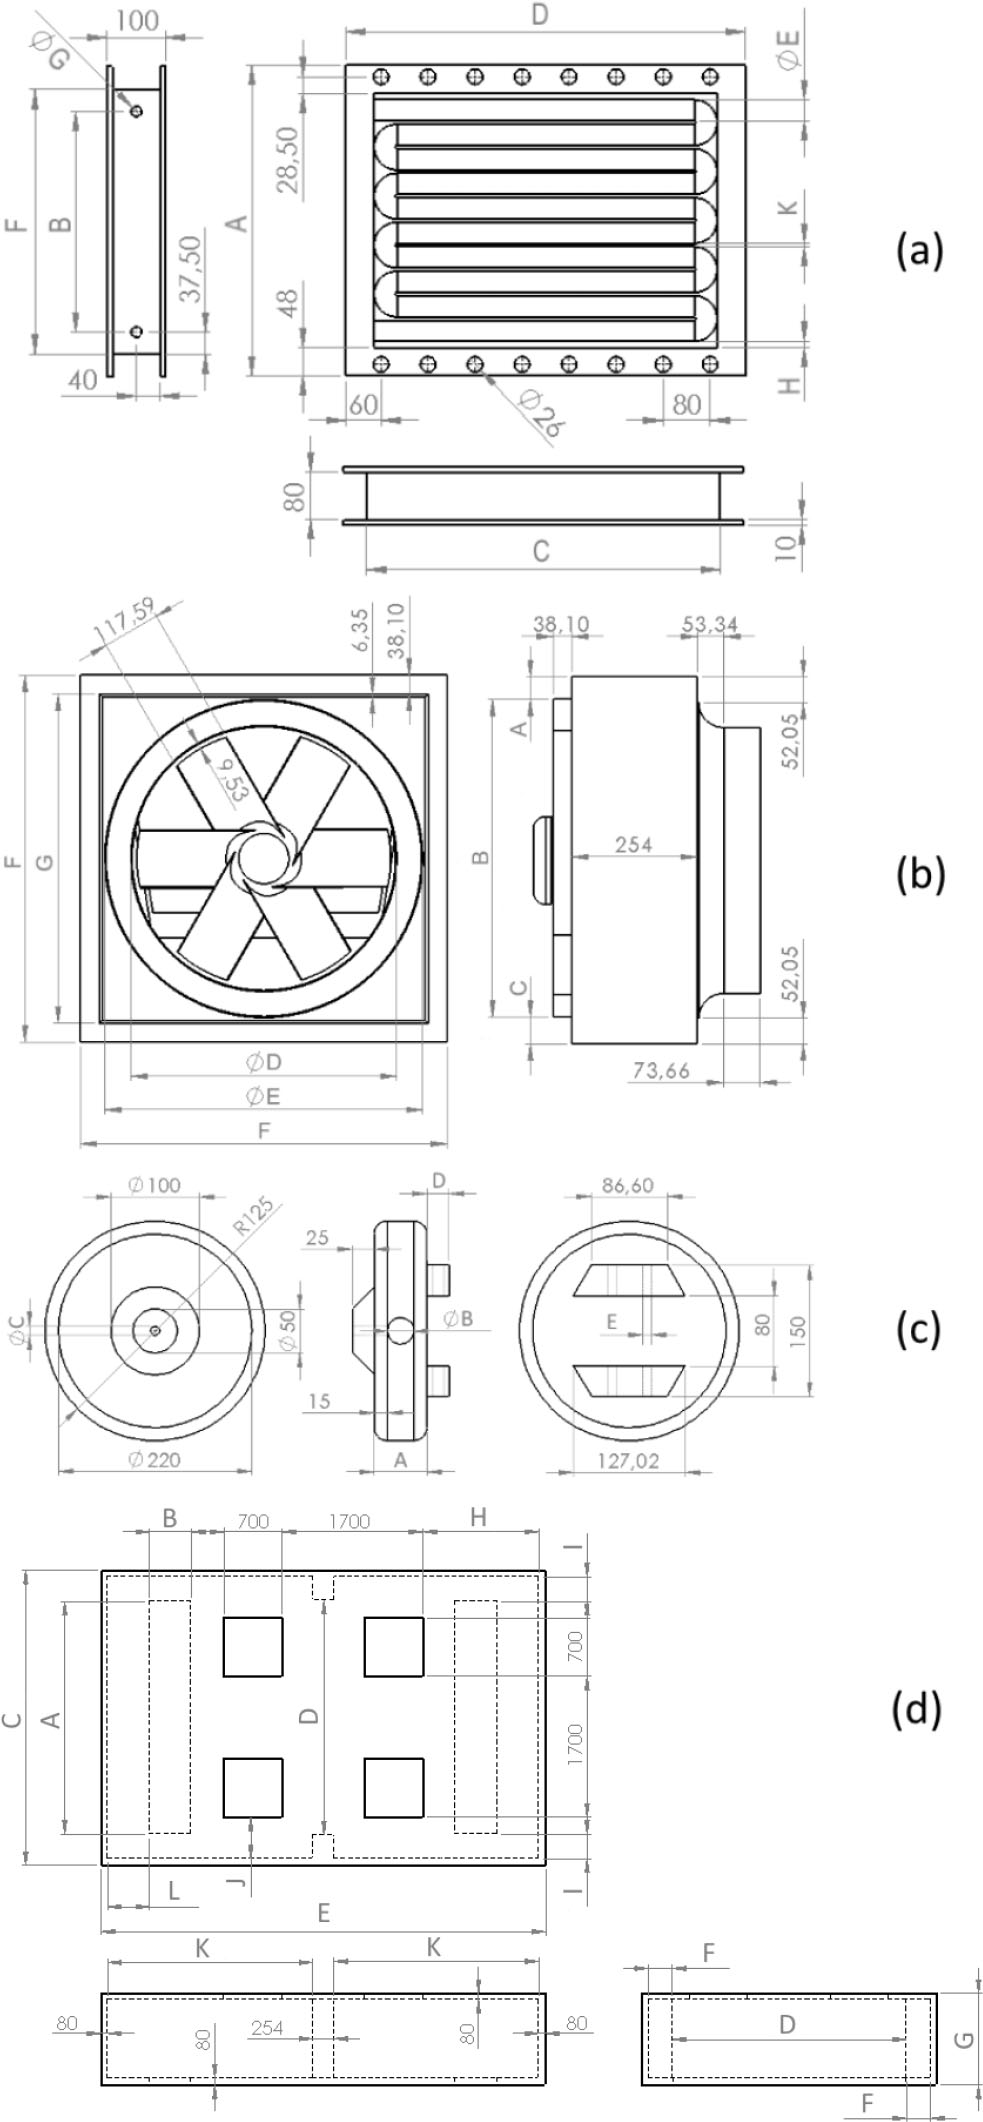
Fig. 1.
View of 2D sketches of the water heater (a), axial fan (b), humidifying nozzle (c), and ceiling (d)
Tab. 1.
Parameterized dimensions of the main components of the 3D model of the drying chamber
| Component of the 3D model | A, mm | B, mm | C, mm | D, mm | E, mm | F, mm | G, mm | H, mm | I, mm | J, mm | K, mm | L, mm |
|---|---|---|---|---|---|---|---|---|---|---|---|---|
| Water heater | 555 | 402 | 730 | 808 | 38 | 477 | 19 | 12.5 | - | - | 8 | - |
| Axial fan | 47.74 | 740.83 | 54.43 | 638.53 | 743.94 | 843 | 766.8 | - | - | - | - | - |
| Humidifying nozzle | 55 | 25 | 15 | 30 | 14 | - | - | - | - | - | - | - |
| Ceiling | 4848 | 477 | 5703 | 5058 | 7291 | 242.5 | 1003 | 2365.5 | 347.5 | 547.5 | 3438.5 | 238.5 |
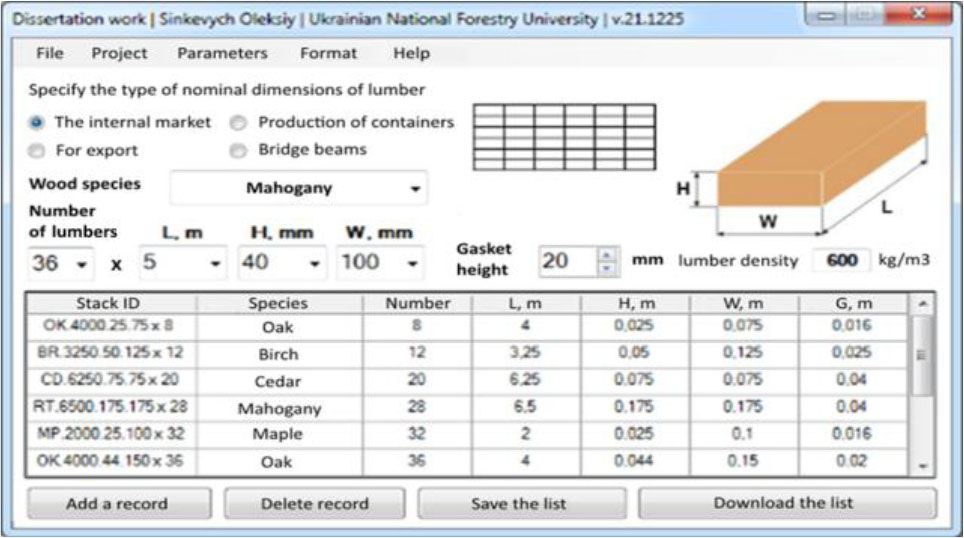
Fig. 2.
View of the main window of the developed software
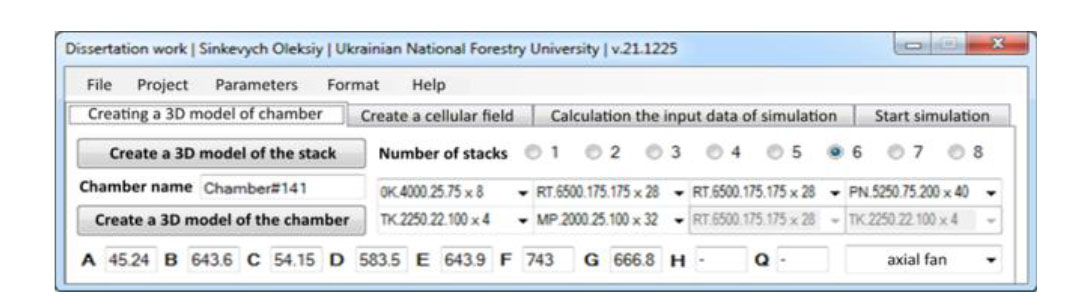
Fig. 3.
Tab of the automated design of the 3D model of the drying chamber
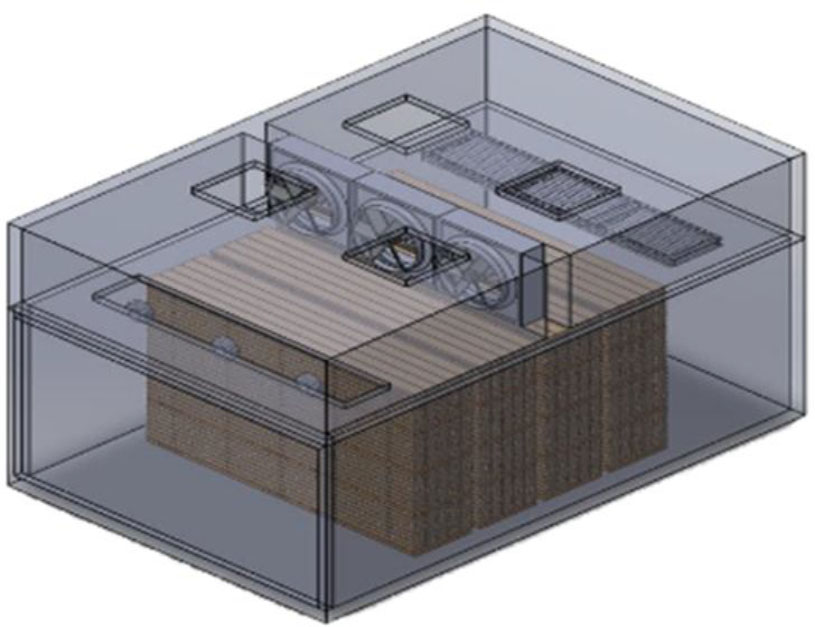
Fig. 4.
General view of the drying chamber assembly in SolidWorks
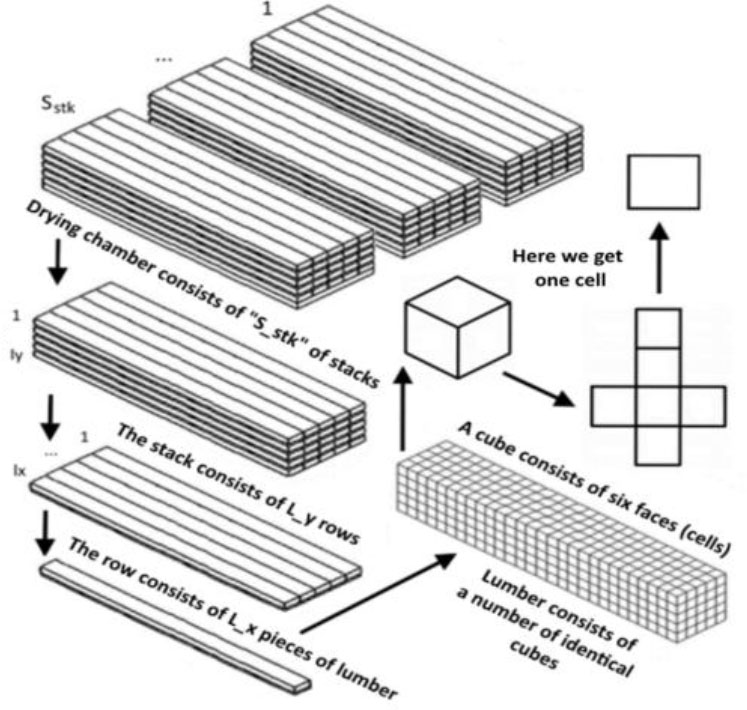
Fig. 5.
Scheme of transformation of a 3D model of stacks into a three-dimensional array of cells
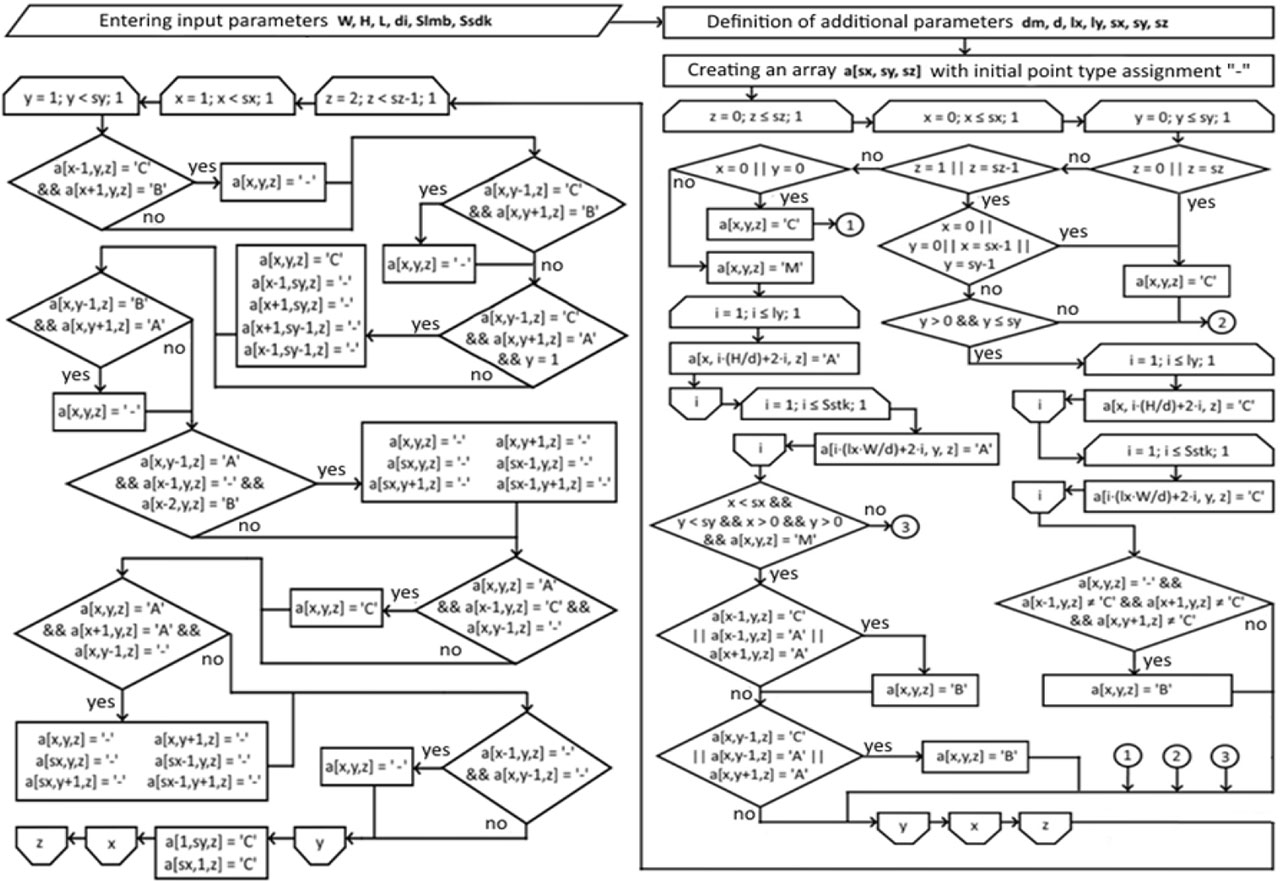
Fig. 6.
Algorithm for creating a cellular automata field within stacks
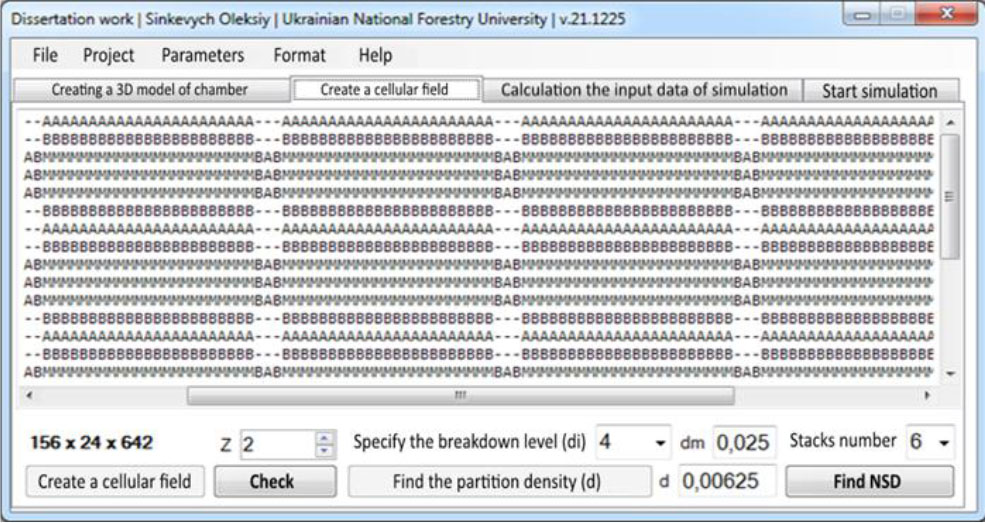
Fig. 7.
Tab of the cellular automata field creation
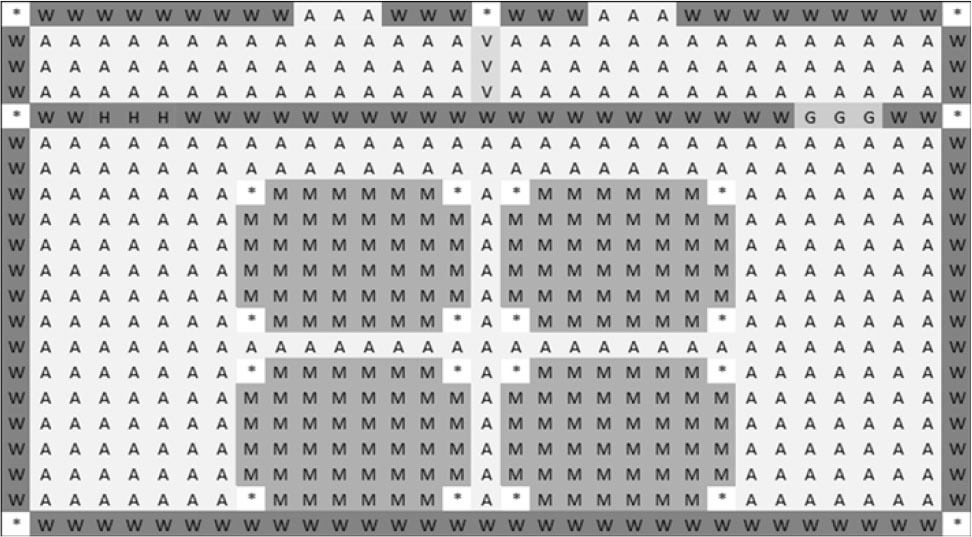
Fig. 8.
View of the created cellular automata field
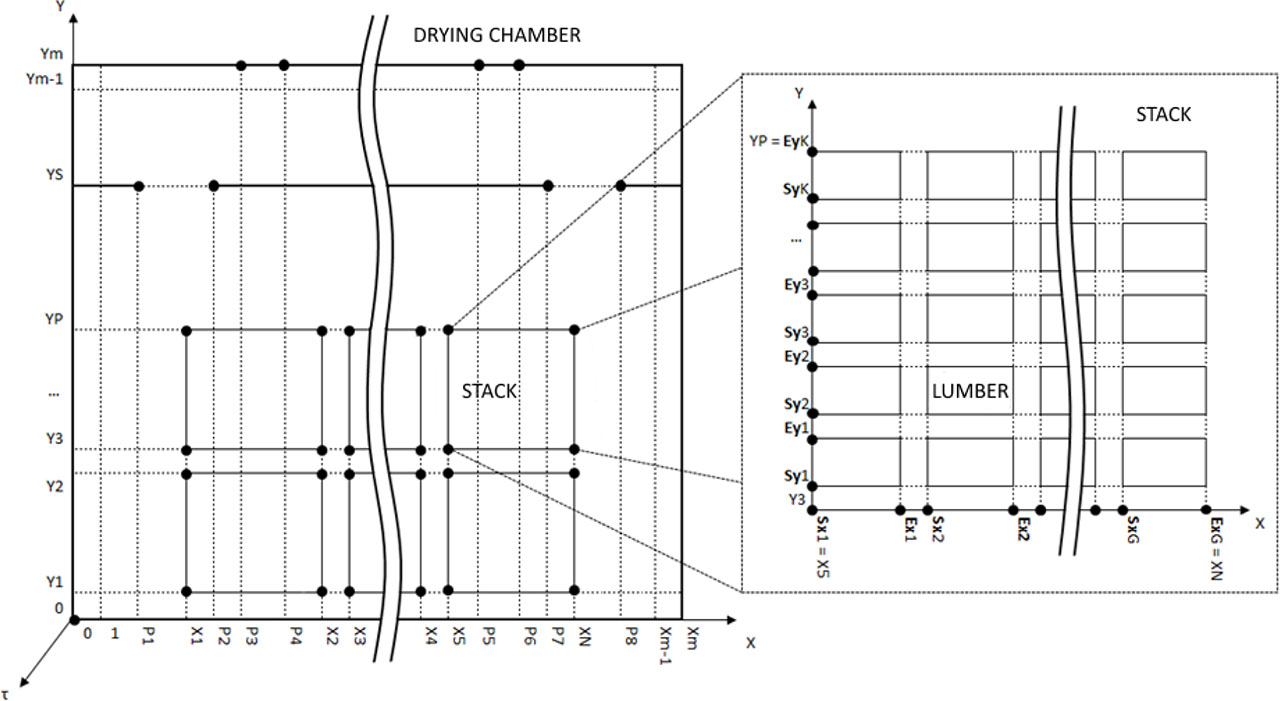
Fig. 9.
The diagram illustrating the coordinates for the boundary conditions in the mathematical model
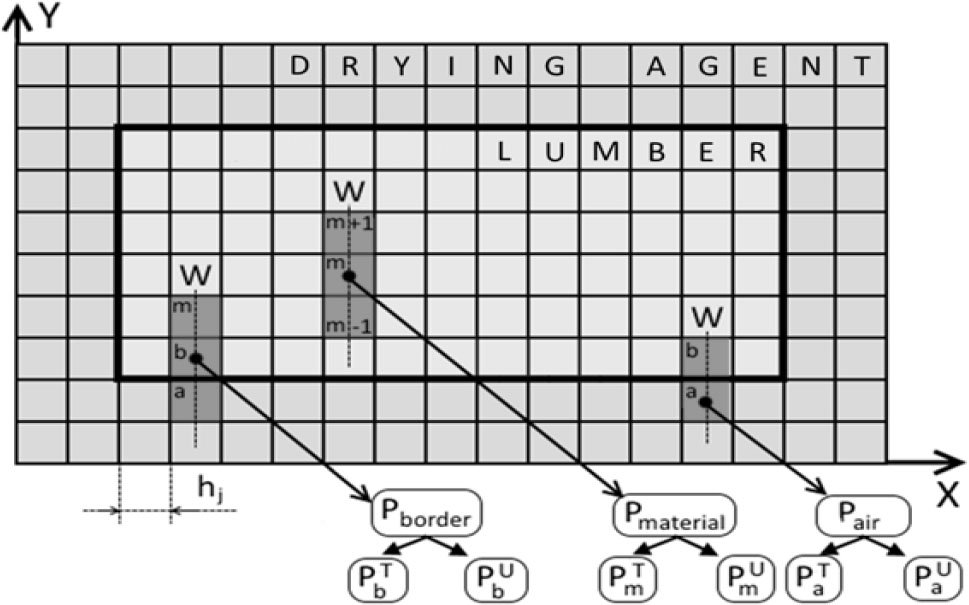
Fig. 10.
Cell marking scheme used for transition rules
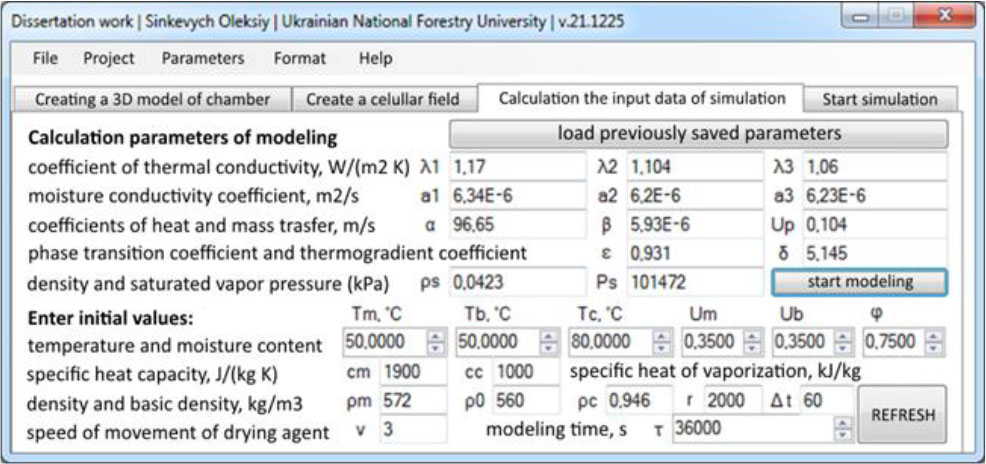
Fig. 11.
Tab of the input data of the simulation and its launch
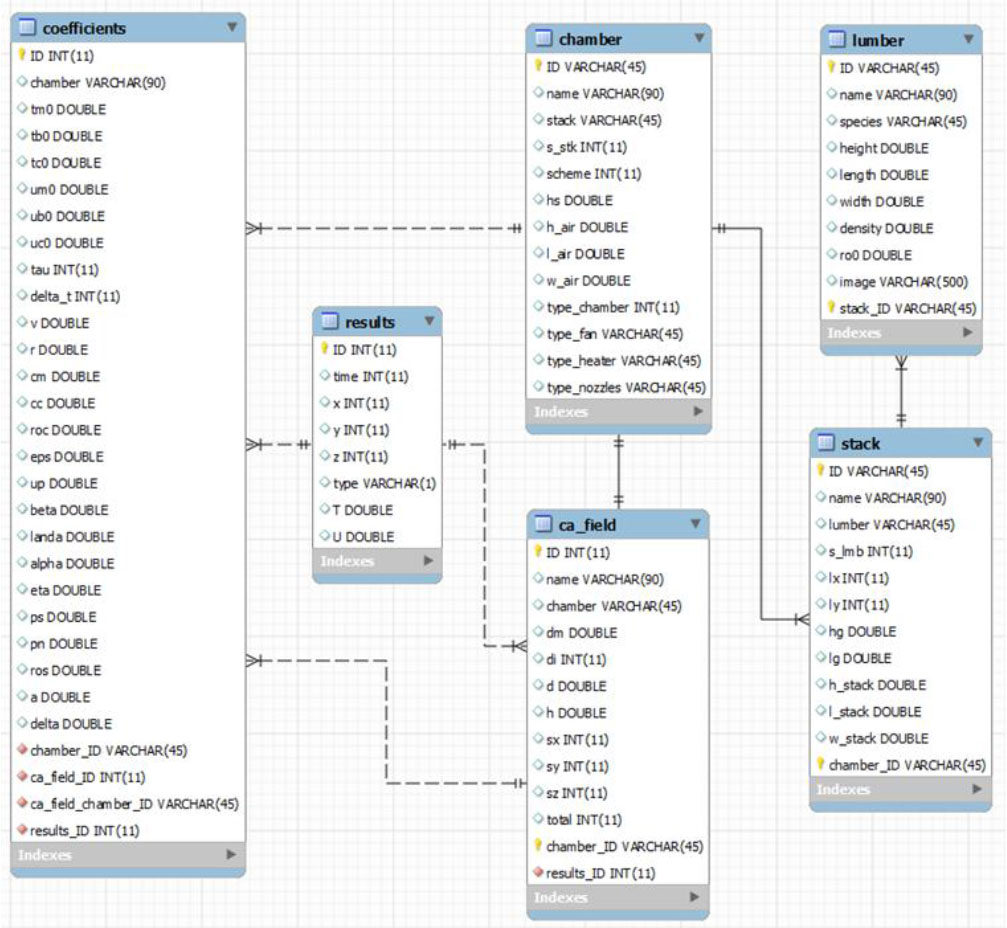
Fig. 12.
View of the Entity-Relationship diagram for developed software
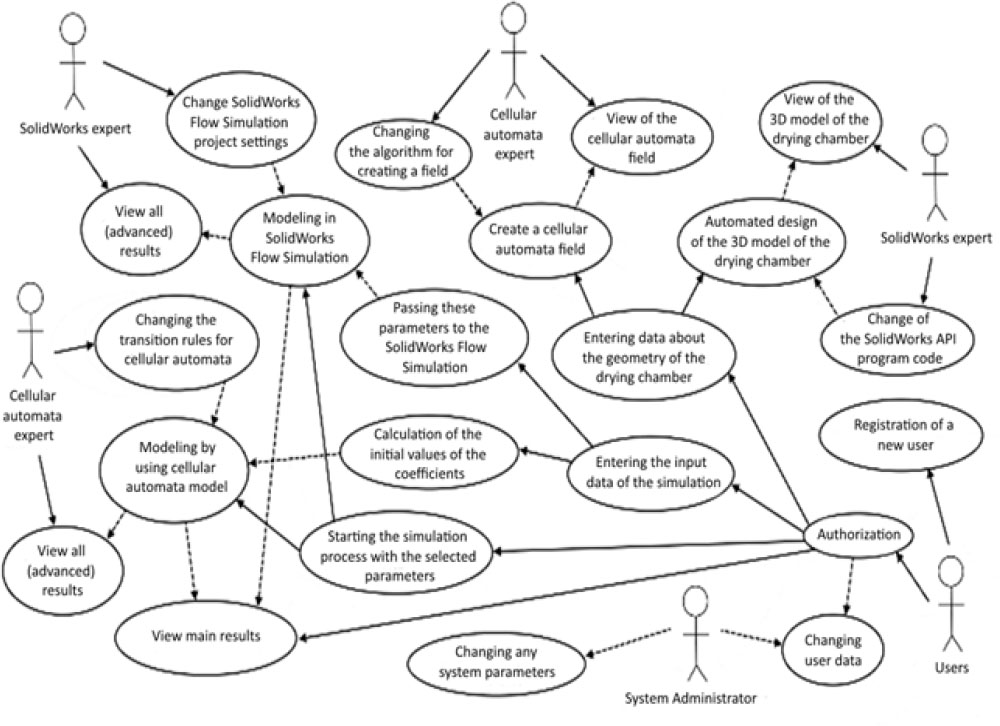
Fig. 13.
View of the UML use case diagram
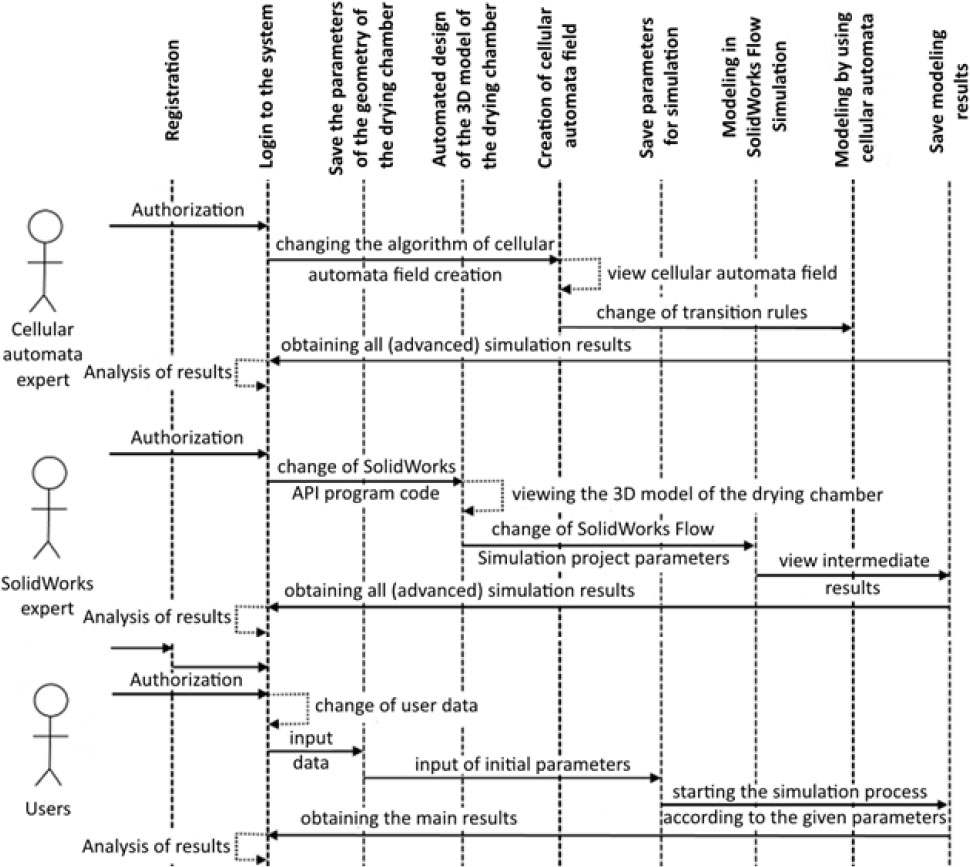
Fig. 14.
View of the UML sequence diagram
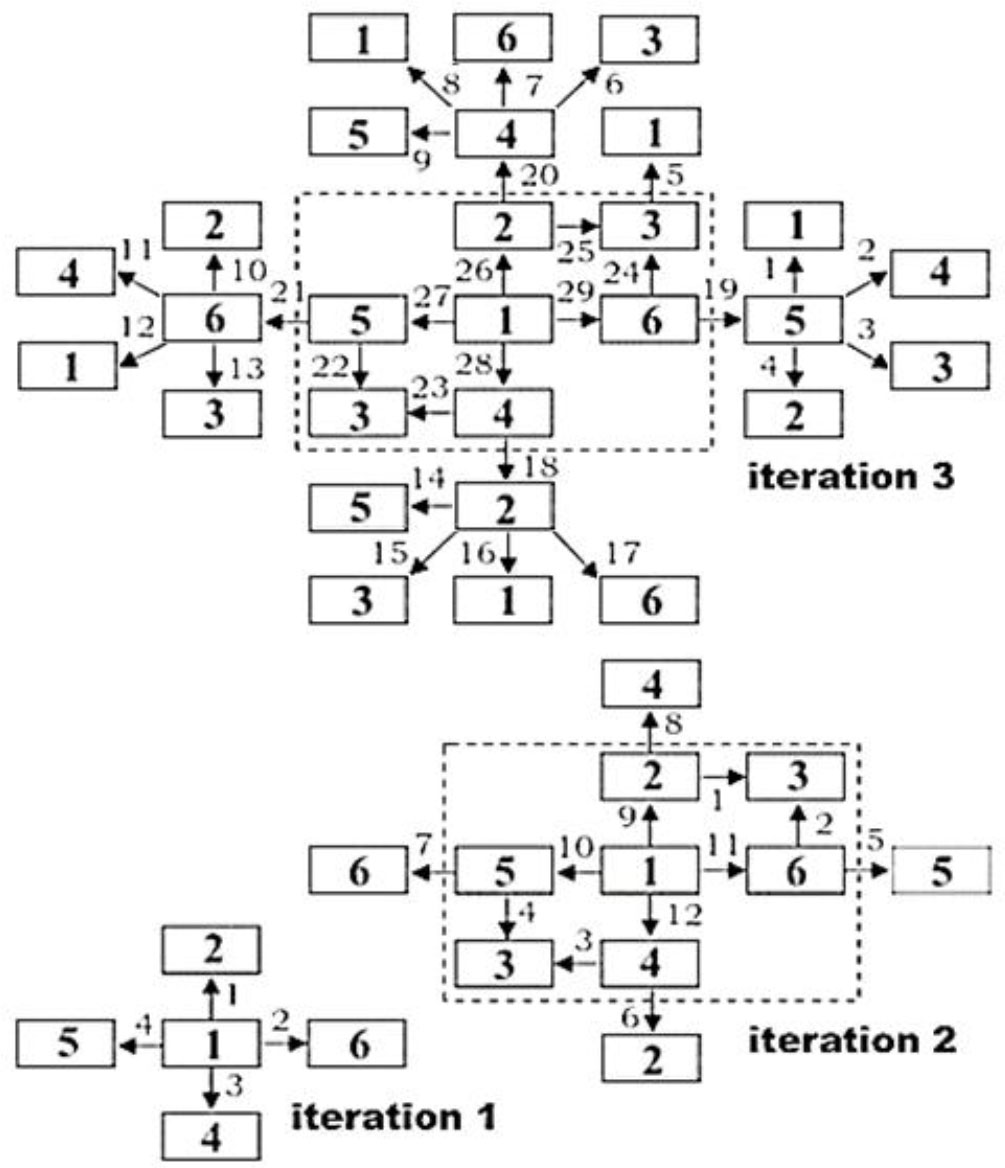
Fig. 15.
Start of the iteration cycle
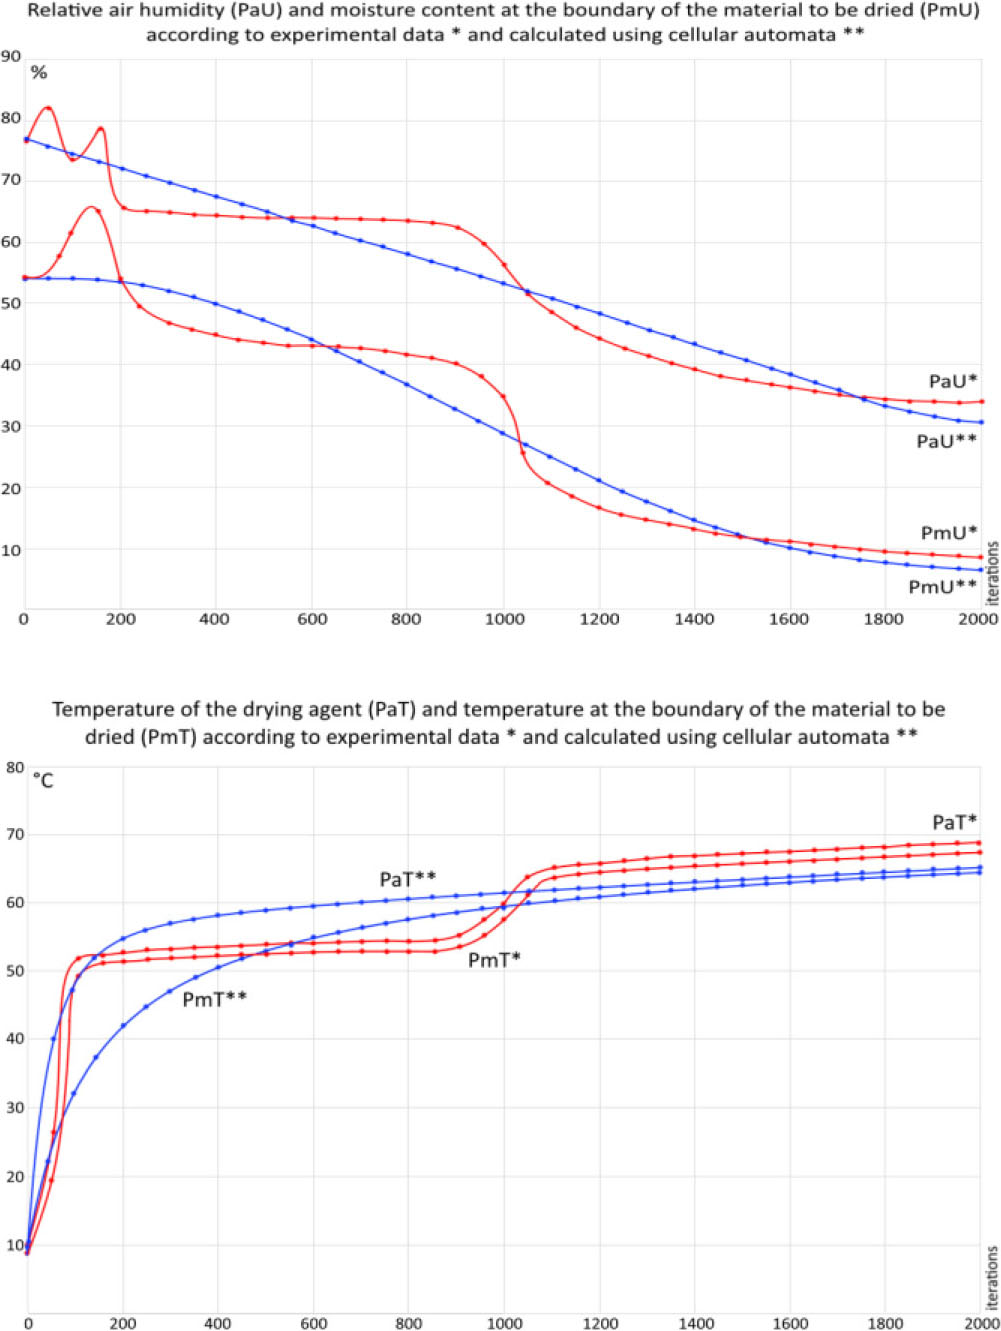
Fig. 16.
A chart depicting the variation of the key parameters over time for the first study
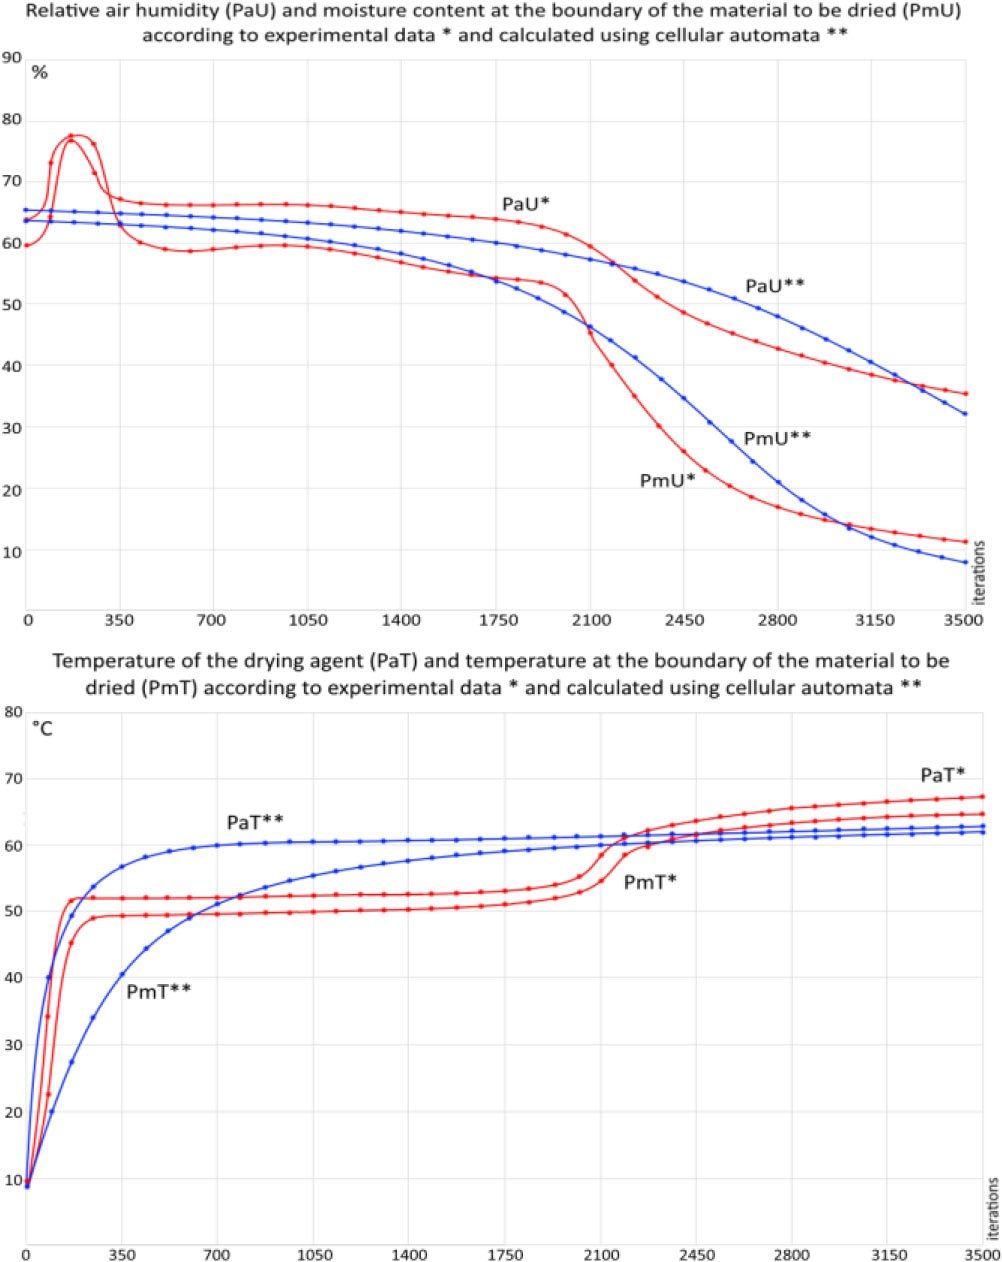
Fig. 17.
A chart depicting the variation of the key parameters over time for the second study