
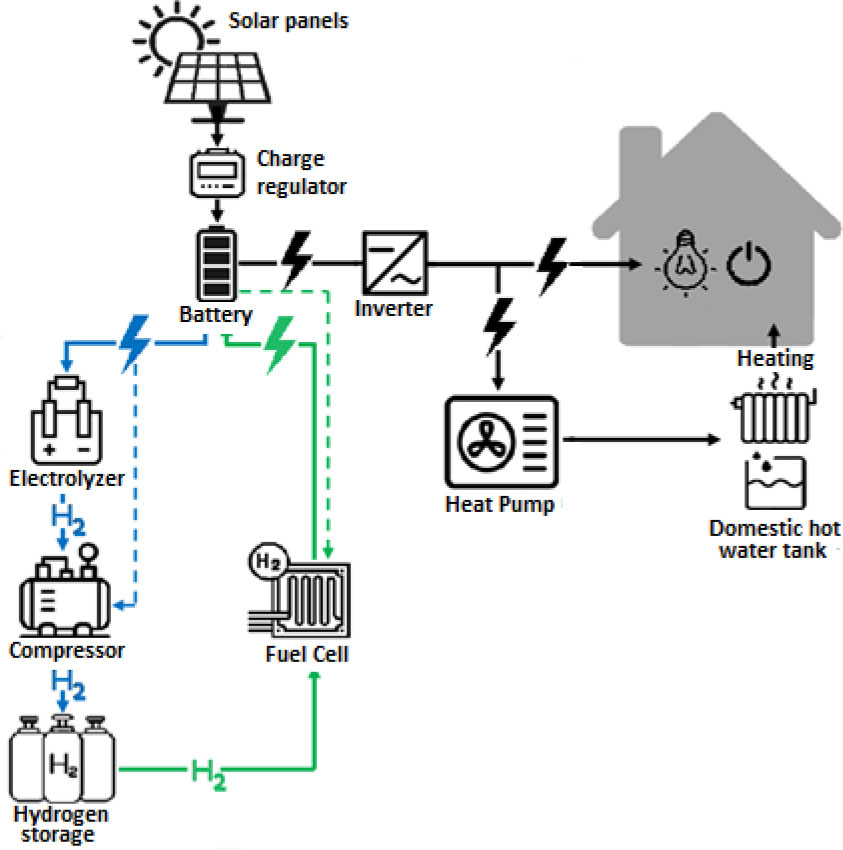
Fig. 1.
Scheme of a self-sufficient residential energy system
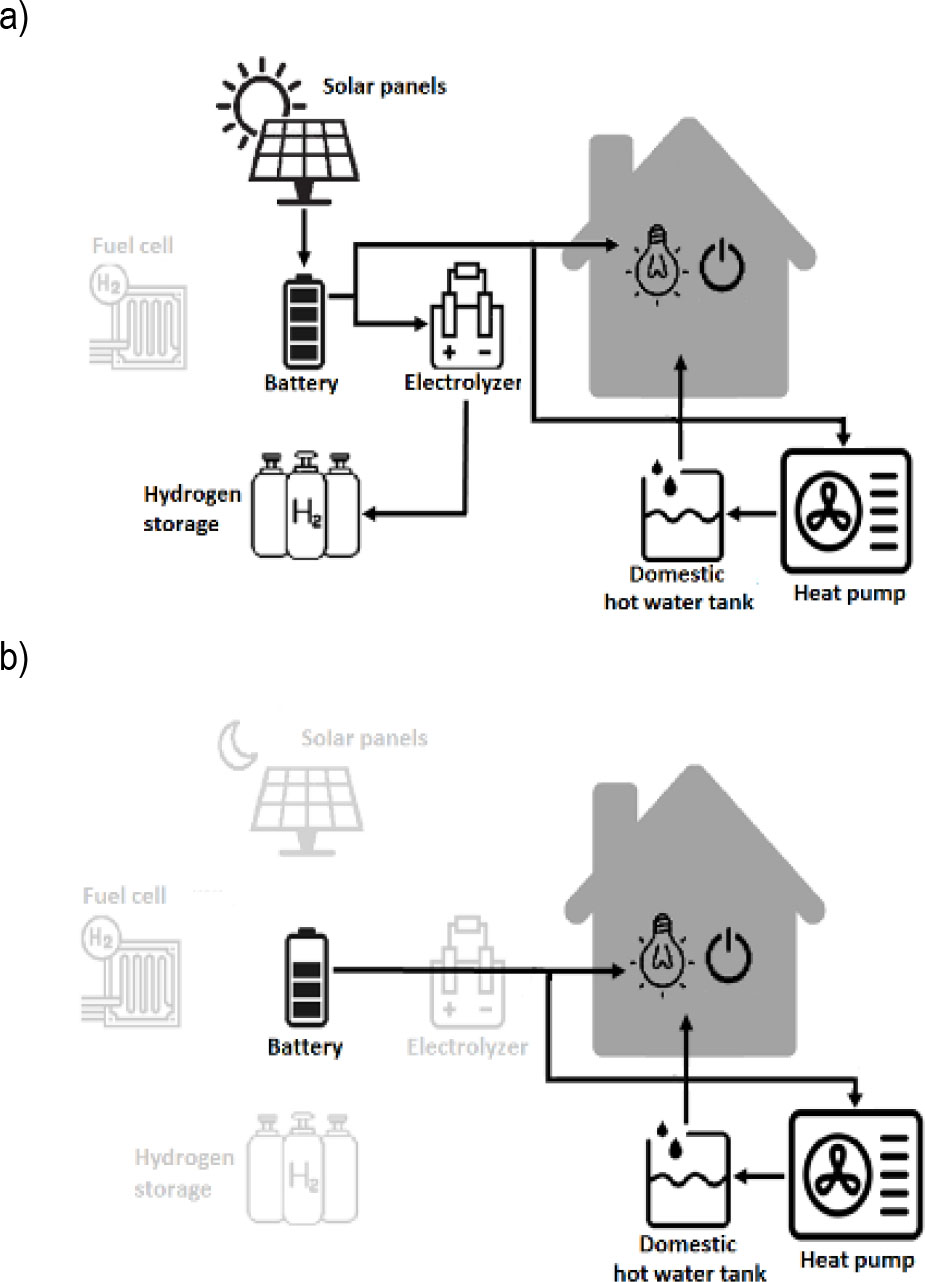
Fig. 2.
System operation in the spring-summer period: a) during the day, b) after sunset
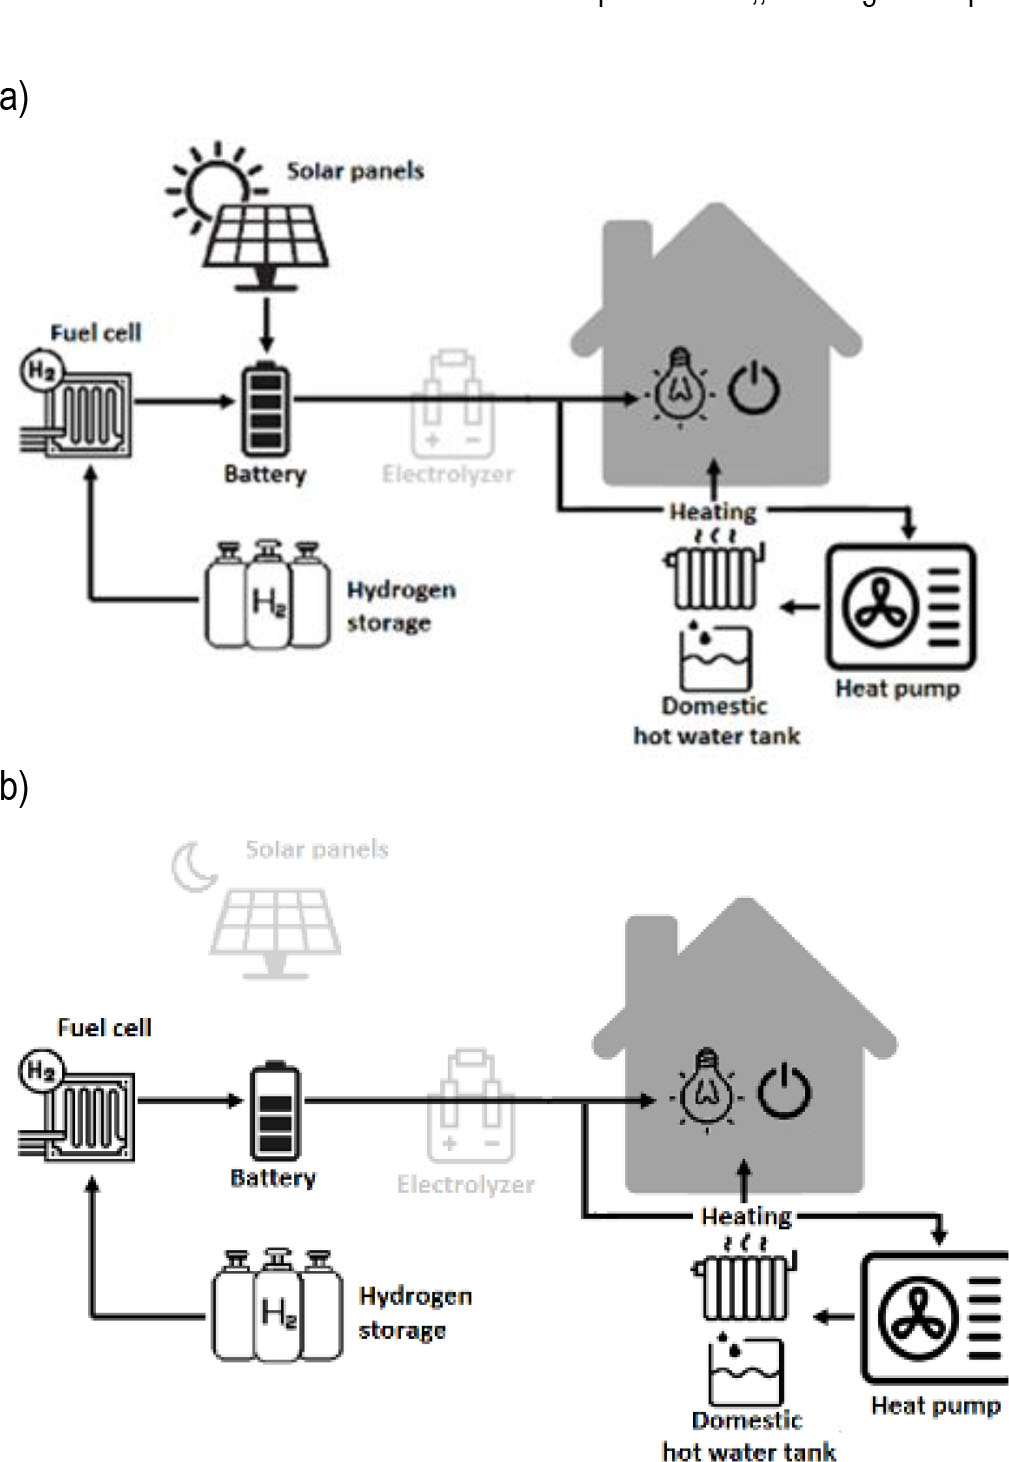
Fig. 3.
System operation in the autumn–winter period: a) during the day, b) after sunset
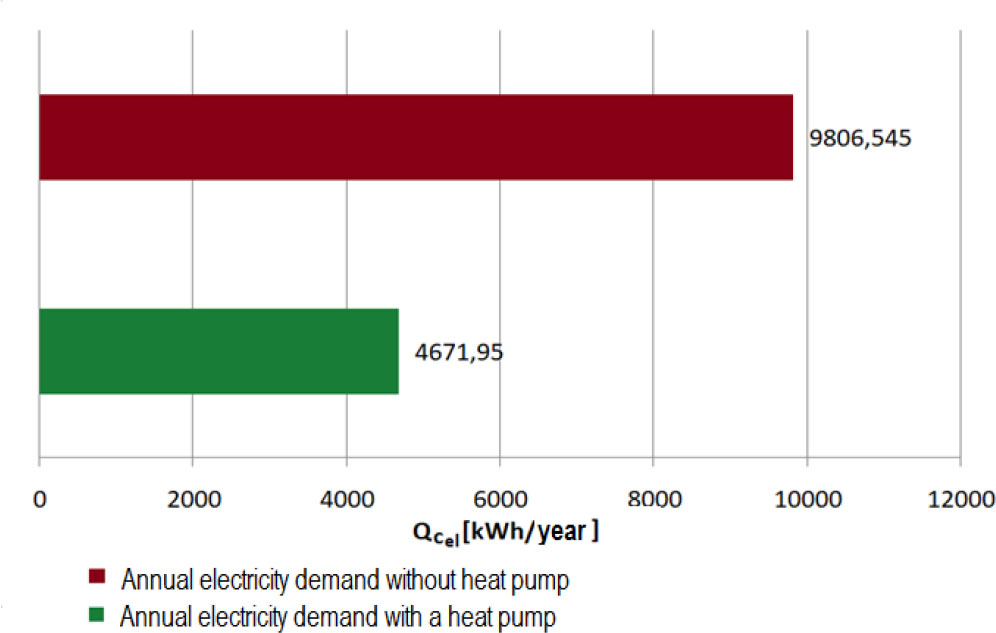
Fig. 4.
Annual electricity demand for a power system with and without a heat pump
Tab. 2.
Electricity demand depending on the month
| Month | Electricity demand for heating the building | Demand for electricity to heat domestic hot water | Electricity demand for other needs | Total electricity |
|---|---|---|---|---|
| [kWh] | [kWh] | [kWh] | [kWh] | |
| Jan | 343.56 | 46.181 | 220 | 609.739 |
| Feb | 319.51 | 46.181 | 220 | 585.69 |
| Mar | 240.49 | 46.181 | 220 | 506.672 |
| Apr | 132.27 | 46.181 | 180 | 358.451 |
| May | 22.33 | 46.181 | 180 | 248.512 |
| Jun | 0 | 46.181 | 180 | 226.181 |
| Jul | 0 | 46.181 | 180 | 226.181 |
| Aug | 0 | 46.181 | 180 | 226.181 |
| Sep | 22.33 | 46.181 | 180 | 248.512 |
| Oct | 123.68 | 46.181 | 220 | 389.862 |
| Nov | 218.16 | 46.181 | 220 | 484.34 |
| Dec | 295.46 | 46.181 | 220 | 561.641 |
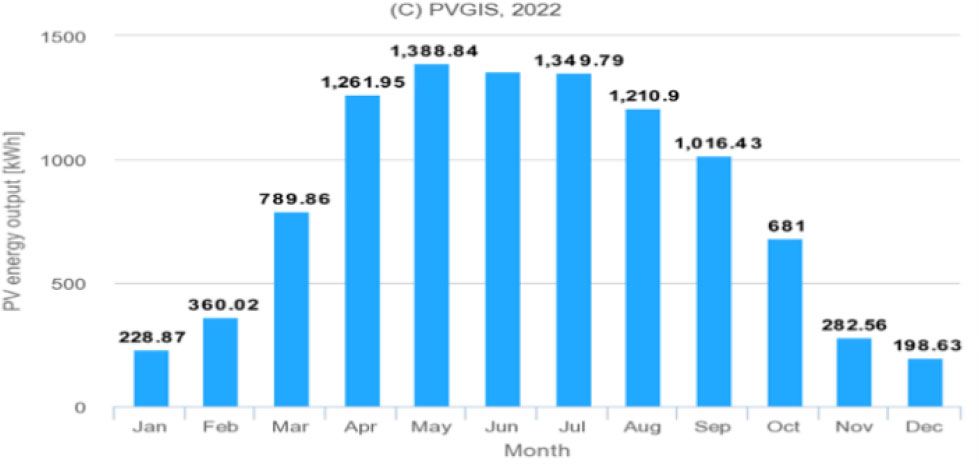
Fig. 5.
Monthly energy production from a photovoltaic system with a capacity of 10.14 kWp
Tab. 3.
Results of calculations of energy conversion for a 10.14 kWp photovoltaic installation after 25 years of use for individual months
| Month | Jan | Feb | Mar | Apr | May | Jun | Jul | Aug | Sep | Oct | Nov | Dec |
|---|---|---|---|---|---|---|---|---|---|---|---|---|
| Total electricity requirement [kWh] | 609.7 | 585.7 | 506.7 | 358.5 | 248.5 | 226.2 | 226.2 | 226.2 | 248.5 | 389.9 | 484.3 | 561.6 |
| Electricity from a photovoltaic panels [kWh] | 196.8 | 309.6 | 679.3 | 1085.3 | 1194.4 | 1167.1 | 1160.8 | 1041.4 | 874.1 | 585.7 | 243.0 | 170.8 |
| Electricity output from the charge regulator [kWh] | 190.9 | 300.3 | 658.9 | 1052.7 | 1158.6 | 1132.1 | 1126.0 | 1010.1 | 847.9 | 568.1 | 235.7 | 165.7 |
| Electricity output from the battery [kWh] | 175.6 | 276.3 | 606.2 | 968.5 | 1065.9 | 1041.6 | 1035.9 | 929.3 | 780.1 | 522.6 | 216.8 | 152.4 |
| Electricity drawn from the battery [kWh] | 175.6 | 276.3 | 533.3 | 377.3 | 261.6 | 238.1 | 238.1 | 238.1 | 261.6 | 410.4 | 216.8 | 152.4 |
| Electricity supplied to consumers [kWh] | 166.9 | 262.5 | 506.7 | 358.5 | 248.5 | 226.2 | 226.2 | 226.2 | 248.5 | 389.9 | 206.0 | 144.8 |
| Electricity output from the battery supplied to the electrolyzer [kWh] | 0.0 | 0.0 | 72.9 | 591.2 | 804.3 | 803.5 | 797.8 | 691.2 | 518.5 | 112.3 | 0.0 | 0.0 |
| Energy contained in hydrogen after the electrolysis process [kWh] | 0 | 0 | 54.64 | 443.3 | 603.2 | 602.6 | 598.3 | 518.4 | 388.8 | 84.19 | 0 | 0 |
| Energy stored in hydrogen in the tank [kWh] | 619.2 | 2.9 | 47.5 | 433.3 | 958.1 | 1482.4 | 2002.9 | 2454.0 | 2792.3 | 2865.5 | 2304.2 | 1463.7 |
| The sum of the accumulated amount of hydrogen in the tank [kg] | 18.6 | 0.1 | 1.4 | 13.0 | 28.7 | 44.5 | 60.1 | 73.6 | 83.8 | 86.0 | 69.1 | 43.9 |
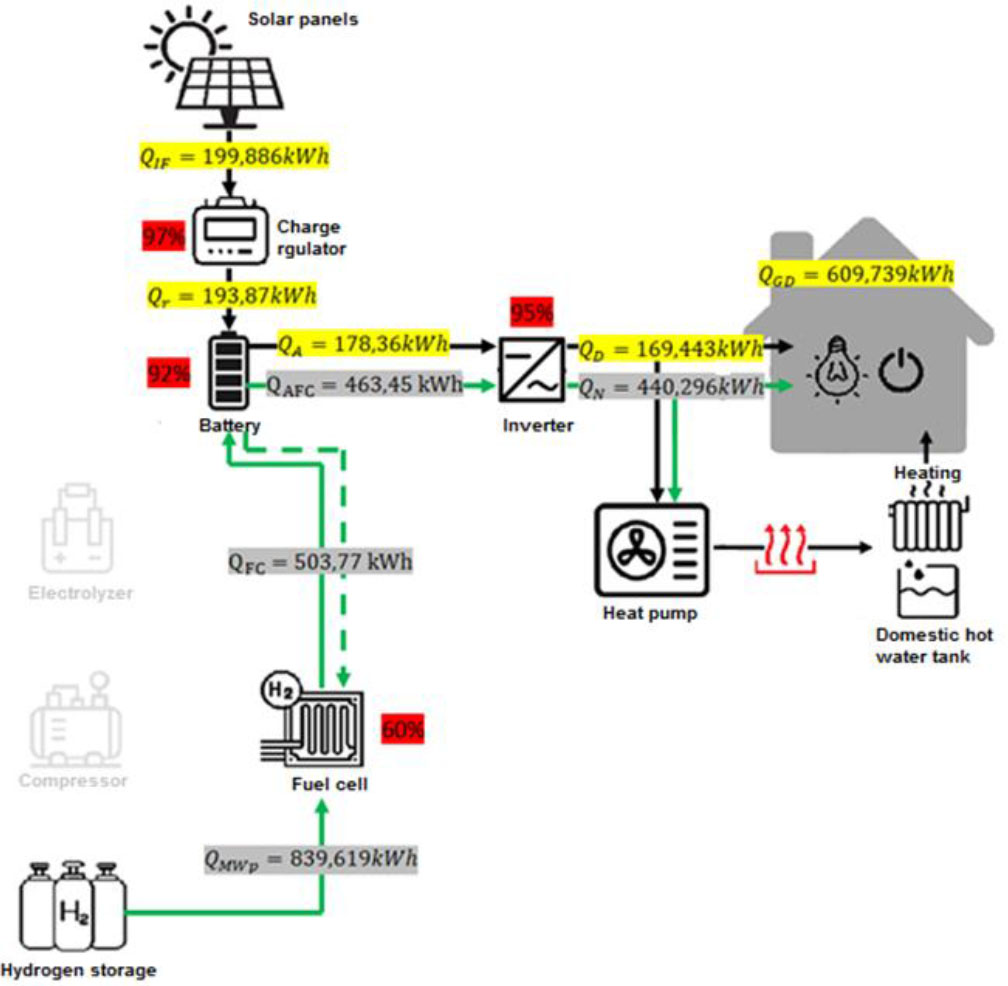
Fig. 6.
The example of the system operation in the month of January
Tab. 4.
Cost of devices used in the designed system (price from January 2022)
| Device | Producer | Price per piece [PLN] | Quantity [pcs] | Gross price [PLN] |
|---|---|---|---|---|
| Solar panel Q.PEAK DUO ML-G9 390 | Q.CELLS | 873.30 | 26 | 22 705.80 |
| Charge regulator MT2075 | Lumiax | 319.00 | 1 | 319.00 |
| Battery 2000RE-24 | Outback Power | 62 004 .07 | 1 | 62 004.07 |
| Inverter SINUSPRO-2000S | VOLT POLSKA | 1 264.00 | 1 | 1 264.00 |
| Heat pump 04S23D6V | DAIKIN | 22 580.00 | 1 | 22 580.00 |
| Electrolyzer Piel P | McPhy | 19 937.00 | 1 | 19 937.00 |
| Compressor WW-0.1/0.1–300 | AOT | 25 080.75 | 1 | 25 080.75 |
| Hydrogen tank 250l | MAHYTEC | 3 210.43 | 18 | 57 787.74 |
| Fuel cell FCS-C5000 | Horizon | 106 862.32 | 1 | 106 862.32 |
| Total cost | 215 467.14 | |||