
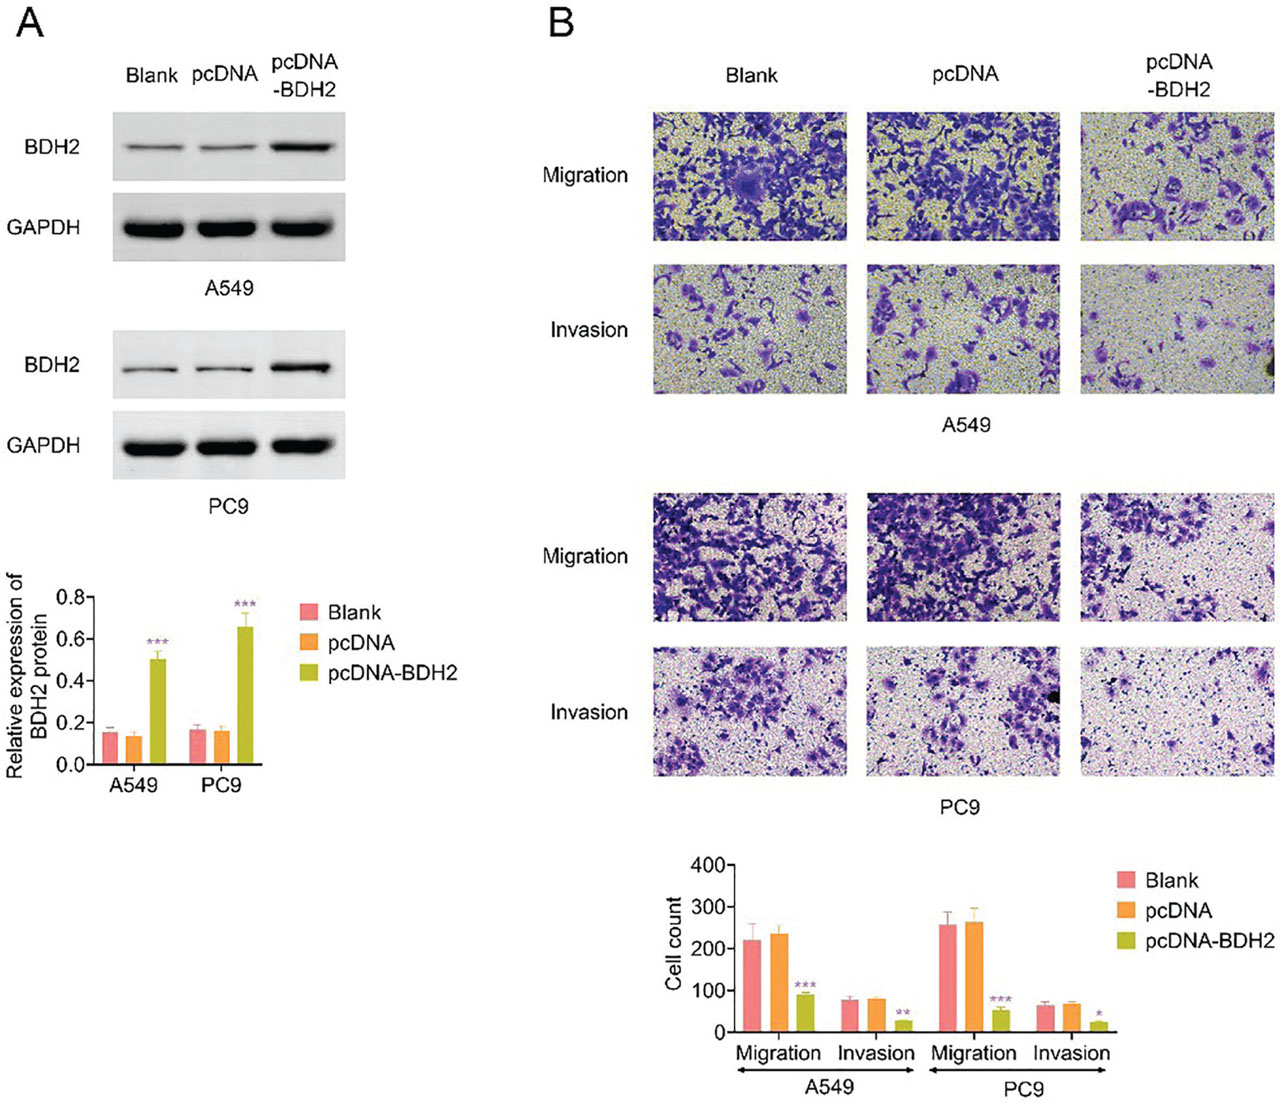
Fig 1.
BDH2 inhibits migration, invasion, and EMT of LUAD cells. (A) Western blot analysis of BDH2 protein expression in A549 and PC9 cells following transfection with empty vector (pcDNA) or BDH2-overexpressing plasmid (pcDNA-BDH2). GAPDH was used as a loading control. Quantification of BDH2 protein levels is shown below. (B) Representative images of Transwell migration and invasion assays performed in A549 and PC9 cells after transfection with pcDNA or pcDNA-BDH2. Quantitative analysis of migrated and invaded cells is presented in the bar graphs. Data are presented as mean ± SD. ***p < 0.001. EMT, epithelial–mesenchymal transition; LUAD, lung adenocarcinoma; SD, standard deviation.
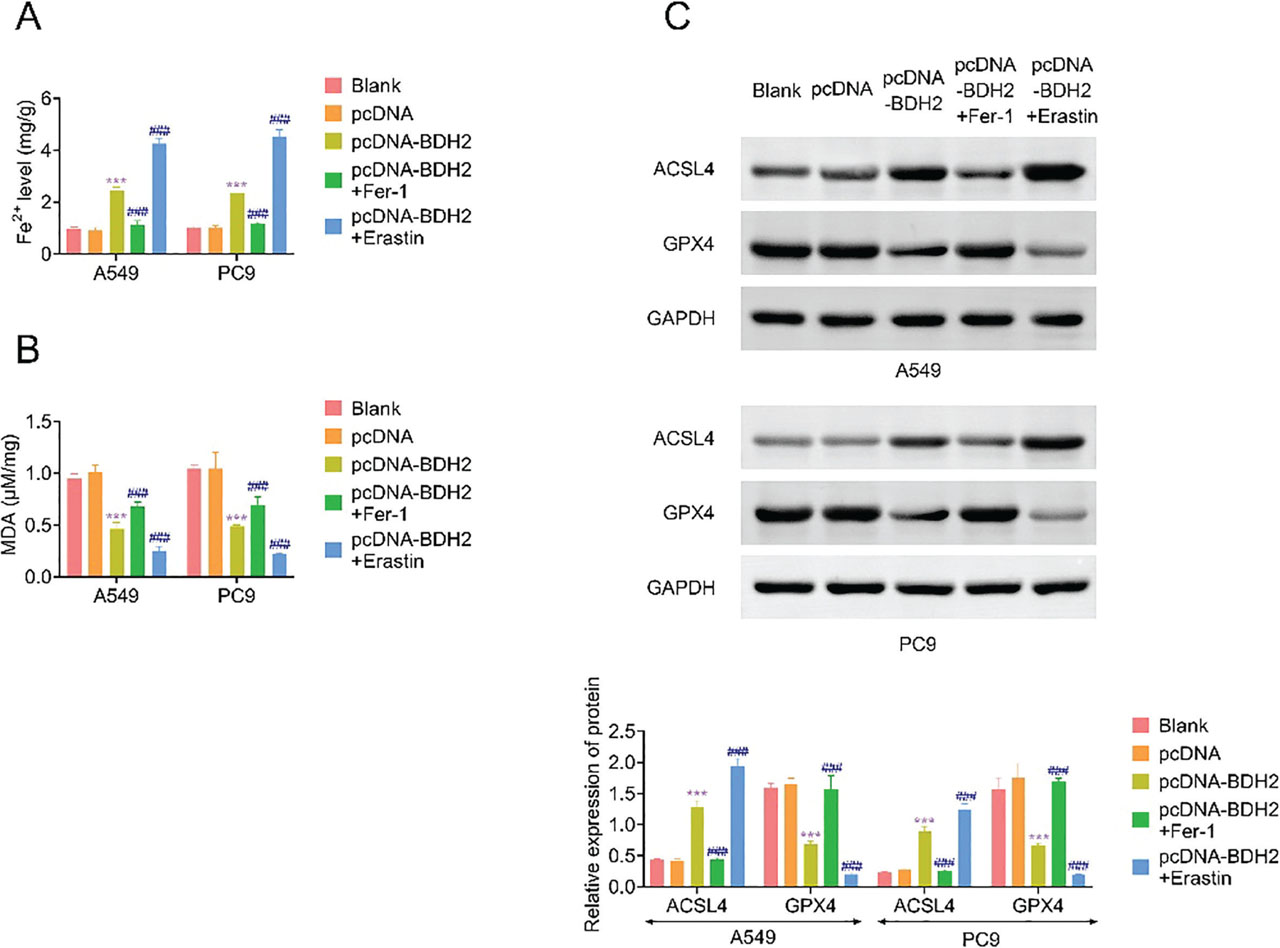
Fig 2.
BDH2 suppresses migration and invasion of LUAD cells by promoting ferroptosis. (A) Measurement of intracellular Fe2+ levels in A549 and PC9 cells under different conditions: Blank, pcDNA, pcDNA-BDH2, pcDNA-BDH2 + ferroptosis inhibitor (Fer-1), and pcDNA-BDH2 + ferroptosis inducer (Erastin). (B) Measurement of MDA levels in A549 and PC9 cells under the same experimental conditions. (C) Western blot analysis of ACSL4 and GPX4 protein expression in A549 and PC9 cells across different groups. GAPDH was used as a loading control. Quantification of protein expression levels is shown below. Data are presented as mean ± SD. ***p < 0.001 vs control; ###p < 0.001 vs pcDNA-BDH2 group. BDH2, 3-Hydroxybutyrate dehydrogenase 2; LUAD, lung adenocarcinoma; MDA, malondialdehyde; SD, standard deviation.
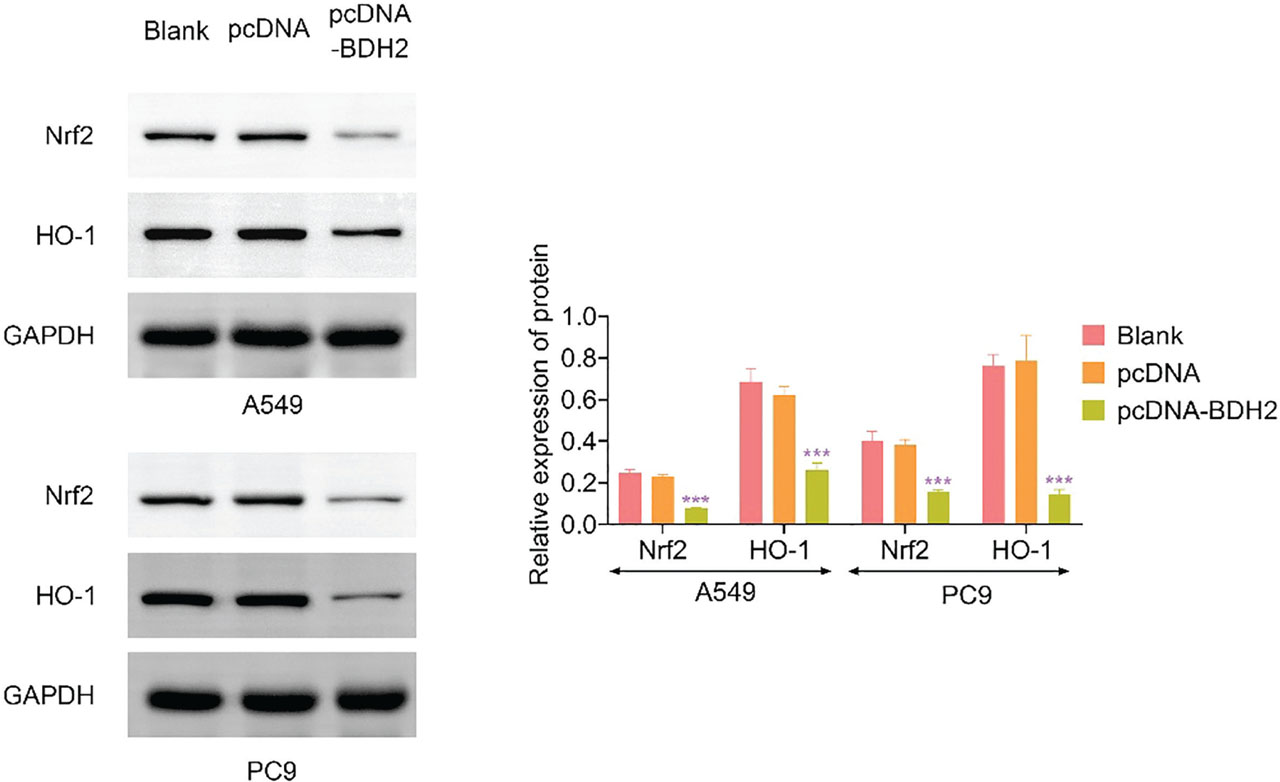
Fig 3.
BDH2 regulates the Nrf2/HO-1 axis in LUAD cells. Western blot analysis of Nrf2 and HO-1 protein expression in A549 and PC9 cells after transfection with pcDNA or BDH2-overexpressing plasmid (pcDNA-BDH2). GAPDH was used as a loading control. Quantitative analysis of protein expression levels is shown in the bar graphs. Data are presented as mean ± SD. ***p < 0.001 vs control. LUAD, lung adenocarcinoma; SD, standard deviation.
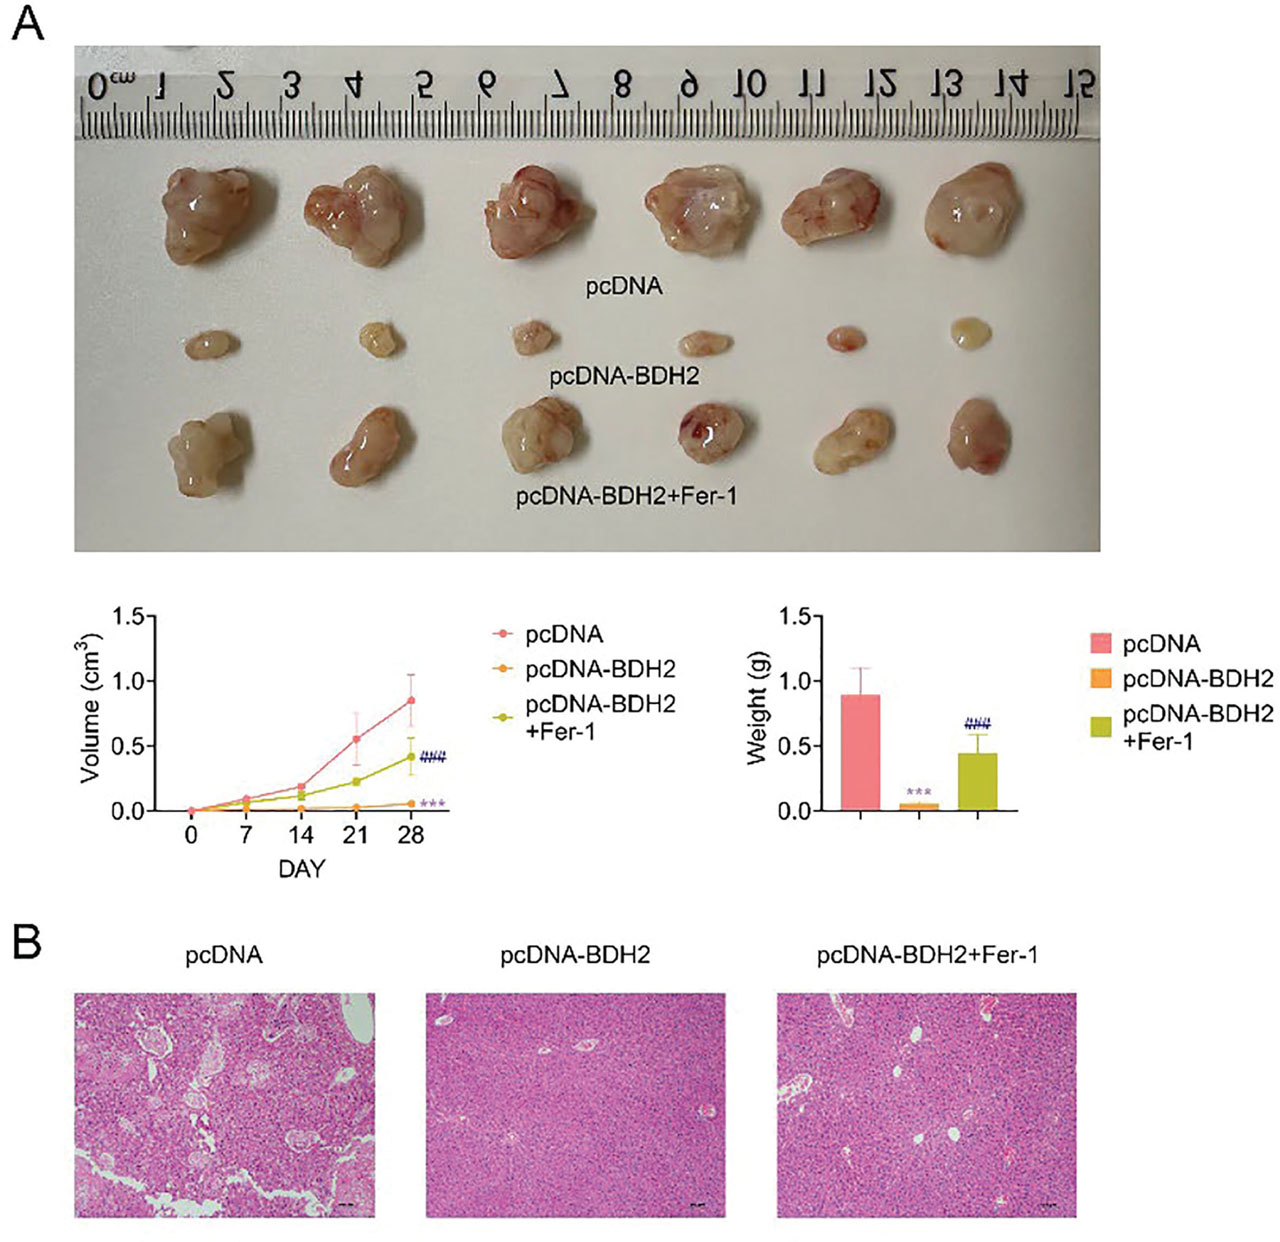
Fig 4.
BDH2 inhibits tumor metastasis in vivo by promoting ferroptosis in LUAD cells. (A) Representative images of xenograft tumors derived from A549 cells transfected with pcDNA, pcDNA-BDH2, or pcDNA-BDH2 combined with ferroptosis inhibitor (Fer-1). Tumor growth curves and tumor weights are shown in the corresponding graphs. (B) Representative hematoxylin and eosin (H&E) staining of tissue sections from nude mice in different groups, used to evaluate metastatic lesions. Data are presented as mean ± SD. ***p < 0.001 vs control; ###p < 0.001 vs pcDNA-BDH2 group. LUAD, lung adenocarcinoma; SD, standard deviation.