Fig 1.
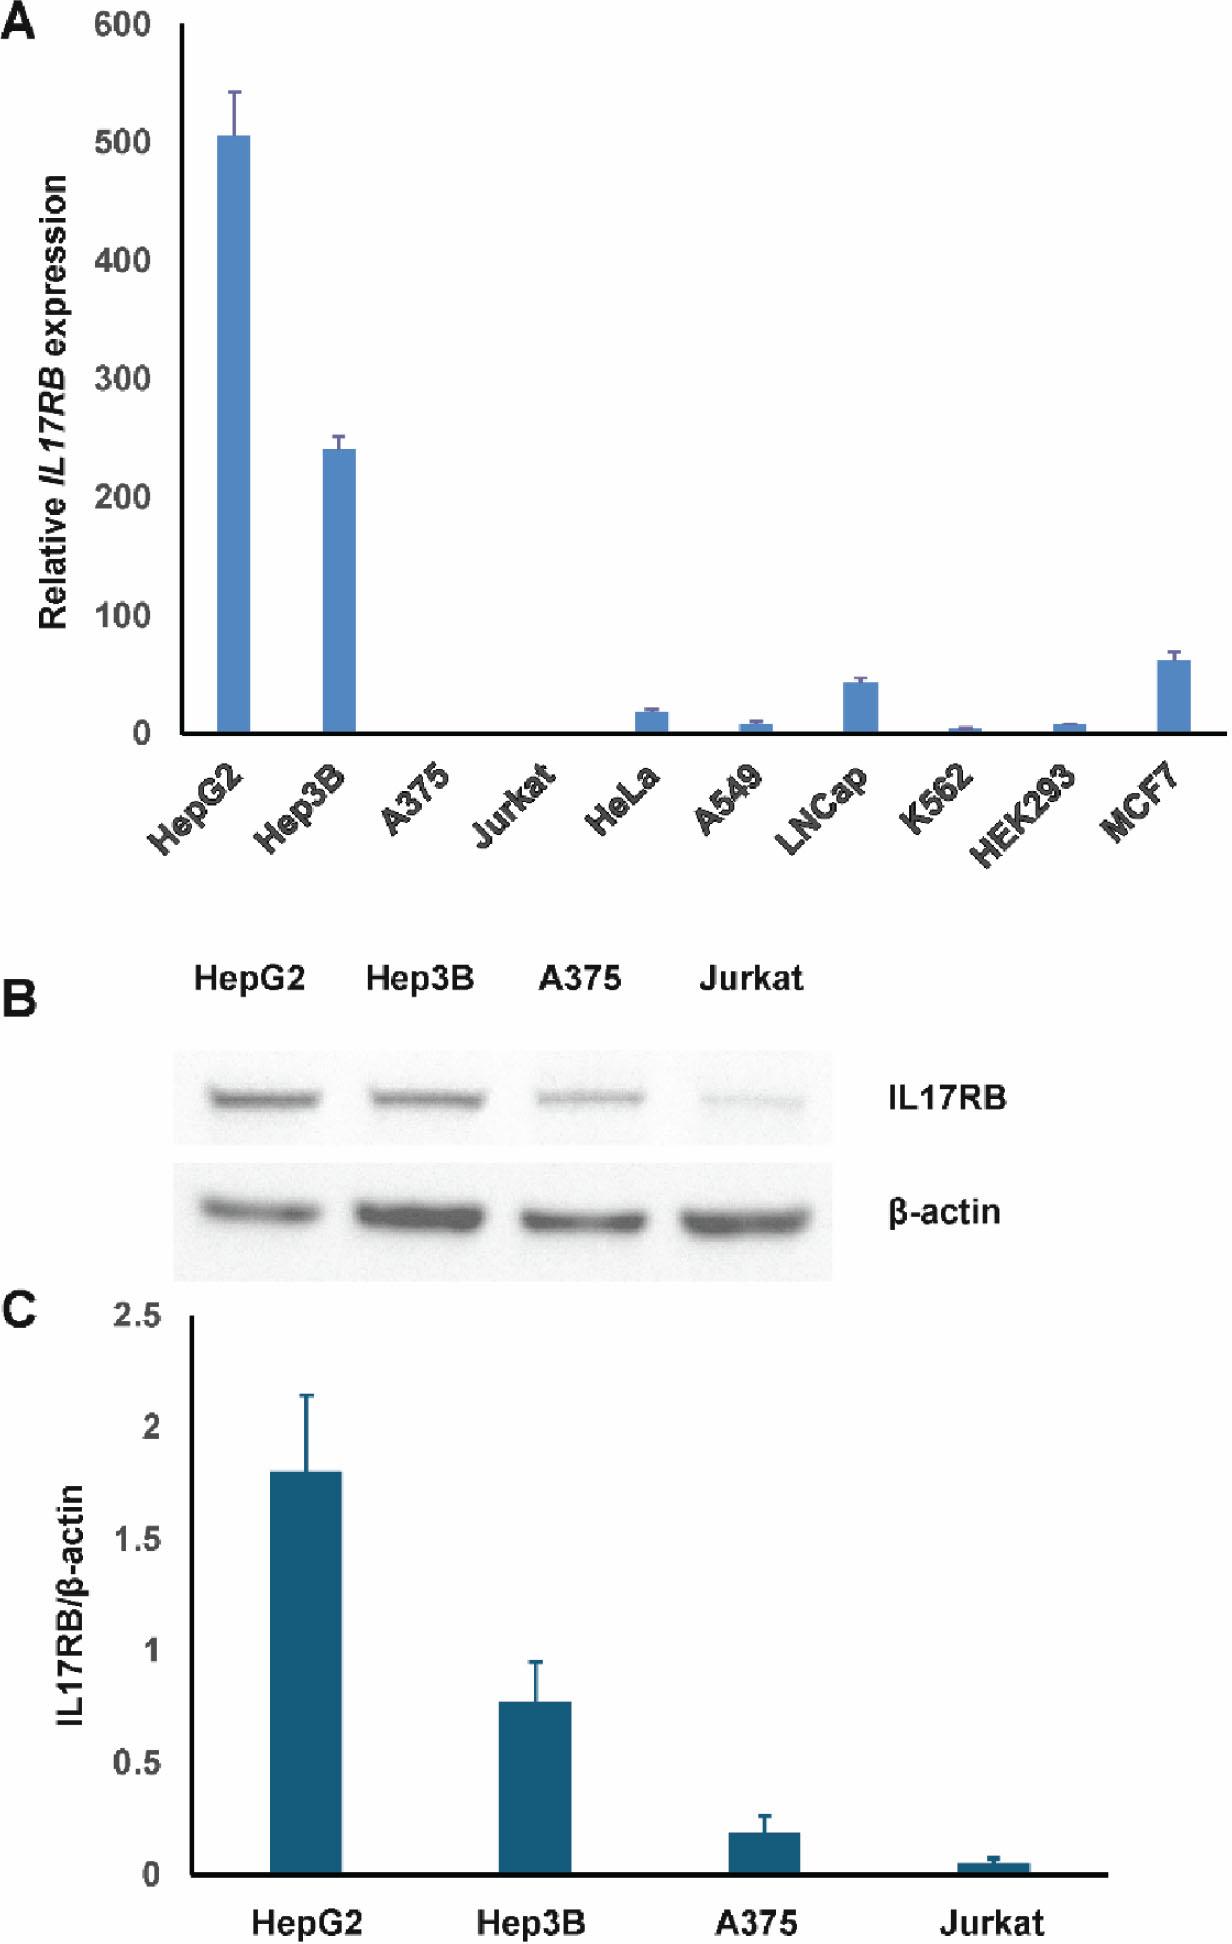
Fig 2.

Fig 3.
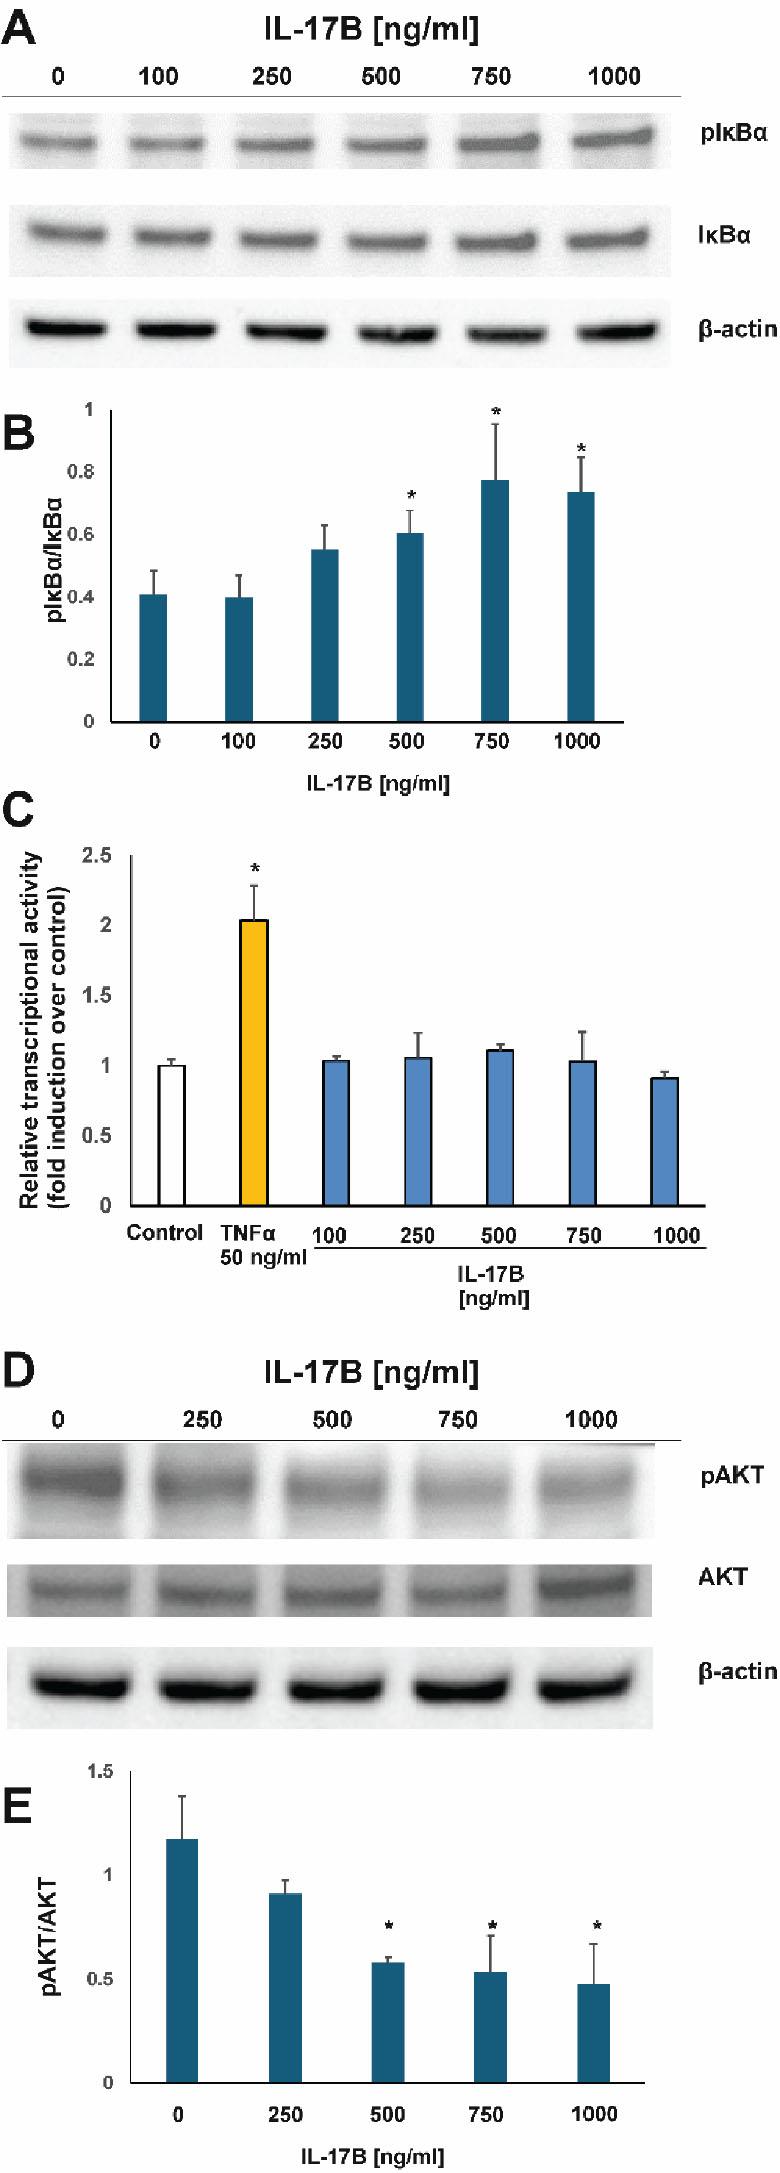
Fig 4.

Fig 5.

© 2025 Joanna Pastwińska, Iwona Karwaciak, Kaja Karaś, Daria Grabarczyk, Anna Sałkowska, Marcin Ratajewski, published by Hirszfeld Institute of Immunology and Experimental Therapy
This work is licensed under the Creative Commons Attribution-NonCommercial-NoDerivatives 4.0 License.