
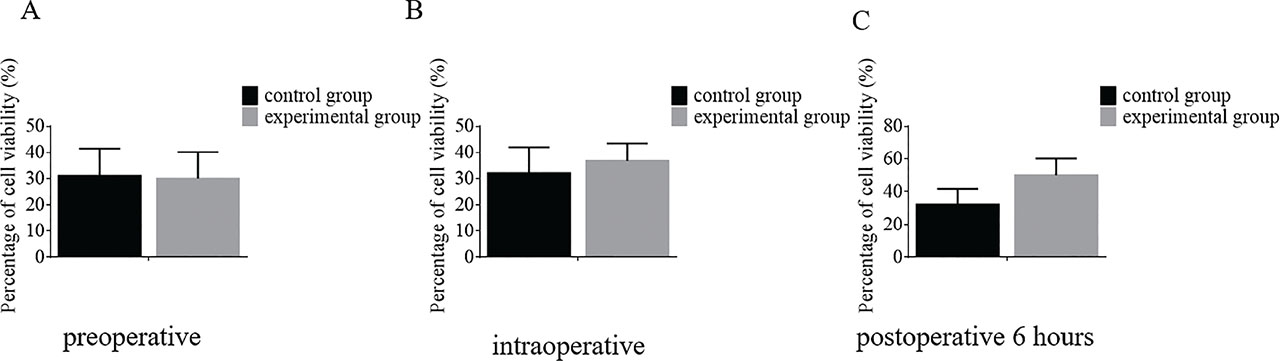
Fig 1.
The apoptosis levels in patients with HCC from different groups were detected at preoperative, intraoperative, and postoperative six points using the ATP cell viability detection assays. ATP, adenosine triphosphate; HCC, hepatocellular carcinoma.
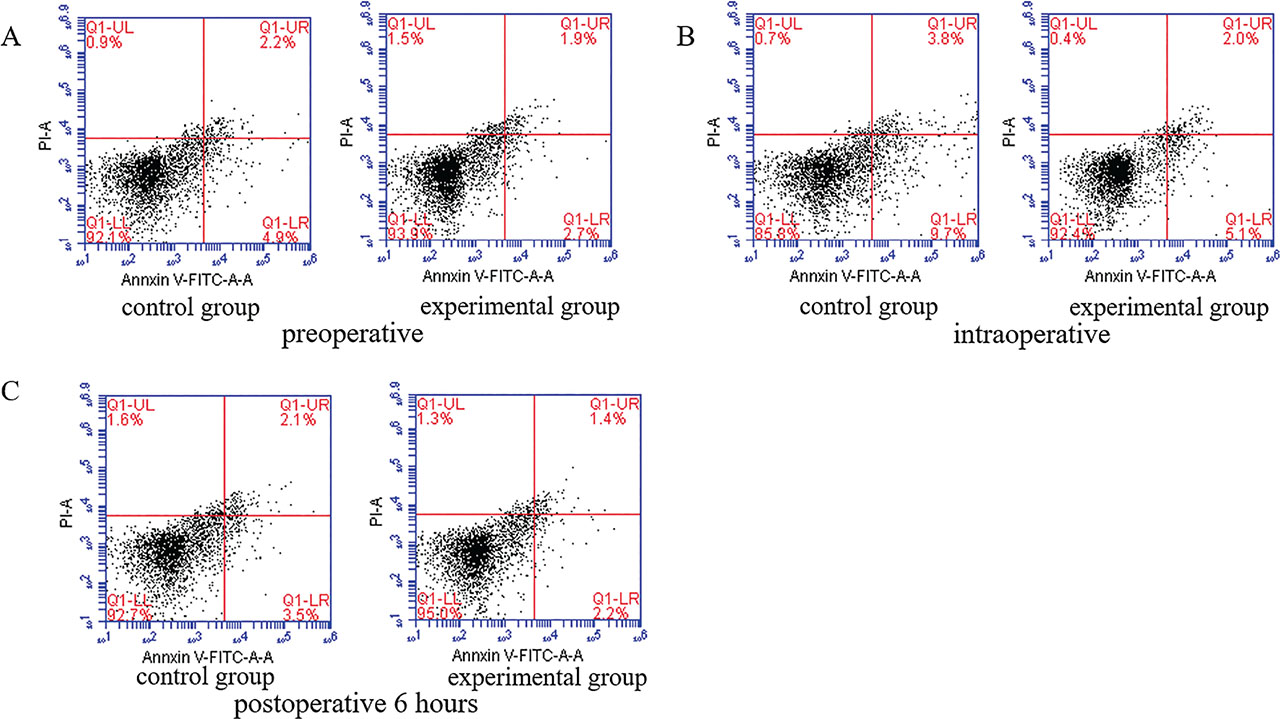
Fig 2.
The apoptosis levels in patients with HCC from different groups were detected at preoperative, intraoperative, and postoperative 6 h using flow cytometry assays. HCC, hepatocellular carcinoma.
Table 1.
Demographic, participants' general data
| Variable | Experimental group (N = 40) | Control group (N = 40) | χ2/t | P |
|---|---|---|---|---|
| Gender, male (%) | 24 (60%) | 22 (55%) | 0.331 | 0.565 |
| Age (years) | 65.4 (50.3–73.8) | 64.8 (50.4–74.5) | 0.319 | 0.750 |
| BMI (kg/m2) | 26.5 (24.1–29.3) | 26.9 (23.2–30.5) | −0.536 | 0.594 |
| Child-Pugh classification | 0.372 | 0.543 | ||
| A | 26 (65%) | 24 (60%) | ||
| B | 14 (35%) | 16 (40%) | ||
| TNM stage | 0.492 | 0.78 | ||
| I | 18 | 20 | ||
| II | 20 | 19 | ||
| III | 2 | 1 | ||
| IV | 0 | 0 | ||
| ALT (U/L) | 61.3 (41.1–82.3) | 61.8 (41.4–81.6) | −0.144 | 0.886 |
| AST (U/L) | 56.2 (40.2–76.1) | 55.6 (40.6–77.3) | 0.233 | 0.81 |
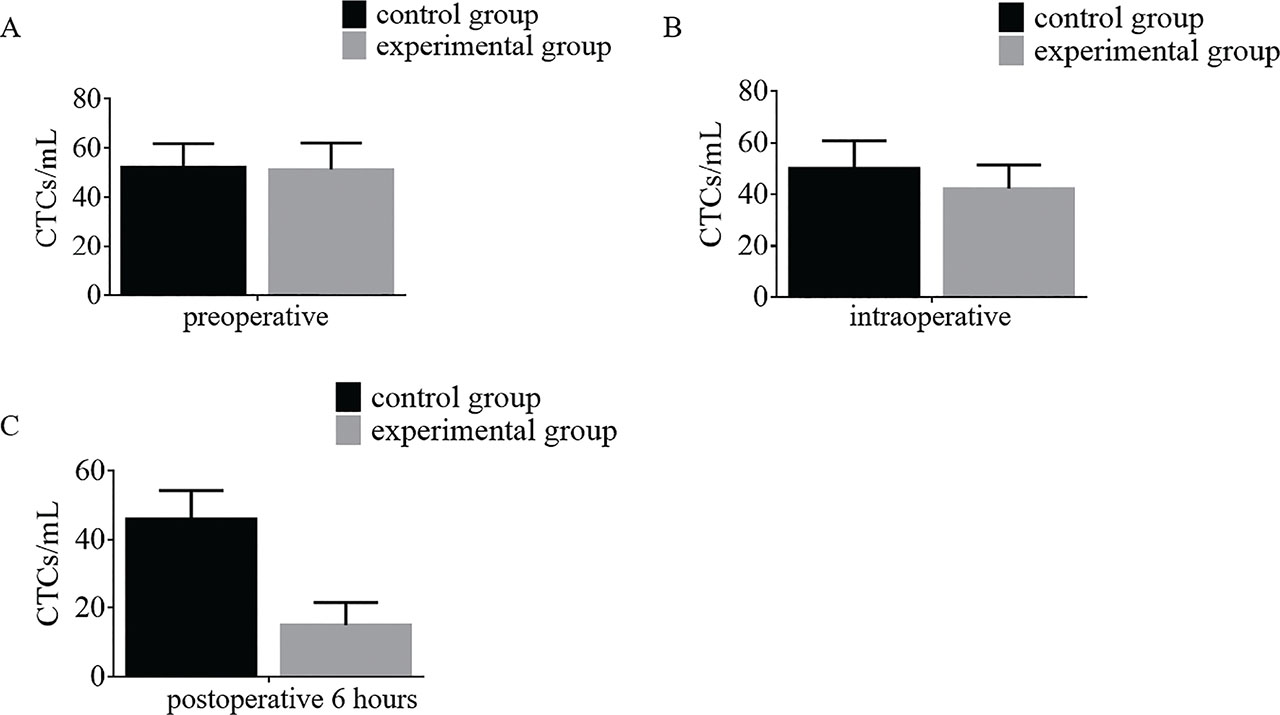
Fig 3.
The CTCs in patients with HCC from different groups were detected at preoperative, intraoperative, and postoperative 6 h using an immunomagnetic bead separation combined with flow cytometry assays. CTCs, circulating tumor cell; HCC, hepatocellular carcinoma.
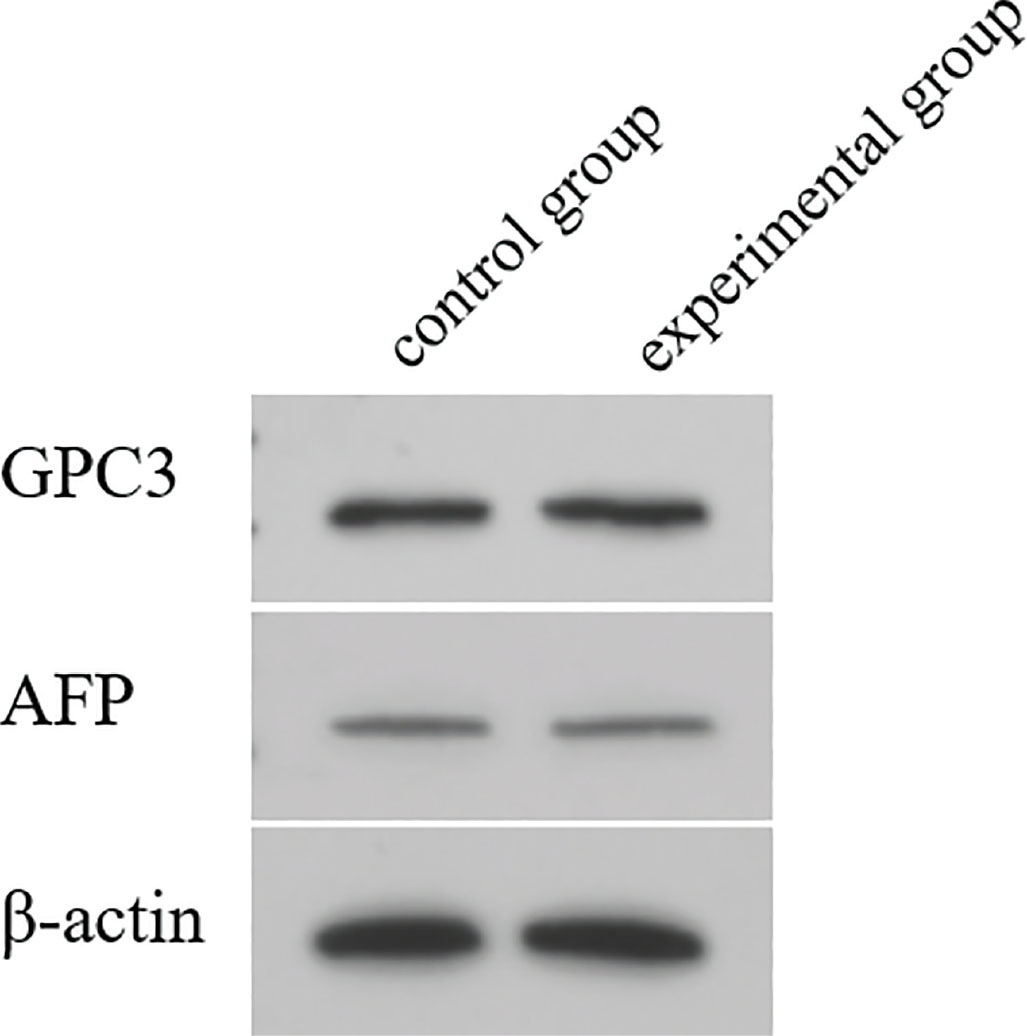
Fig 4.
The expression levels of AFP and GPC3 proteins in patients with HCC from different groups were determined at postoperative 6 h using Western blotting. HCC, hepatocellular carcinoma.
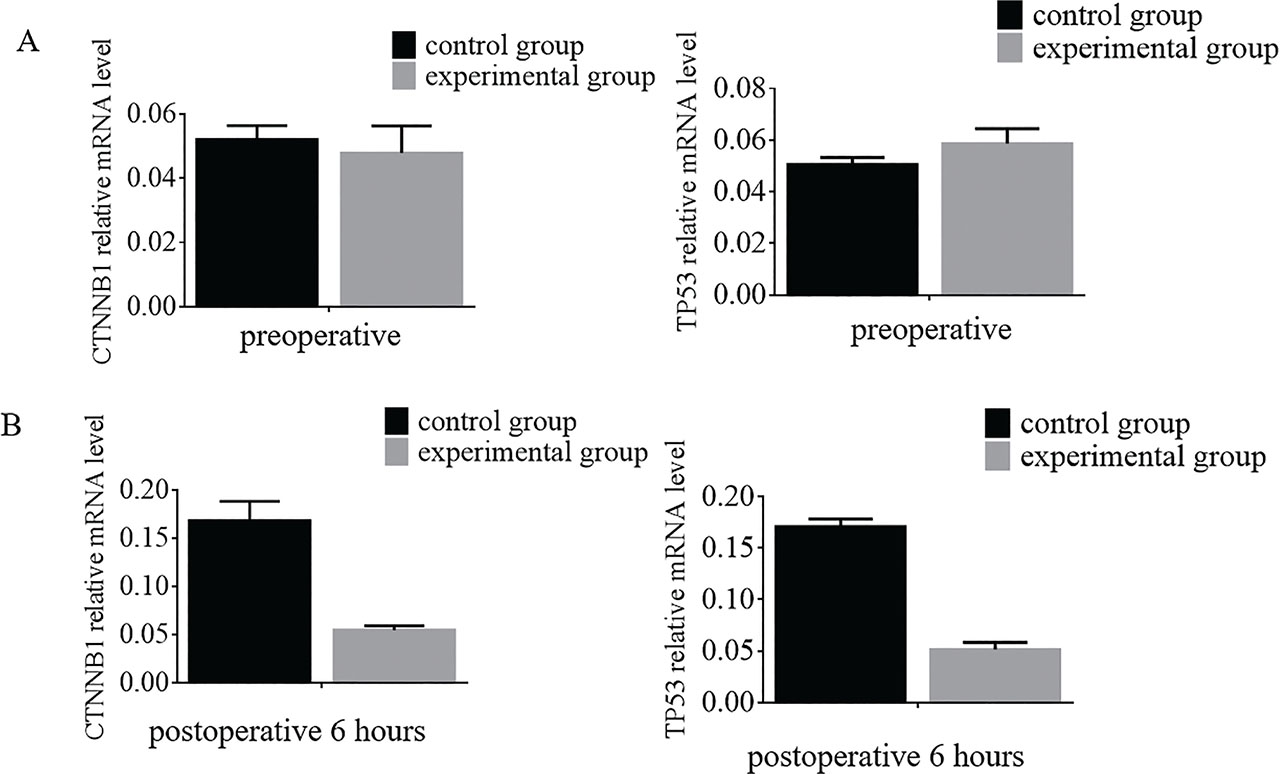
Fig 5.
The expression levels of CTNNB1 and TP53 mRNA in patients with HCC from different groups were determined at preoperative and postoperative 6 h using the qRT-PCR. HCC, hepatocellular carcinoma.
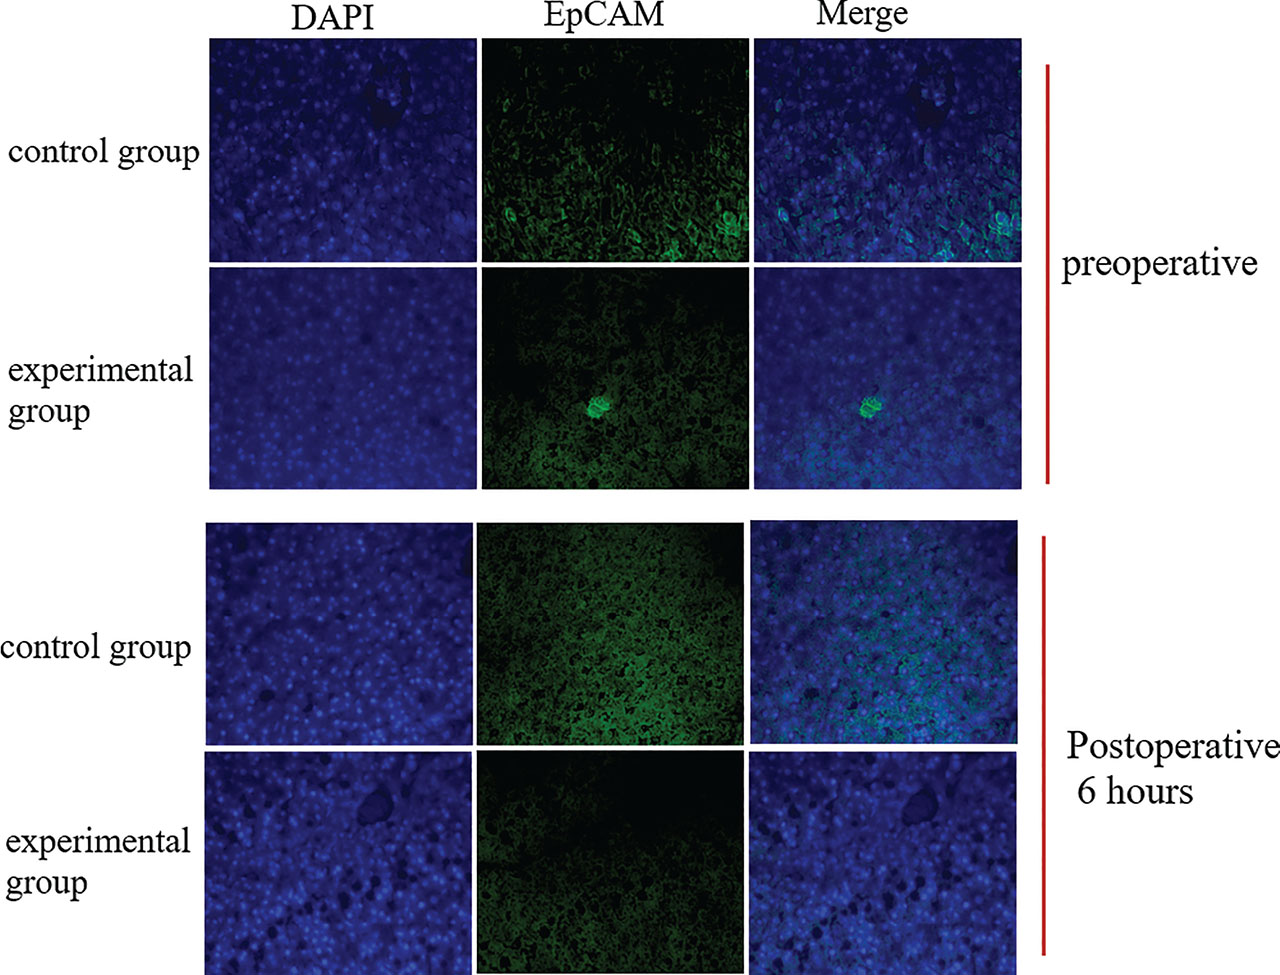
Fig 6.
The detection of EpCAM in patients with HCC from different groups at preoperative and postoperative 6 h time points, using an immunofluorescence assay. HCC, hepatocellular carcinoma.