
1. Introduction
Parkinson’s disease (PD) affects approximately 6 million people globally (Dorsey et al. 2018). Many individuals with Parkinsonism or tremor are often unrecognized or misdiagnosed, particularly in the early stages of the disease. Currently, the progression of PD is assessed based on clinical features, but validated biomarkers that are both sensitive and specific for detecting and tracking PD progression are lacking. This review focuses on the current understanding of diagnostic biomarkers and those associated with PD progression (Hall et al. 2015; Andersen et al. 2017).
There is an ongoing challenge in developing improved methods for diagnosing PD and measuring its progression. Despite significant efforts to identify biochemical indicators, reliable biomarkers with high specificity and sensitivity have remained elusive, even within cerebrospinal fluid, which is adjacent to neurodegeneration sites in the brain (Surguchov 2022). This issue extends to substances critical to PD pathophysiology, such as α-synuclein and dopamine metabolites, which do not consistently differentiate PD cases from controls (Gelpi et al. 2014).
A key challenge in biomarker discovery is determining the breadth of the search for PD indicators. Historically, PD pathology was believed to be confined to dopaminergic neurons in the substantia nigra, making a focus on reduced dopamine neurotransmission seem logical for defining and monitoring the disease. However, the manifestations of underlying PD proteinopathy, particularly α-synuclein aggregates, occur throughout the body. Research indicates that the bacterial population in the large intestine is altered in PD (Shen et al. 2021). Additionally, PD’s subcellular effects extend to mitochondria and the proteasome-lysosome system. Consequently, shifting the search to PD biomarkers to encompass the entire biochemical environment of the body appears promising (Derkinderen et al. 2014; Gelpi et al. 2014; Carvalho et al. 2015; Hall et al. 2015).
Metabolomics has emerged as one of the most effective technologies in recent biomarker research, capable of analyzing hundreds of low-molecular weight (<1.5 kDa) compounds in biological samples and characterizing a wide range of human metabolic environments. Independent analytical methods for identifying biomarkers do not rely on functional relationships between biochemicals, such as established metabolic pathways. However, subsequent analyses can evaluate whether biomarker results align with known pathways and can investigate common physicochemical properties, including indicators of oxidative stress (Caudle et al. 2010; Vilchez et al. 2014).
More than 1 million people in the United States and approximately 6 million people worldwide are affected by PD (Dorsey et al. 2018; Yang et al. 2020a,b). The disease is characterized by resting tremor, bradykinesia, cogwheel rigidity, and, in later stages, postural instability. Diagnosis is primarily based on clinical presentation. Recent studies indicate that even movement disorder specialists can misdiagnose the initial symptoms of PD in at least 10% of cases, while the misdiagnosis rate in primary care settings may reach as high as 50%. Patients misidentified as having PD in primary care often have conditions such as drug-induced tremor, essential tremor, or psychogenic tremor. In cases where patients exhibit parkinsonian symptoms without tremors, distinguishing between atypical Parkinsonism—such as multiple system atrophy or progressive supranuclear palsy—and PD can be challenging. Additionally, patients developing parkinsonian symptoms while taking dopamine-blocking agents may experience drug-induced Parkinsonism rather than PD (Lawton et al. 2008; Evans et al. 2009; Guo et al. 2015).
Biomarkers that assist clinicians in differentiating PD from essential tremor, drug-induced Parkinsonism from psychogenic tremor, and atypical Parkinsonism from PD and drug-induced Parkinsonism will be invaluable in clinical practice. These biomarkers can help prevent misdiagnoses, reduce unnecessary diagnostic procedures, and improve patient prognosis. While some biomarkers serve as diagnostic tools, others that track disease progression are vital for evaluating the effects of interventions on the course of PD, demonstrating findings such as “neuroprotective” or “disease-modifying” impacts. Currently, the gold standard for assessing PD progression is clinical scales, including the Unified Parkinson’s Disease Rating Scale (Hiller et al. 2009; Guo et al. 2015). Certain biomarkers may also aid in selecting the most effective therapy for patients by predicting potential responses to various medications, thereby allowing for tailored disease-modifying or symptomatic treatments. The concept of “personalized medicine” for PD patients—using pharmacogenetic, biochemical, and clinical methods—is becoming increasingly plausible, especially given its application in cancer chemotherapy studies and in determining optimal initial dosing for warfarin therapy (Hiller et al. 2009). Modern analytical techniques are known for their high sensitivity, precision, accuracy, and reproducibility (Lawton et al. 2008; Drexler et al. 2011). Among the most widely used methods are nuclear magnetic resonance (NMR) spectroscopy and mass spectrometry (MS) (Peironcely et al. 2011; Gelpi et al. 2014). MS works by measuring the mass- to-charge ratio of ions, which enables the identification of specific substances (Kozioł et al. 2023). When combined with chromatographic techniques, MS has led to the development of two powerful methods for analyzing chemical compounds in body fluids: gas chromatography coupled with mass spectrometry (GC-MS) and liquid chromatography coupled with mass spectrometry (LC-MS). Although these techniques are highly effective for metabolite analysis, they can present challenges in data interpretation. For example, the simultaneous elution of compounds with similar molecular masses and polarities can make them difficult to distinguish. Additionally, the “matrix effect” can interfere with metabolite detection, where the composition of the sample matrix alters the results, leading to potential inaccuracies in measurement and reduced reproducibility (Drexler et al. 2011; Kozioł et al. 2023). Despite these challenges, MS remains a highly specific and sensitive method for selectively detecting metabolites and has found widespread use in fields such as drug detection (Lawton et al. 2008).
NMR is considered one of the best techniques for studying urine metabolites and is particularly effective for identifying chemical compounds excreted by the kidneys (Peironcely et al. 2011; Gelpi et al. 2014). NMR can detect a wide range of metabolites, but MS is generally regarded as the more effective method for identifying larger numbers of metabolites—sometimes up to several thousand. Additionally, NMR does not alter the chemical structure of compounds during analysis, unlike GC-MS and LC-MS, which can cause modifications to the substances being studied (Caudle et al. 2010; Kozioł et al. 2023).
Each of these methods has its limitations and potential sources of error. Therefore, combining both NMR and MS is often recommended to provide a more comprehensive analysis of metabolomics in body fluids (Derkinderen et al. 2014; Gelpi et al. 2014; Hall et al. 2015; Andersen et al. 2017). Metabolomics techniques are increasingly being applied across various fields of medicine, particularly in oncology and in the study of metabolic diseases and their underlying pathomechanisms.
2. Materials and Methods
2.1. Study design
The review was designed based on the PRISMA declaration (Page et al. 2021). The databases Scopus, Web of Science, PubMed, and Embase were systematically reviewed to identify relevant articles. Given the limited number of articles retrieved during the preliminary search, broader search parameters were implemented using the query “Parkinson AND NMR AND metabolites”. Following the synthesis of search results, non-English publications, duplicate entries, and non-original research articles were excluded. Subsequently, the titles, abstracts, and full texts of the remaining articles were thoroughly examined. A detailed breakdown of the data across each stage of the review process is presented in Figure 1. The review of manuscripts, evaluation of inclusion and exclusion criteria, and assessment of risk of bias were conducted independently by two authors. Discrepancies or borderline cases were resolved by a third author with extensive experience in the field. The risk of bias was evaluated using the ROBINS-I tool (Sterne et al. 2016), with final decisions in cases of conflict determined independently by the author with the longest tenure in scientific research.
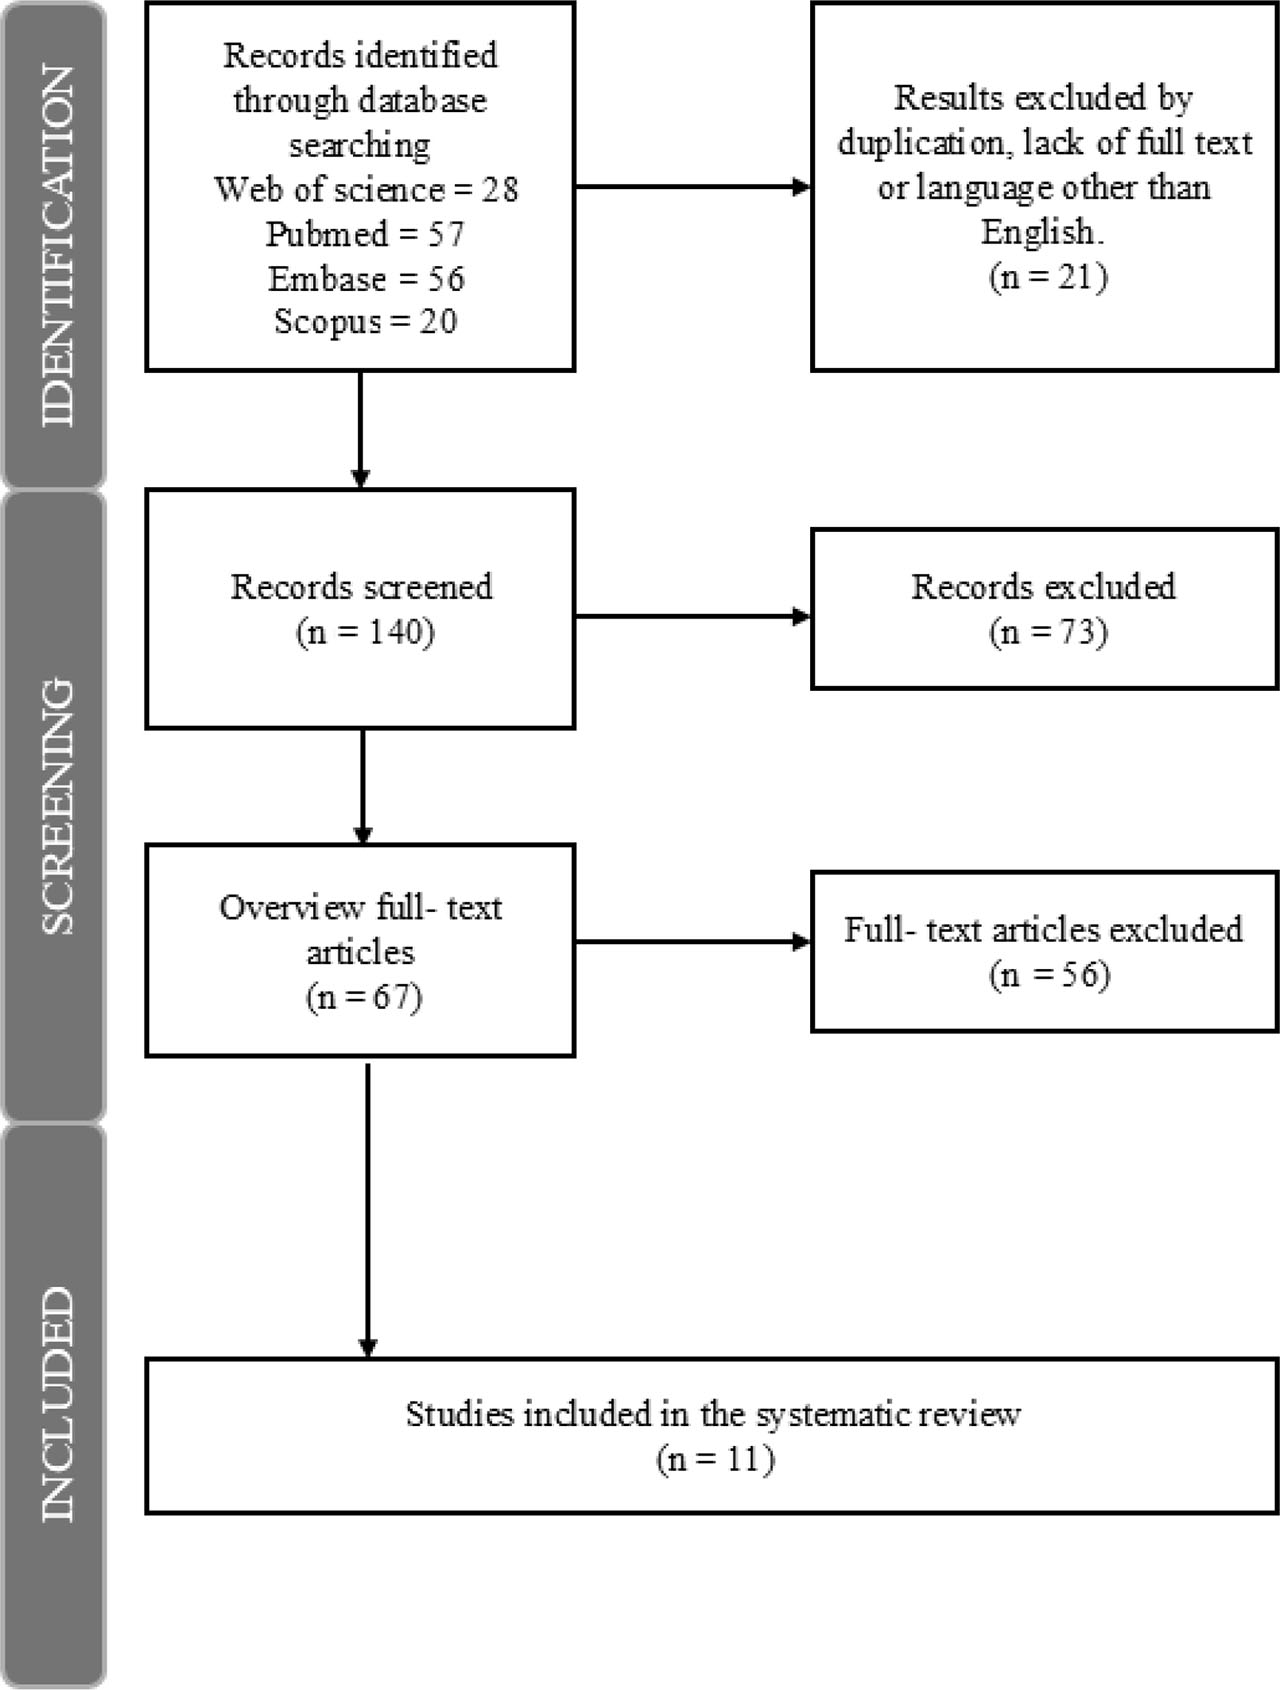
Fig 1.
Search strategy: PRISMA flow diagram.
2.2. Inclusion and exclusion criteria for the review
2.2.1. Inclusion criteria
Population: Studies involving people diagnosed with PD with reference to the criteria for its diagnosis. Studies involving animal models of PD.
Metabolomic analysis: Studies using 1H-NMR spectroscopy as the primary analytical technique for determining metabolites, Studies that provide metabolomic profiles that identify changes in metabolites associated with PD.
Outcome measures: Studies focusing on metabolite identification or quantification by 1H-NMR. Studies focusing on biomarkers or metabolomic signatures in the diagnosis, progression, or therapy of PD.
Timeline: Studies published in the past 20 years.
2.2.2. Exclusion criteria
Population: Studies in which PD is a secondary condition (e.g., PD-like symptoms caused by other underlying diseases, such as drug-induced Parkinsonism). Studies without a comparison group.
Exclusion: Studies on cell cultures.
Metabolomic analysis: Studies that do not use 1H-NMR spectroscopy to profile metabolites (e.g., studies using only MS and gas chromatography). Studies in which 1H-NMR is used only for quantification or is not directly related to metabolomic analysis.
Study design: Case reports, narrative reviews, and opinion pieces. Studies with insufficient data or incomplete information on methods or results. Meta-analyses or systematic reviews that do not meet inclusion criteria. Studies without clear statistical analysis or methodology to validate results.
Outcome measures: Studies that do not report metabolomic data (e.g., those that focus solely on clinical measures without metabolomic profiling).
Language and accessibility: Studies not available in English or without available full-text publications (e.g., behind pay-walls without access by the institution).
2.3. Data analysis and software
Data retrieved from the database review were exported in .xml and .rdf file formats. Microsoft Excel and Zotero (Center for History and New Media, George Mason University) were utilized for data management and organization.
3. Results
The data from 11 selected manuscripts were included in the final synthesis, and key metabolites were identified from them. The reproducibility of these findings is evaluated in Table 1. The full synthesis is included in Table S1 in Supplementary Materials. Most components of the bias risk assessment were rated as low risk. Three ratings indicated significant risk, primarily due to insufficient information to confirm a low bias risk in specific areas. Despite this, the conclusions of these articles aligned with those rated more favorably, and other components did not raise significant concerns. Therefore, no articles were excluded due to bias risk. Detailed assessments are provided in Table S2 in Supplementary Materials.
Following a review of the results, the data were synthesized to identify key metabolites associated with the progression of PD, as summarized in Table 1. Based on the analyzed data, five metabolites were selected. These metabolites, along with their corresponding pathways and an evaluation of reproducibility, are detailed in Table 2. The summary provided in Tables 1 and 2 does not include the data from Meoni et al. (2022), which did not identify a characteristic differentiating metabolite. Instead, the study suggests that the sequence of metabolites serves as the distinguishing factor.
4. Discussion
This study focused on 1H-NMR spectroscopy, emphasizing its key distinctions from MS. Unlike MS, NMR spectroscopy— commonly proton NMR—does not destroy the sample, enabling subsequent analyses using other methods. Additionally, each NMR measurement includes a standard reference substance, enhancing reliability. Consequently, NMR spectroscopy is often preferred for its lower costs associated with quantitative testing and more frequent use in certain applications compared with MS. Furthermore, body fluid samples generally require minimal preparation for NMR analysis, although lipid testing necessitates an extraction step (Kozioł et al. 2023). The analysis of the metabolites identified in this study provides crucial insights into the pathophysiology of PD. Table 2 highlights key metabolites and their associated pathways, emphasizing their roles in disease progression and the underlying biochemical disruptions in PD. Glutamate is a key metabolite implicated in the pathophysiology of PD, primarily through its role in glial dysfunction, which leads to glutamate-induced excitotoxicity—a major contributor to neurodegeneration. This aligns with evidence showing that altered glutamate receptor activity disrupts neuronal excitability, neurotransmitter release, and long-term synaptic plasticity. These findings highlight the pivotal role of glutamate in PD’s neurochemical mechanisms and suggest that targeting glutamate signaling could reduce excitotoxic damage, presenting a promising therapeutic avenue (Zhang et al. 2019; Iovino et al. 2020).
Taurine was identified as another significant metabolite, closely linked to oxidative stress. The depletion of taurine due to elevated reactive oxygen species generation correlates with its role in regulating enzymes of cysteine synthesis, a process disrupted in PD. The association between oxidative stress and neurodegeneration in PD is well-documented, suggesting that therapeutic strategies targeting taurine levels could ameliorate oxidative damage. However, the moderate reproducibility of taurine findings highlights the need for further validation in larger cohorts (Dias et al. 2013).
Table 1.
Identified key metabolites
| References | Key metabolites |
|---|---|
| Salek et al. (2008) | Myo-inositol**, creatine*/phosphocreatine, taurine**, choline, phosphocholine, glutamate*** |
| Graham et al. (2018) | Trans 4-hydroxypoline, c14:1, c12:1, pc ae c34:0, c14:2-oh. |
| Yang et al. (2020a,b) | Glutamate***, glutamine**, aspartate, and myo-inositol** |
| Toczylowska et al. (2020) | Acetate, acetone, 3-hydroxybutyrate, l-lysine, glutamate***, tyrosine, phenylalanine, testosterone, 1-mag, glutamine** |
| Villeneuve et al. (2016) | Alanine*, aspartate, creatine* and glycerophosphocholine, myo-inositol**, taurine** |
| Kumari et al. (2020a) | Ornithine, isoleucine, and b-hydroxybutyrate |
| Solana-Manrique et al. (2022) | Alanine*, aspartate, glutamate***, phenylalanine, tyrosine |
| Lu et al. (2018) | Glutamate***, N-acetylaspartate, myo-inositol** and taurine** |
| Kumari et al. (2020b) | Trimethylamine N-oxide, acetate, citrate, gpc, alanine*, glycine, glutamine** |
| Zheng et al. (2016) | GABA, glutamate***, glutamine**, lactate, N-acetylaspartate, creatine*, taurine**, myo-inositol** |
Excl. Meoni et al. (2022) —due to the lack of distinctive metabolites; repeatability for 10 studies:
Table 2.
The role of identified metabolites in the pathophysiology of PD
| Metabolite | Pathway |
|---|---|
| Glutamate*** | Glial dysfunction contributes to glutamate-induced excitotoxicity, driving neurodegeneration in PD (Iovino et al. 2020). Glutamate receptors play a crucial role in regulating neuronal excitability, transmitter release, and long-term synaptic plasticity, and they are also implicated in altered neurotransmission (Zhang et al. 2019). |
| Taurine** | Reduced regulation of cysteine synthesis enzymes, along with the consumption of taurine as a metabolite, occurs due to increased reactive oxygen species generation (Dias et al. 2013). |
| Myo-inositol** | The metabolite myo-inositol-1,4,5-triphosphate (IP3) is linked to the mTOR signaling pathway that regulates autophagy (Motoi et al. 2014). |
| Glutamine** | A precursor amino acid of glutamate (Zhang et al. 2019; Iovino et al. 2020). |
| Creatine* | Neuronal energy pathway (Chaturvedi and Beal 2013). |
Myo-inositol, particularly its derivative myo-inositol-1,4,5- triphosphate (IP3), is implicated in the dysregulation of autophagy via the mTOR signaling pathway. Autophagy deficits in PD result in the accumulation of misfolded proteins and dysfunctional organelles, exacerbating neuronal damage. This positions myo-inositol as a potential biomarker and therapeutic target (Motoi et al. 2014).
The role of glutamine as a precursor for glutamate further illustrates the interconnected nature of these metabolites. Disruptions in glutamine metabolism may exacerbate glutamate excitotoxicity, reinforcing the need for metabolic homeostasis in PD management (Zhang et al. 2019; Iovino et al. 2020). Creatine, another identified metabolite, highlights the energy deficit characteristic of PD. As a key player in neuronal energy metabolism, creatine’s involvement suggests that energy-targeting therapies, such as supplementation, may mitigate disease progression (Chaturvedi and Beal 2013). However, its low reproducibility (3/10 studies) necessitates further exploration.
The reproducibility of these findings varied, with glutamate detected in ≥5/10 studies, taurine and myo-inositol in 4–5/10 studies, and creatine in 3/10 studies. These variations underscore the complexity of the PD metabolomic landscape and the importance of integrating metabolomics with other omics approaches to achieve a more comprehensive understanding of PD pathogenesis.
In conclusion, the identified metabolites provide valuable insights into the molecular mechanisms underlying PD. Glutamate emerges as a central contributor to neurodegeneration, while taurine, myo-inositol, glutamine, and creatine elucidate additional pathological mechanisms, including oxidative stress, autophagy dysfunction, and energy deficits. Future research should aim to validate these findings and explore targeted therapeutic interventions, potentially offering novel approaches to slow the progression of PD.
Abbreviations
- 1H-NMR:
Proton Nuclear Magnetic Resonance;
- 1-MAG:
1-Monoacylglycerol;
- CTR:
control;
- DI-LC-MS/MS:
Direct Injection Liquid Chromatography-Tandem Mass Spectrometry;
- GABA:
Gamma-Aminobutyric Acid;
- GGC:
Gamma-Glutamylcysteine;
- GPC:
Glycerophosphocholine;
- HC:
Healthy Control;
- IP3:
Inositol 1,4,5-Trisphosphate;
- LID:
Levodopa-Induced Dyskinesia;
- MPTP-HCL:
1-Methyl-4-phenyl-1,2,3,6-tetrahydropyridine Hydrochloride;
- mTOR:
mammalian target of rapamycin;
- NAA:
N-Acetylaspartate;
- PC:
Phosphatidylcholine;
- PINK1:
PTEN-Induced Kinase 1;
- PRISMA:
Preferred Reporting Items for Systematic Reviews and Meta-Analyses;
- RT-PCR:
Reverse Transcription Polymerase Chain Reaction;
- TCA:
Tricarboxylic Acid;
- VMAT2:
Vesicular Monoamine Transporter 2.
Notes
[11] Authors’ Contributions
Conceptualization: A.W.; Methodology: A.W.; Data analysis: A.W., E.W., A.S.; Writing – original draft: A.W., A.S.; Writing – review and editing: E.W.
Notes
Supplementary Materials
Table S1.
Data synthesis
| References | Tested material | Control | Analysis method | Sample size | Key metabolites | Conclusion |
|---|---|---|---|---|---|---|
| Salek et al. (2008) | Samples of cerebellum, cortex, hippocampus, substantia nigra, and striatum from VMAT2-deficient mice. | Age-matched wild-type mice (n = 24) | 1H-NMR | 17 | The substantia nigra consistently exhibited metabolic changes across all time points, with decreased myo-inositol, creatine/phosphocreatine, taurine, choline, and phosphocholine, and increased glutamate compared with control mice. | NMR-based metabolomics differentiated the five brain regions by metabolic profiles across three ages, revealing that VMAT2 reduction impacts metabolism in unaffected tissues and distinguishing hemizygotes from wild-type mice metabolically. |
| Graham et al. (2018) | Brain and serum were biochemically profiled in a mouse model of synucleinopathy induced by α-synuclein fibril injection. | Age-matched control huMonomers mice (n = 18) | 1H-NMR,DI- LCMS/MS | 20 | Top five identify metabolites: trans-4-hydroxyproline, C14:1, C12:1, PC ae C34:0, and C14:2-OH. | These techniques are effective for studying synucleinopathy in mice, supporting longitudinal studies on brain biochemistry during progression. Biomarkers require validation in humans to assess utility for Parkinson's disease risk identification. A total of 71 brain metabolites and 182 serum metabolites were accurately identified and quantified using 1H-NMR and targeted MS, respectively. |
| Yang et al. (2020a,b) | Rats were randomly assigned to LID (n = 10) and PD (n = 10) groups. Metabolite analysis was performed from the mid-brain, cortex, striatum, hippocampus, cerebellum, and hypothalamus. | Rats with saline intervention performed (n = 8) | 1H-NMR, RT-PCR | 20 | Glutamate, glutamine, aspartate, and myo-inositol were identified as key discriminating metabolites. | Results suggest that metabolic disruption of the synaptic Glu-Gln-GABA cycle may underlie the onset of PD and dyskinesia. |
| Toczylowska et al. (2020) | Patients with PD (based on MDS Clinical Diagnostic Criteria for Parkinson's Disease), venous blood samples were collected after overnight fasting and post-levodopa night dose (10:00 PM to 3:00 AM), with serum stored at −80°C until metabolomics analysis. | Healthy volunteers (n = 21) | 1H-NMR | 19 | Increase: acetate, acetone, 3-hydroxybutyrate, L-lysine, glutamate, tyrosine, and phenylalanine Decrease: testosterone, 1-MAG, and glutamine | The presented in vitro and in vivo metabolic profiling methods could monitor serum and brain biochemical changes in future PD therapeutic studies, particularly for evaluating disease-modifying strategies. |
| Villeneuve et al. (2016) | Experiments were conducted using PINK1 knockout rat strains. Brain tissue analysis. | LEH rats (n = 6) | 1H-NMR, MS | 6 | In the cortex, alanine, aspartate, creatine, and glycerophosphocholine varied over time. Only myo-inositol was lower in PINK1 KO animals. In the striatum, alanine, creatine, lactate, and myo-inositol changed over time. Genotypic differences were found in aspartate, taurine, and creatine levels in PINK1 KO animals, with significant changes at specific time points. | These results are critical, revealing late-stage PD abnormalities, such as elevated proton leak and depressed taurine levels, present in asymptomatic stages. This research may enable targeting early processes for pre-movement diagnosis and interventions to halt PD progression. |
| Kumari et al. (2020b) | Idiopathic PD patient (UKPDBB criteria and H&Y scale), urine sample analysis. | Healthy controls (n = 50) | 1H-NMR | 100 | Increased concentrations of ornithine, isoleucine, and β-hydroxybutyrate were observed in both early and advanced PD groups compared with the HC group. | A distinct metabolic pattern in urine samples reveals impairments in ornithine, branched-chain amino acid, citrate cycle, and aromatic amino acid metabolism in PD patients. Metabolite concentration associations with clinical parameters suggest its potential as a biomarker for distinguishing PD patients and evaluating disease severity. |
| Solana-Manrique et al. (2022) | Drosophila melanogaster DJ-1βex54- PD model. | Drosophila melanogaster y1,w1118 (n = 15) | 1H-NMR | 15 | Several important metabolites have been identified. The most important of which are: glycerophospholipid metabolism, alanine, aspartate, and glutamate; citrate cycle (TCA cycle); phenylalanine, tyrosine and tryptophan biosynthesis; phenylalanine metabolism. | Loss of DJ-1β function causes metabolic alterations in amino acid metabolism, glycolysis, and the TCA cycle in PD model flies, potentially contributing to PD pathophysiology and serving as therapeutic targets. Amino acid disturbances may also serve as biomarkers for PD stages, requiring further validation in other preclinical models. |
| Lu et al. (2018) | Male C57BL/6 mice were injected intraperitoneally (i.p.) 30 mg/kg MPTP-HCl – PD model. Brain tissue analysis. | Male C57BL/6 mice received an equal volume of normal saline (n = 30) | 1H-NMR | 30 | Glutamate, N-acetylaspartate, myo-inositol, and taurine | Results suggest that neuron loss and motor impairment in PD are linked to overactive GGC and altered membrane metabolism, leading to excitotoxicity and mitochondrial dysfunction. Changes in NAA, mI, and Tau may reflect compensatory and pathogenic mechanisms. |
| Meoni et al. (2022) | De novo drug-naïve PD (UK Brain Bank Criteria) patients training cohort; blood samples were collected between 8:00 AM and 9:00 AM. | Healthy controls (CTR) (n = 79) | 1H-NMR | 228 | Looking at the discrimination between the two male groups (dn2 PD and CTR), all the selected metabolites and lipoproteins have a probability between 68.4% and 80.2% to distinguish case (dn2 PD) from the control (CTR) group. A model based on the concentrations of 27 metabolites and 111 lipoproteins was built to assess its performance in discriminating male dn2 PD patients and male CTR subjects. | Serum changes associated with increased oxidative stress in early PD, detectable in metabolites and lipoproteins, suggest accelerated aging in PD, linking oxidative stress to aging, a key risk factor for PD. Further studies are needed to investigate oxidative stress and PD pathogenesis in the CNS, with an identified interaction between gender and metabolism. |
| Kumari et al. (2020a) | PD-model rats serum analysis; patients in various stages of PD serum analysis | (n = 6) and healthy human (n = 50) | 1H-NMR | Rats: 6 Human: 256 | Trimethylamine N-oxide, acetate, citrate, GPC, alanine, glycine, glutamine | This study reveals distinct metabolic profiles in PD serum compared with controls, identifying altered pathways such as amino acid, energy, and lipid metabolism, the gut microbiota system, and the TCA cycle. Metabolomic signatures, including amino acids, lipids, and microbiota-derived metabolites, may serve as diagnostic markers for PD, highlighting the human microbiome as a potential risk factor. |
| Zheng et al. (2016) | Rats with PD treated with bFGF (n = 10) or saline (n = 10); Brain tissue analysis. | Rats without PD, saline was administered (n = unclear) | 1H-NMR | 20 | GABA, glutamate, glutamine, lactate, N-acetylaspartate, creatine, taurine, myo-inositol | bFGF treatment may restore PD-induced metabolic changes to a normal metabolic state in rats. |
Table S2.
Risk of bias
| References | C1 | C2 | C3 | C4 | C5 | C6 | C7 |
|---|---|---|---|---|---|---|---|
| Salek et al. (2008) | M | L | L | L | M | L | L |
| Graham et al. (2018) | L | L | L | L | L | L | L |
| Yang et al. (2020a,b) | L | L | L | L | L | M | L |
| Toczylowska et al. (2020) | L | L | L | L | L | L | L |
| Villeneuve et al. (2016) | M | M | L | L | S | M | M |
| Kumari et al. (2020b) | M | L | L | L | M | L | L |
| Solana-Manrique et al. (2022) | L | L | L | L | L | L | L |
| Lu et al. (2018) | L | L | M | L | M | L | M |
| Meoni et al. (2022) | S | M | L | L | L | L | S |
| Kumari et al. (2020a) | M | M | L | L | L | L | L |
| Zheng et al. (2016) | L | M | L | L | S | L | L |
|
| ||||||