Fig 1.

Fig 2.

Fig 3.
Clinical characteristics of patients with RA treated with baricitinib: GR and MR
| Month 0 | Month 3 | |||
|---|---|---|---|---|
| GR, n = 8 | MR, n = 10 | GR, n = 8 | MR, n = 10 | |
| DAS28-ESR | 5.52 ± 0.2 (5.1–6.9) | 6.1 ± 0.3 (5.1–8.2) | 2.8 ± 0.1 (2.2–3.1) | 4.2 ± 0.2 (3.3–5.0) |
| VAS, activity (mm) | 78.1 ± 4.7 (52.0–95.0) | 74.1 ± 4.2 (63.0–91.0) | 30.1 ± 2.6 (17.0–41.0) | 50.3 ± 5.4 (28.0–82.0) |
| Joints, painful (n) | 13.0 ± 1.7 (6–24) | 13.1 ± 2.1 (6–24) | 2.1 ± 0.4 (0–4) | 3.0 ± 1.0 (0–10) |
| Joints, tender (n) | 7.0 ± 1.2 (2–13) | 7.5 ± 2.1 (1–22) | 0.4 ± 0.2 (0–2) | 1.5 ± 0.8 (0–8) |
| CRP (mg/dL) | 12.5 ± 6.1 (1.0–45.0) | 31.2 ± 11.8 (2.0–132) | 3.0 ± 0.9 (0.2–7.0) | 11.9 ± 5.8 (1.0–62.5) |
| ESR (mm/h) | 18.12 ± 6.3 (5.0–60.0) | 33.0 ± 7.8 (5.0–94.0) | 11.9 ± 4.3 (4.0–44.0) | 43.8 ± 11.0 (8.0–120.0) |
| DD (ng/mL) | 1263.75 ± 410.1 (240.0–3757.0) | 1639.2 ± 550.5 (386.0–6381.0) | 636.8 ± 114.5 (105.0–2379.0) | 1149.8 ± 336.8 (105.0–3279.0) |
| Fibrinogen (mg/dL) | 389.6 ± 48.8 (239.0–614.0) | 427.1 ± 37.6 (284.0–671.0) | 377.13 ± 33.1 (295.0–552.0) | 401.10 ± 36.5 (261.0–581.0) |
| HCY (µmol/L) | 9.7 ± 0.7 (7.2–11.9) | 8.7 ± 0.7 (3.3–10.4) | 11.4 ± 0.6 (8.2–13.5) | 10.2 ± 0.9 (5.4–13.6) |
| ATIII (%) | 117.6 ± 5.2 (100.0–138.0) | 105.3 ± 3.6 (94.0–119.0) | 129.0 ± 3.0 (121.0–141.0) | 113.50 ± 3.2 (94.0–135.0) |
| TT (s) | 11.48 ± 0.3 (10.6–12.8) | 10.88 ± 0.4 (9.8–14.7) | 10.83 ± 0.5 (8.5–12.6) | 12.13 ± 0.6 (9.2–15.6) |
| APTT (s) | 31.0 ± 1.1 (27.4–35.7) | 31.1 ± 0.9 (27.4–35.7) | 30.25 ± 0.6 (27.8–32.4) | 33.14 ± 1.0 (28.2–39.2) |
| PT (s) | 11.7 ± 0.2 (11.1–12.5) | 11.9 ± 0.4 (9.6–13.7) | 11.7 ± 0.3 (10.8–13.2) | 12.1 ± 0.3 (10.9–14.2) |
| INR | 1.11 ± 0.02 (1.05–1.18) | 1.12 ± 0.04 (0.91–1.29) | 1.1 ± 0.03 (1.02–1.24) | 1.14 ± 0.03 (1.03–1.34) |
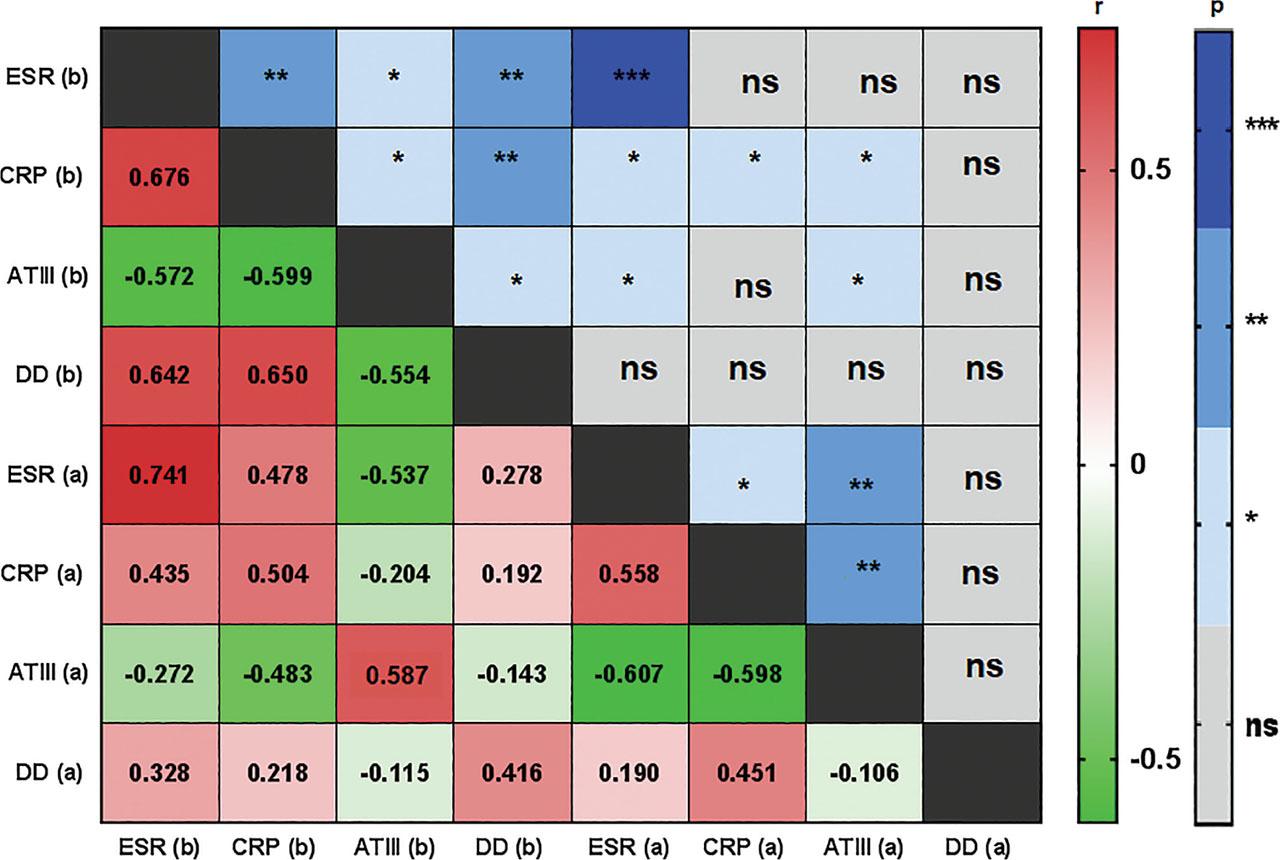
Correlation between the chosen parameters of thrombosis and clinical data
| Before treatment | r | p-value | |
|---|---|---|---|
| ATIII | DAS28 | –0.696 | 0.003 |
| ATIII | CRP | –0.599 | 0.013 |
| ATIII | ESR | –0.572 | 0.018 |
| ATIII | RF | –0.601 | 0.012 |
| ATIII | DD | –0.554 | 0.023 |
| DD | DAS28 | 0.526 | 0.025 |
| DD | CRP | 0.65 | 0.003 |
| DD | ESR | 0.642 | 0.004 |
| DD | RF | 0.582 | 0.011 |
| DD | Fibrinogen | 0.623 | 0.006 |
| DD | Homocysteine | 0.540 | 0.021 |
| Fibrinogen | CRP | 0.721 | 0.001 |
| Fibrinogen | ESR | 0.800 | <0.001 |
| Fibrinogen | RF | 0.529 | 0.024 |
| Fibrinogen | ATIII | –0.513 | 0.035 |
| TT | CRP | –0.631 | 0.005 |
| TT | ESR | –0.575 | 0.013 |
| TT | RF | –0.574 | 0.013 |
| After treatment | |||
| ATIII | DAS28 | –0.686 | 0.002 |
| ATIII | CRP | –0.598 | 0.009 |
| ATIII | ESR | –0.607 | 0.008 |
| APTT | ESR | 0.485 | 0.041 |
| Fibrinogen | ESR | 0.483 | 0.042 |
Demographic and clinical characteristics of GR and MR to baricitinib treatment
| Characteristic | GR, (n = 8) | MR (n = 10) | Difference, p-value |
|---|---|---|---|
| Demographics | |||
| Sex (female), n (%) | 7 (87.5) | 10 (100) | ns |
| Age (years), mean (±SD) | 50 (±12.9) | 53.3 (±13.4) | ns |
| BMI (kg/m2), mean (±SD) | 25 (±3.6) | 24.6 (±4.2) | ns |
| CV risk factors | |||
| Smokinga, n (%) | 1 (12.5) | 3 (27.3) | ns |
| Dyslipidemiab, n (%) | 6 (75) | 7 (63.6) | ns |
| Arterial hypertension, n (%) | 2 (25) | 3 (27.3) | ns |
| Diabetes mellitus, n (%) | 1 (12.5) | 0 (0) | ns |
| Hormonal contraception | 0 (0) | 1 (9.1) | ns |
| RA status | |||
| Disease duration (years), mean (±SD) | 8.3 (±7.4) | 9.5 (±9.3) | ns |
| RF (IU/mL), mean (±SD) | 107.5 (±113) | 248.2 (±231.6) | ns |
| ACPA (U/mL), mean (±SD) | 473.2 (±59.8) | 404.8 (±184.1) | ns |
| RA treatment | |||
| Previous biologic therapy, n (%) | 2 (25) | 1 (9.1) | ns |
| GCs, n (%) | 3 (37.5) | 8 (72.7) | ns |
| dose (mgc), mean (±SD) | 5 (2.5) | 4.7 (±1.6) | ns |
| cDMARDs, n (%) | 6 (75) | 8 (72.7) | ns |
| Methotrexate, n (%) | 5 (62.5) | 8 (72.7) | ns |
| Sulfasalazine, n (%) | 2 (25) | 3 (27.3) | ns |
| Hydroxychloroquine, n (%) | 3 (37.5) | 2 (18.2) | ns |
| Disease activity | |||
| DAS28-ESR, mean (±SD) | 5.5 (±0.6) | 6.1 (±1.1) | ns |
| VAS pain (mm), mean (±SD) | 78.1 (14.2) | 74.1 (±8.8) | ns |
| Joints (painful), mean (±SD) | 13 (±5.2) | 13.1 (±7) | ns |
| Joints (tender), mean (±SD) | 7 (±3.6) | 7.5 (±7.1) | ns |
| CRP (mg/L), mean (±SD) | 12.5 (18.4) | 31.2 (±39.2) | ns |
| ESR (mm/h), mean (±SD) | 18.1 (±18.9) | 33 (±25.9) | ns |
Demographic and clinical characteristics between RA patients and HC
| Characteristic | RA patients, (n = 18) | HC (n = 20) | Difference, p-value |
|---|---|---|---|
| Demographics | |||
| Sex (female), n (%) | 17 (94.4) | 12 (60) | p = 0.02 |
| Age (years), mean (±SD) | 51.9 (±3.0) | 44.0 (±3.2) | ns |
| BMI (kg/m2), mean (±SD) | 24.8 (±3.8) | 25.9 (±3.5) | ns |
| CV risk factors | |||
| Smokinga, n (%) | 4 (22.2) | 3 (15) | ns |
| Dyslipidemiab, n (%) | 13 (72.2) | 6 (30) | p = 0.02 |
| Arterial hypertension, n (%) | 5 (27.8) | 5 (25) | ns |
| Diabetes mellitus, n (%) | 1 (5.6) | 0 (0) | ns |
| Hormonal contraception, n (%) | 1 (5.6) | 1 (5) | ns |
| RA status | |||
| Disease duration (years), mean (±SD) | 10.14 (±1.5) | ||
| ACPA (U/mL), mean (±SD) | 312.6 (±55.0) | ||
| RF (IU/mL), mean (±SD) | 160.2 (±46.3) | ||
| RA treatment | |||
| Previous biologic therapy, n (%) | 3 (16.7) | ||
| GCs, n (%) dose (mgc), mean (±SD) | 11 (61.1) 3.1 ± 0.6 | ||
| cDMARDs, n (%) | 14 (77.8) | ||
| Methotrexate, n (%) | 13 (72.2) | ||
| Sulfasalazine, n (%) | 5 (27.8) | ||
| Hydroxychloroquine, n (%) | 5 (27.8) | ||
| Disease activity | |||
| DAS28-ESR, mean (±SD) | 5.8 ± 0.2 | ||
| VAS pain (mm), mean (±SD) | 75.9 ± 2.7 | ||
| Joints (painful), mean (±SD) | 13.1 ± 1.4 | ||
| Joints (tender), mean (±SD) | 7.3 ± 1.3 | ||
| CRP (mg/L), mean (±SD) | 22.9 ± 7.6 | ||
| ESR (mm/h), mean (±SD) | 26.4 ± 5.6 | ||