
Table 1.
The characteristics of the groups of the study
| Parameter | Groups | |||
|---|---|---|---|---|
| RSV(+) | SARS-CoV-2(+) | RSV(+) SARS-CoV-2(+) | RSV(−) SARS-CoV-2 (−) | |
| N | 14 | 17 | 11 | 6 |
| Sex M/F | 6/8 | 12/5 | 5/6 | 2/4 |
| Ethnicity | Caucasian | Caucasian | Caucasian | Caucasian |
| Age median | 9 | 9 | 8 | 8 |
| Age range | 7–12 | 6–12 | 7–12 | 7–12 |
| BCG vaccination | 100% | 100% | 100% | 100% |
| Leukocytes (tys/μL) | 8.27 | 7.55 | 8.64 | 9.42 |
| Erythrocytes (mln/μL) | 4.75 | 4.83 | 4.81 | 5.26 |
| Hemoglobin (g/dL) | 13.29 | 12.76 | 13.52 | 13.43 |
| Hematocrit (%) | 39.00 | 38.93 | 39.50 | 39.15 |
| MCV (fl) | 82.21 | 77.76 | 82.36 | 74.50 |
| MCH (pg) | 28.00 | 28.04 | 28.18 | 25.50 |
| MCHC (g/dL) | 34.06 | 50.62 | 34.21 | 34.17 |
| Platelets (tys/μL) | 306.29 | 304.71 | 333.18 | 424.83 |
| RDW-SD (fl) | 38.82 | 36.04 | 38.90 | 37.02 |
| RDW-CV (%) | 13.16 | 12.18 | 13.15 | 14.03 |
| PDW (fl) | 11.57 | 12.46 | 11.41 | 10.22 |
| MPV (fl) | 10.06 | 10.15 | 10.04 | 9.25 |
| P-LCR (%) | 25.64 | 25.98 | 25.47 | 19.40 |
| PCT (%) | 0.34 | 0.32 | 0.35 | 0.40 |
| Neutrophils (%) | 49.23 | 45.74 | 51.69 | 52.48 |
| Lymphocytes (%) | 35.66 | 35.96 | 34.43 | 33.68 |
| Monocytes (%) | 9.45 | 8.63 | 8.65 | 6.82 |
| Eosinophils (%) | 5.18 | 7.79 | 4.75 | 5.30 |
| Basophils (%) | 0.36 | 0.55 | 0.35 | 0.58 |
[i] BCG, bacillus Calmette–Guérin; MCH, mean corpuscular hemoglobin; MCHC, mean corpuscular hemoglobin concentration; MCV, mean corpuscular volume; MPV, mean platelet volume; N, number; PCT, procalcitonin; PDW, platelet distribution width; P-LCR, platelet-large cell ratio; RDW-CV, red blood cell distribution width – coefficient of variation; RDW-SD, red blood cell distribution width-standard deviation; RSV, respiratory syncytial virus; SARS-CoV-2, severe acute respiratory syndrome coronavirus 2.
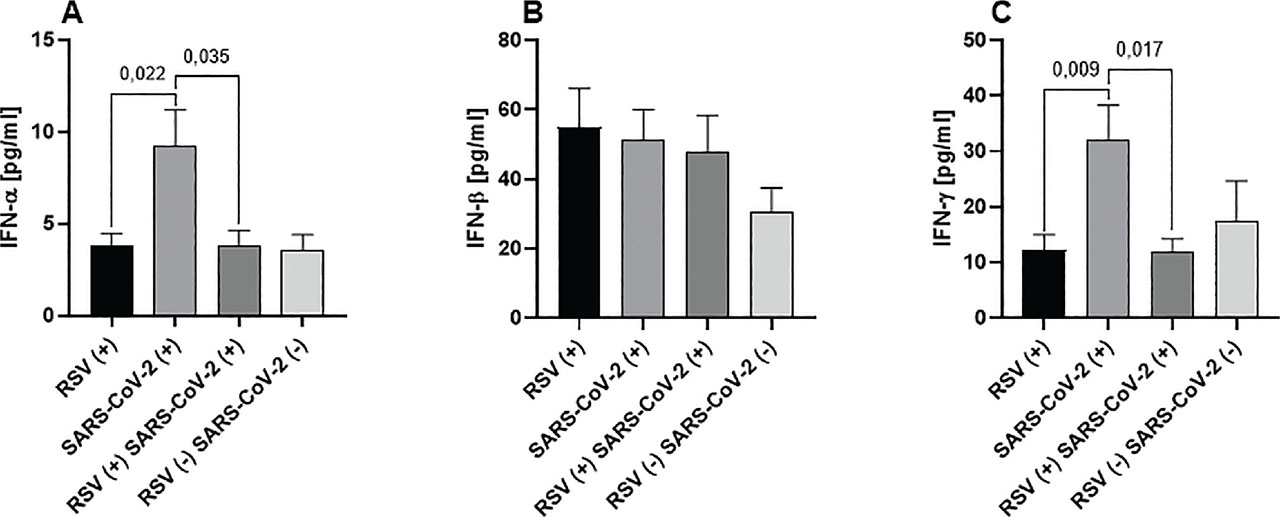
Fig 1.
The serum level of IFN-α (A), IFN-β (B), and IFN-γ (C) in the study groups. Differences in the levels of IFN-α, IFN-β, and IFN-γ concentrations between the studied groups were compared using the nonparametric Kruskal–Wallis two-way ANOVA with Dunn’s post-test. A p-value was considered significant if <0.05. A result of > 0.05 was not statistically significant. IFN, interferon; RSV(−) SARS-CoV-2(−), group seronegative for RSV and SARS-CoV-2; RSV(+) SARS-CoV-2(+), group seropositive for RSV and SARS-CoV-2; RSV(+), group seropositive for RSV infection; RSV, respiratory syncytial virus; SARS-CoV-2(+), group seropositive for SARS-CoV-2; SARS-CoV-2, severe acute respiratory syndrome coronavirus 2.
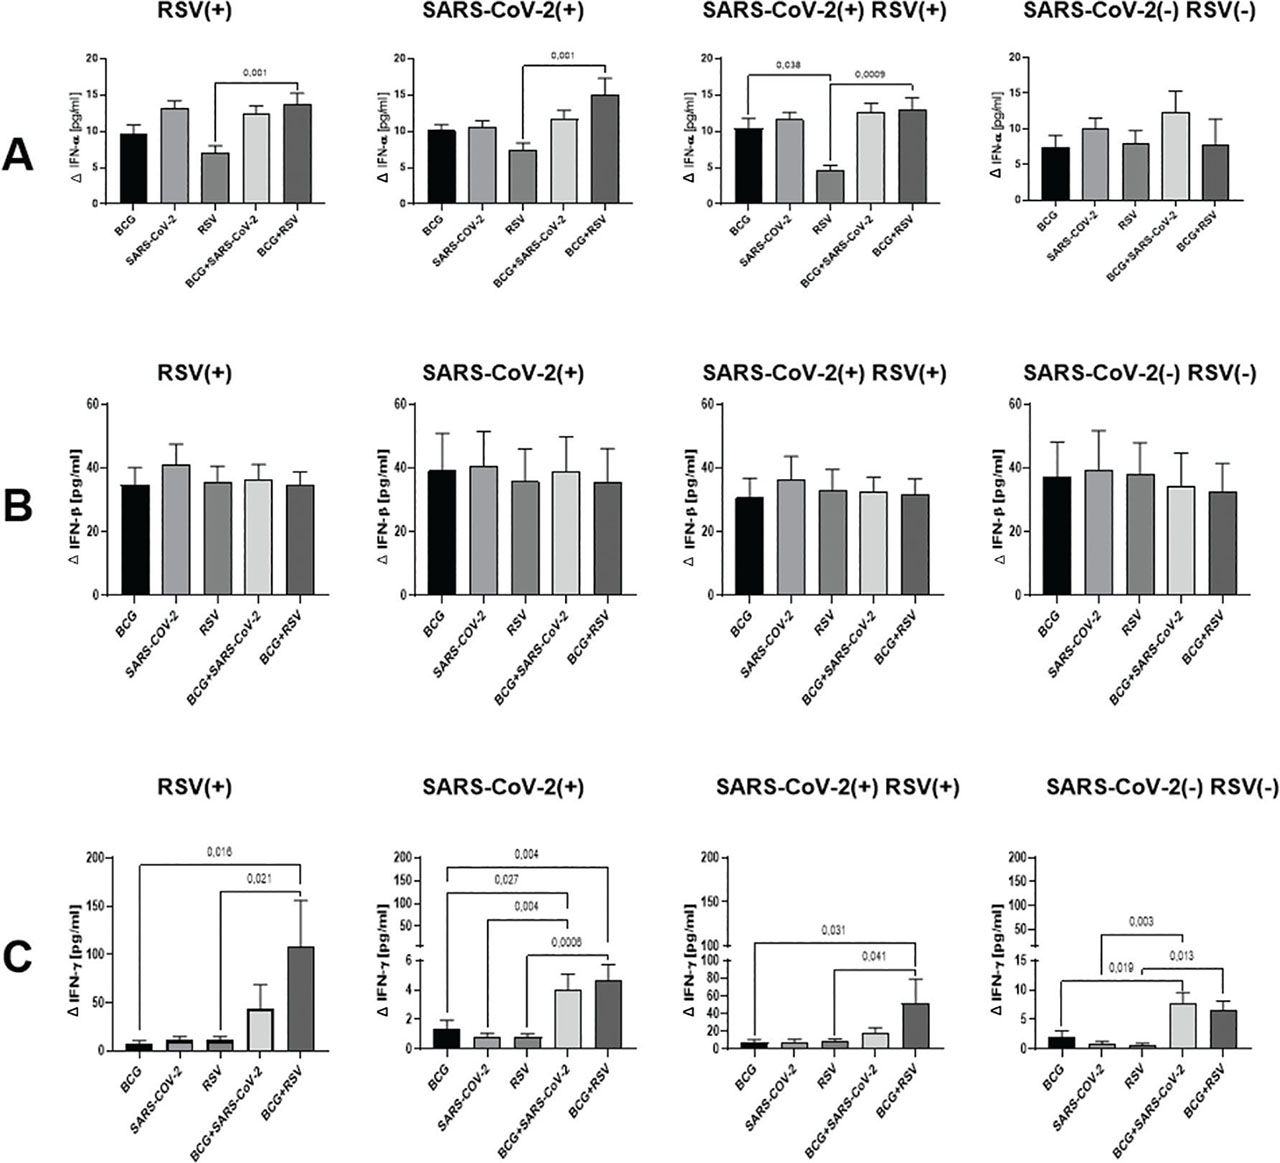
Fig 2.
Levels of IFN-α (A), IFN-β (B), and IFN-γ (C) in cell culture supernatants across study groups. The values depicted in the graphs represent the differences in cytokine levels between the stimulated and unstimulated cultures. The value on the y-axis is the delta value relative to the unstimulated control sample. Differences in the levels of IFN-α, IFN-β, and IFN-γ concentrations between the studied groups were compared using the non-parametric Kruskal–Wallis two-way ANOVA with Dunn’s post-test. A p-value was considered significant if <0.05. BCG, bacillus Calmette–Guérin; IFN, interferon; RSV(−) SARS-CoV-2(−), group seronegative for RSV and SARS-CoV-2; RSV(+) SARS-CoV-2(+), group seropositive for RSV and SARS-CoV-2; RSV(+), group seropositive for RSV infection; RSV, respiratory syncytial virus; SARS-CoV-2(+), group seropositive for SARS-CoV-2; SARS-CoV-2, severe acute respiratory syndrome coronavirus 2.
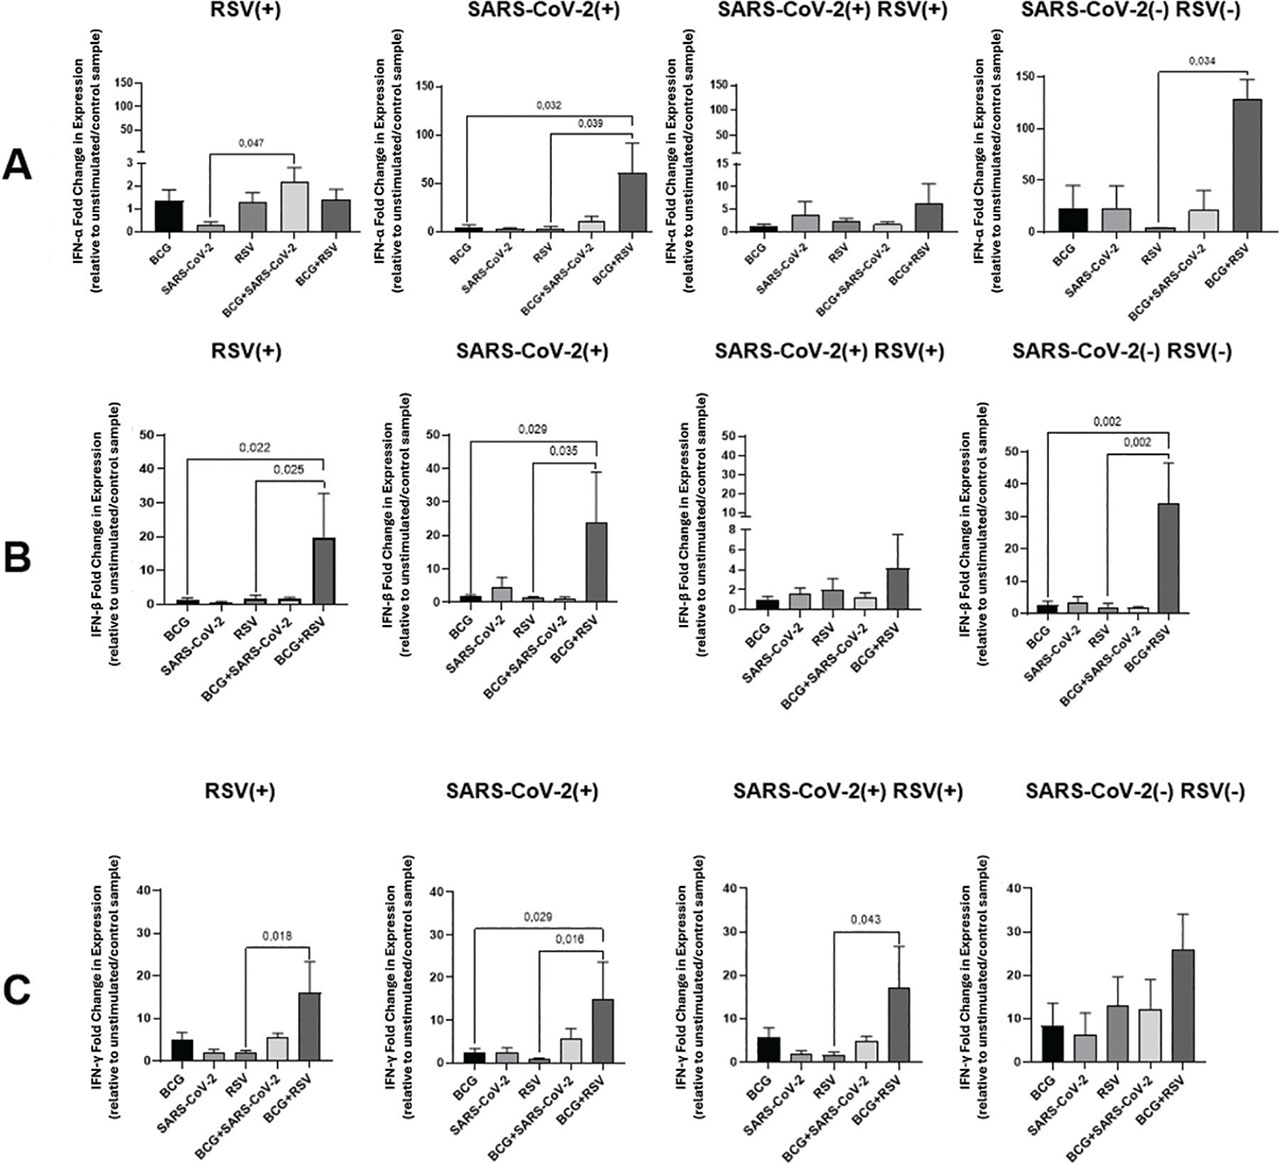
Fig 3.
Differential expression of IFN-A5 mRNA (A), IFN-β mRNA (B), and IFN-γ mRNA (C) in co-stimulated cultures with BCG and viral antigens among study groups. The values depicted in the graphs represent the differences in cytokine levels between the stimulated and unstimulated cultures. The value on the y-axis is the fold change from the unstimulated control. Differences in the levels of IFN-γ concentrations between the studied groups were compared using the nonparametric Kruskal–Wallis two-way ANOVA with Dunn’s post-test. A p-value was considered significant if <0.05. BCG, bacillus Calmette–Guérin; IFN, interferon; IFNA5, interferon-alpha 5; RSV(+), group seropositive for RSV infection; RSV(+)SARS-CoV-2(+), group seropositive for RSV and SARS-CoV-2; RSV(−)SARS-CoV-2(−), group seronegative for RSV and SARS-CoV-2; RSV, respiratory syncytial virus; SARS-CoV-2(+), group seropositive for SARS-CoV-2; SARS-CoV-2, severe acute respiratory syndrome coronavirus 2.
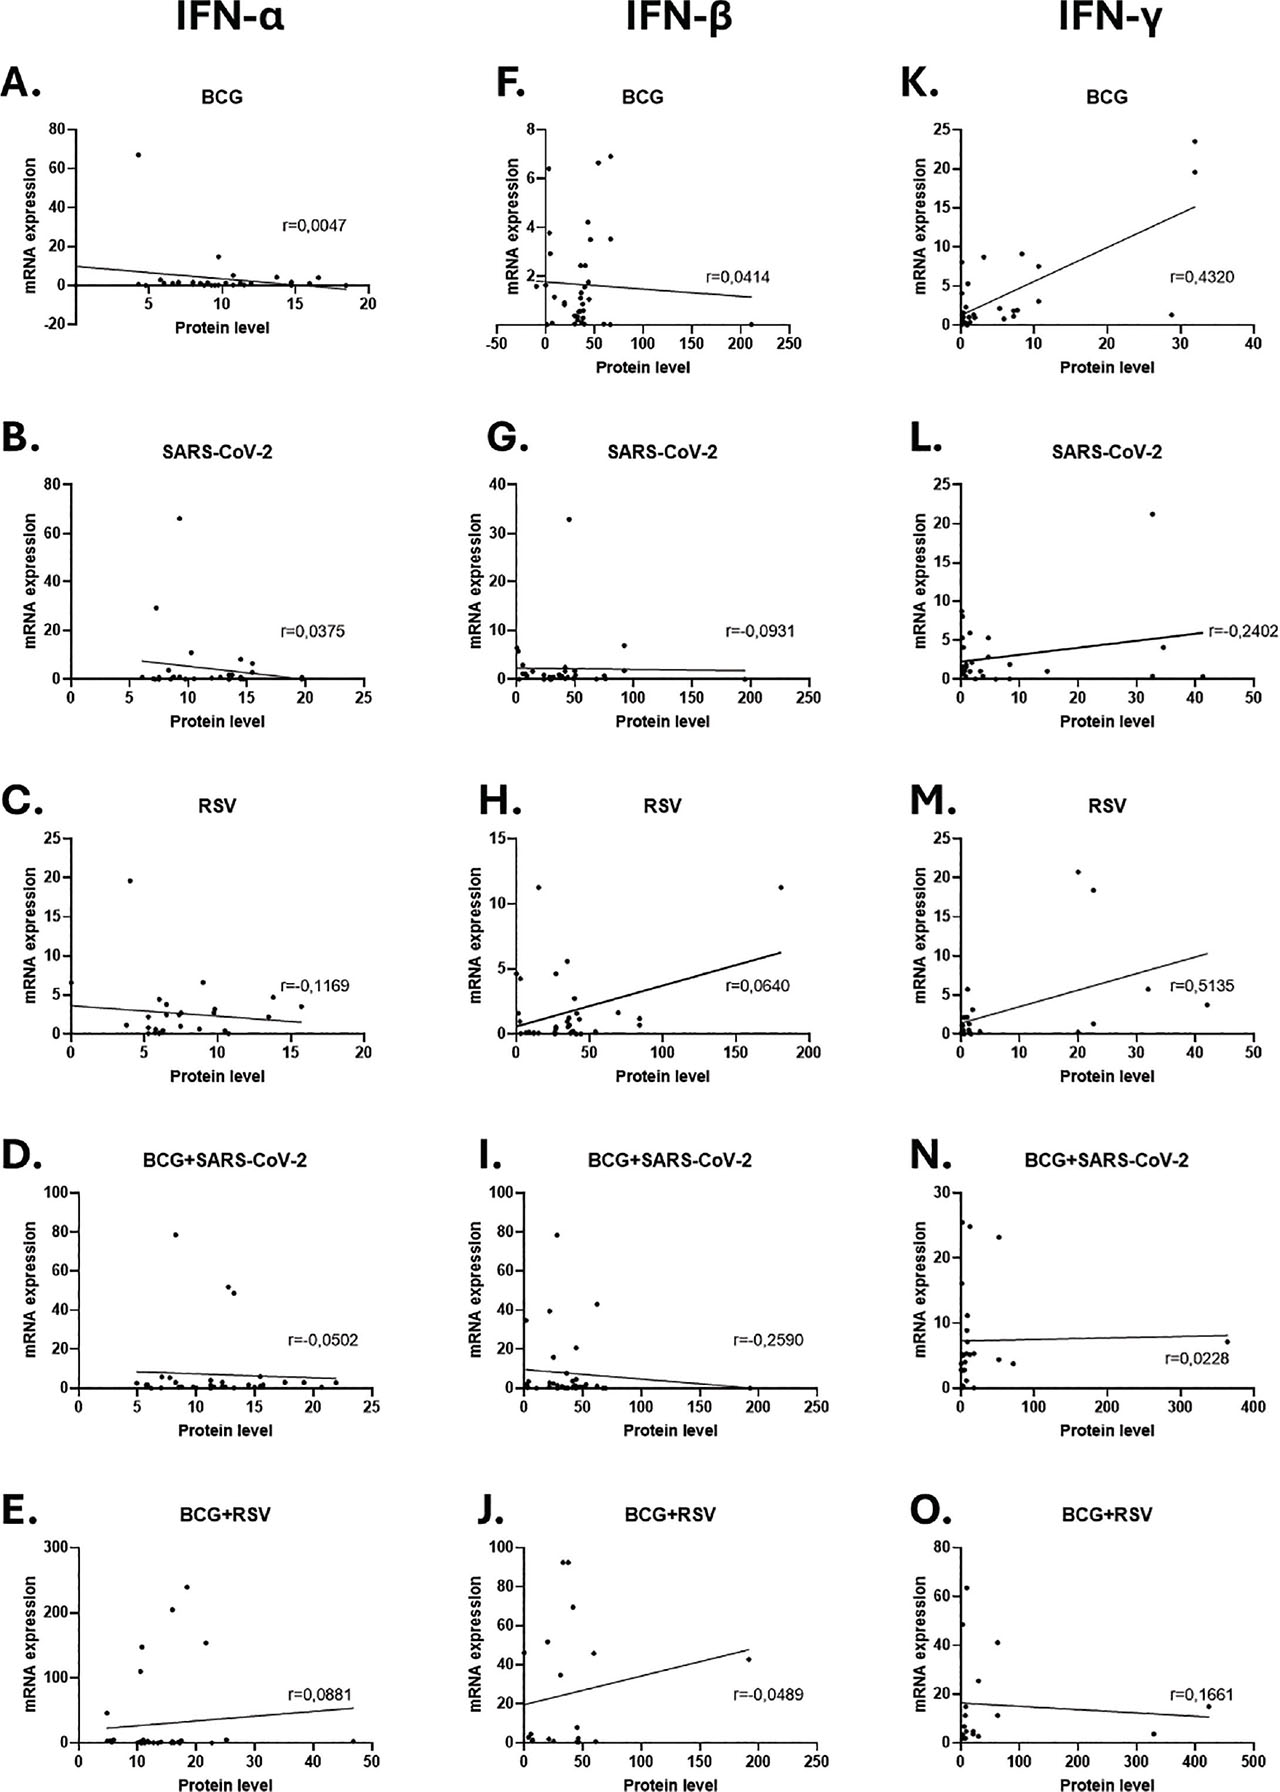
Fig 4.
Correlation between mRNA expression and IFNs level in co-stimulated cultures with BCG and viral antigens among study groups. The correlation between mRNA expression and IFN level was analyzed using the Spearman’s correlation test. BCG, bacillus Calmette–Guérin; IFN, interferon; RSV, respiratory syncytial virus; SARS-CoV-2, severe acute respiratory syndrome coronavirus 2. IFN-α mRNA expression in whole blood cultures stimulated with antigens: A-BCG, B-SARS-CoV-2, C-RSV, D-BCG+SARS-CoV-2, E-BCG+RSV. IFN-β mRNA expression in whole blood cultures stimulated with antigens: F-BCG, G-SARS-CoV-2, H-RSV, I-BCG+SARS-CoV-2, JBCG+RSV. IFN-γ mRNA expression in whole blood cultures stimulated with antigens: K-BCG, L-SARS-CoV-2, M-RSV, N-BCG+SARS-CoV-2, O-BCG+RSV.