
Fig 1.
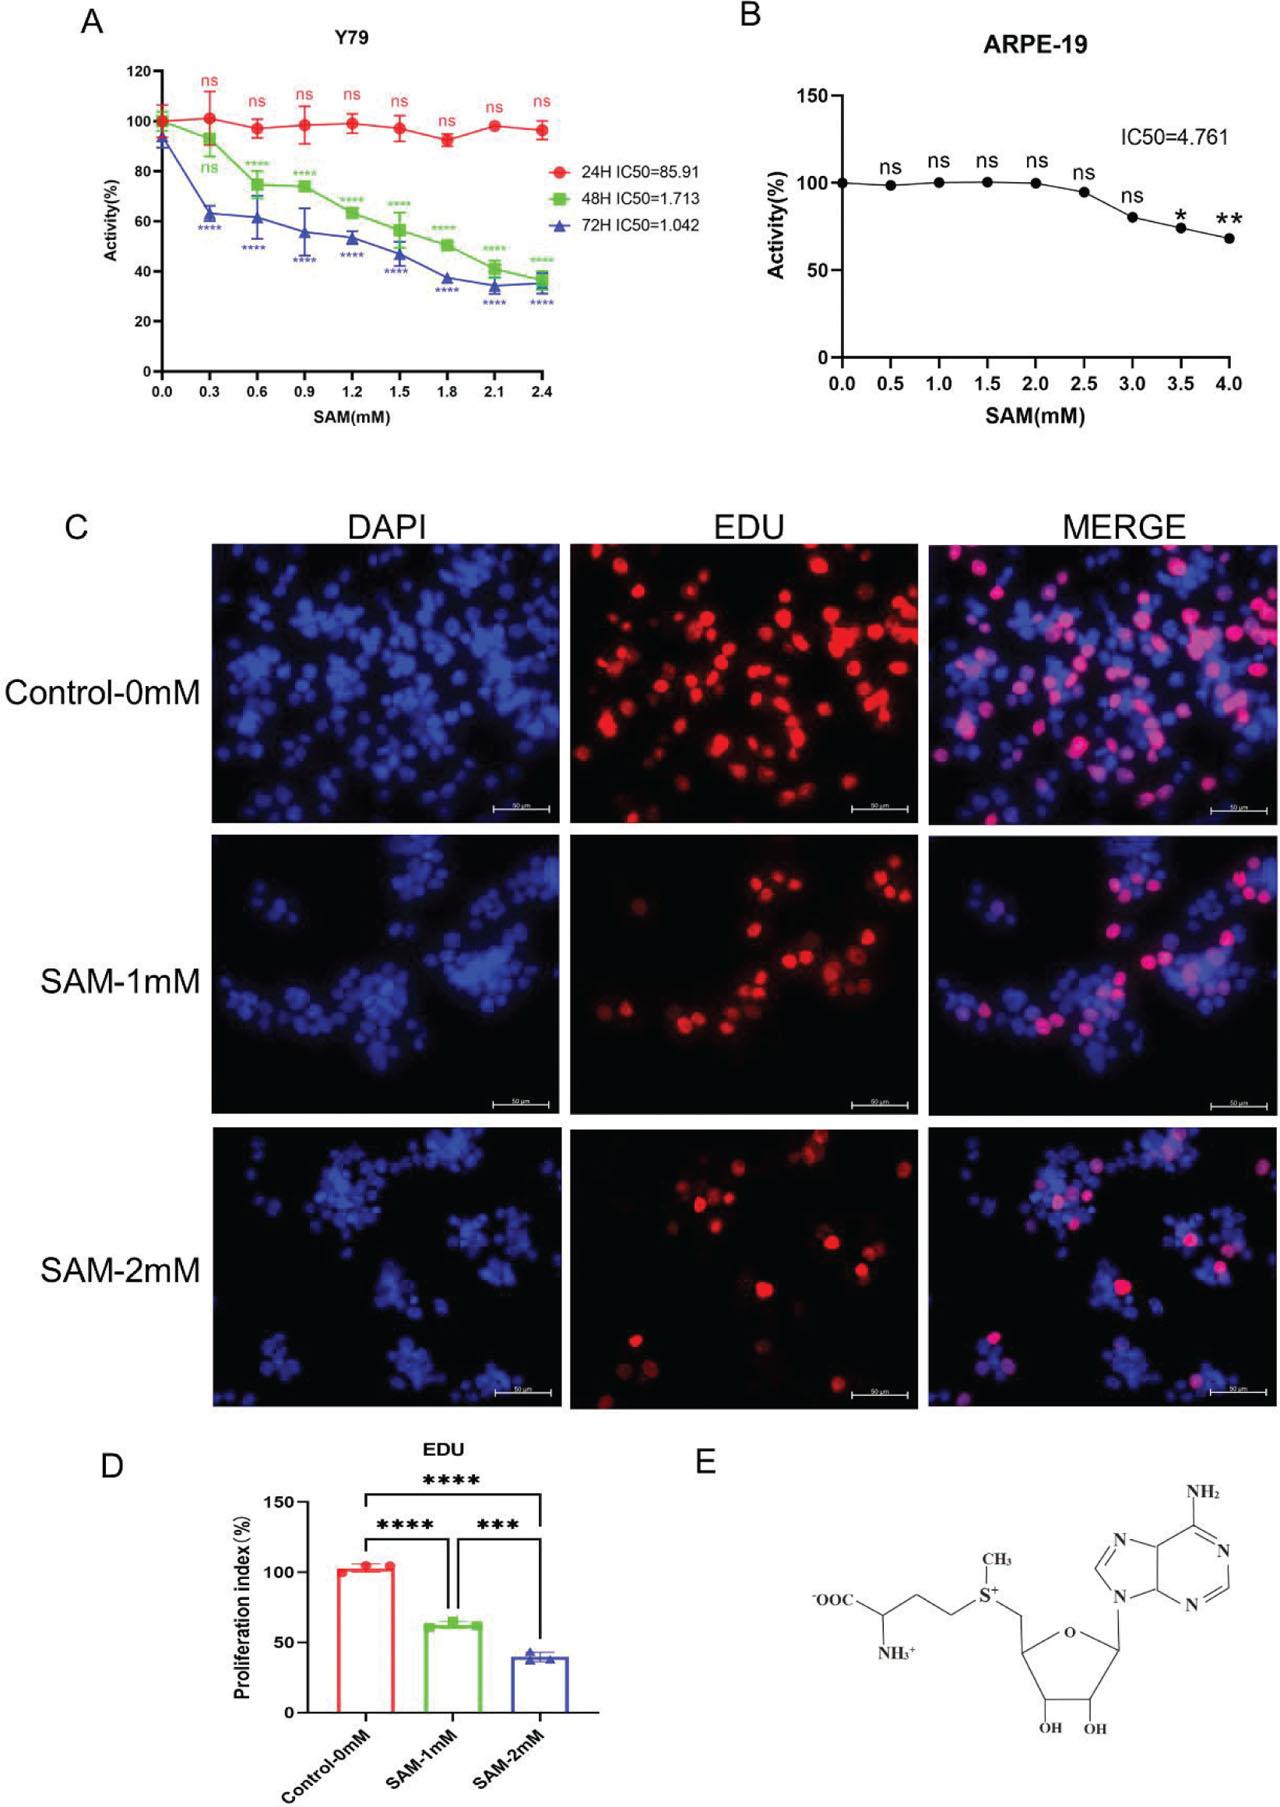
Fig 2.
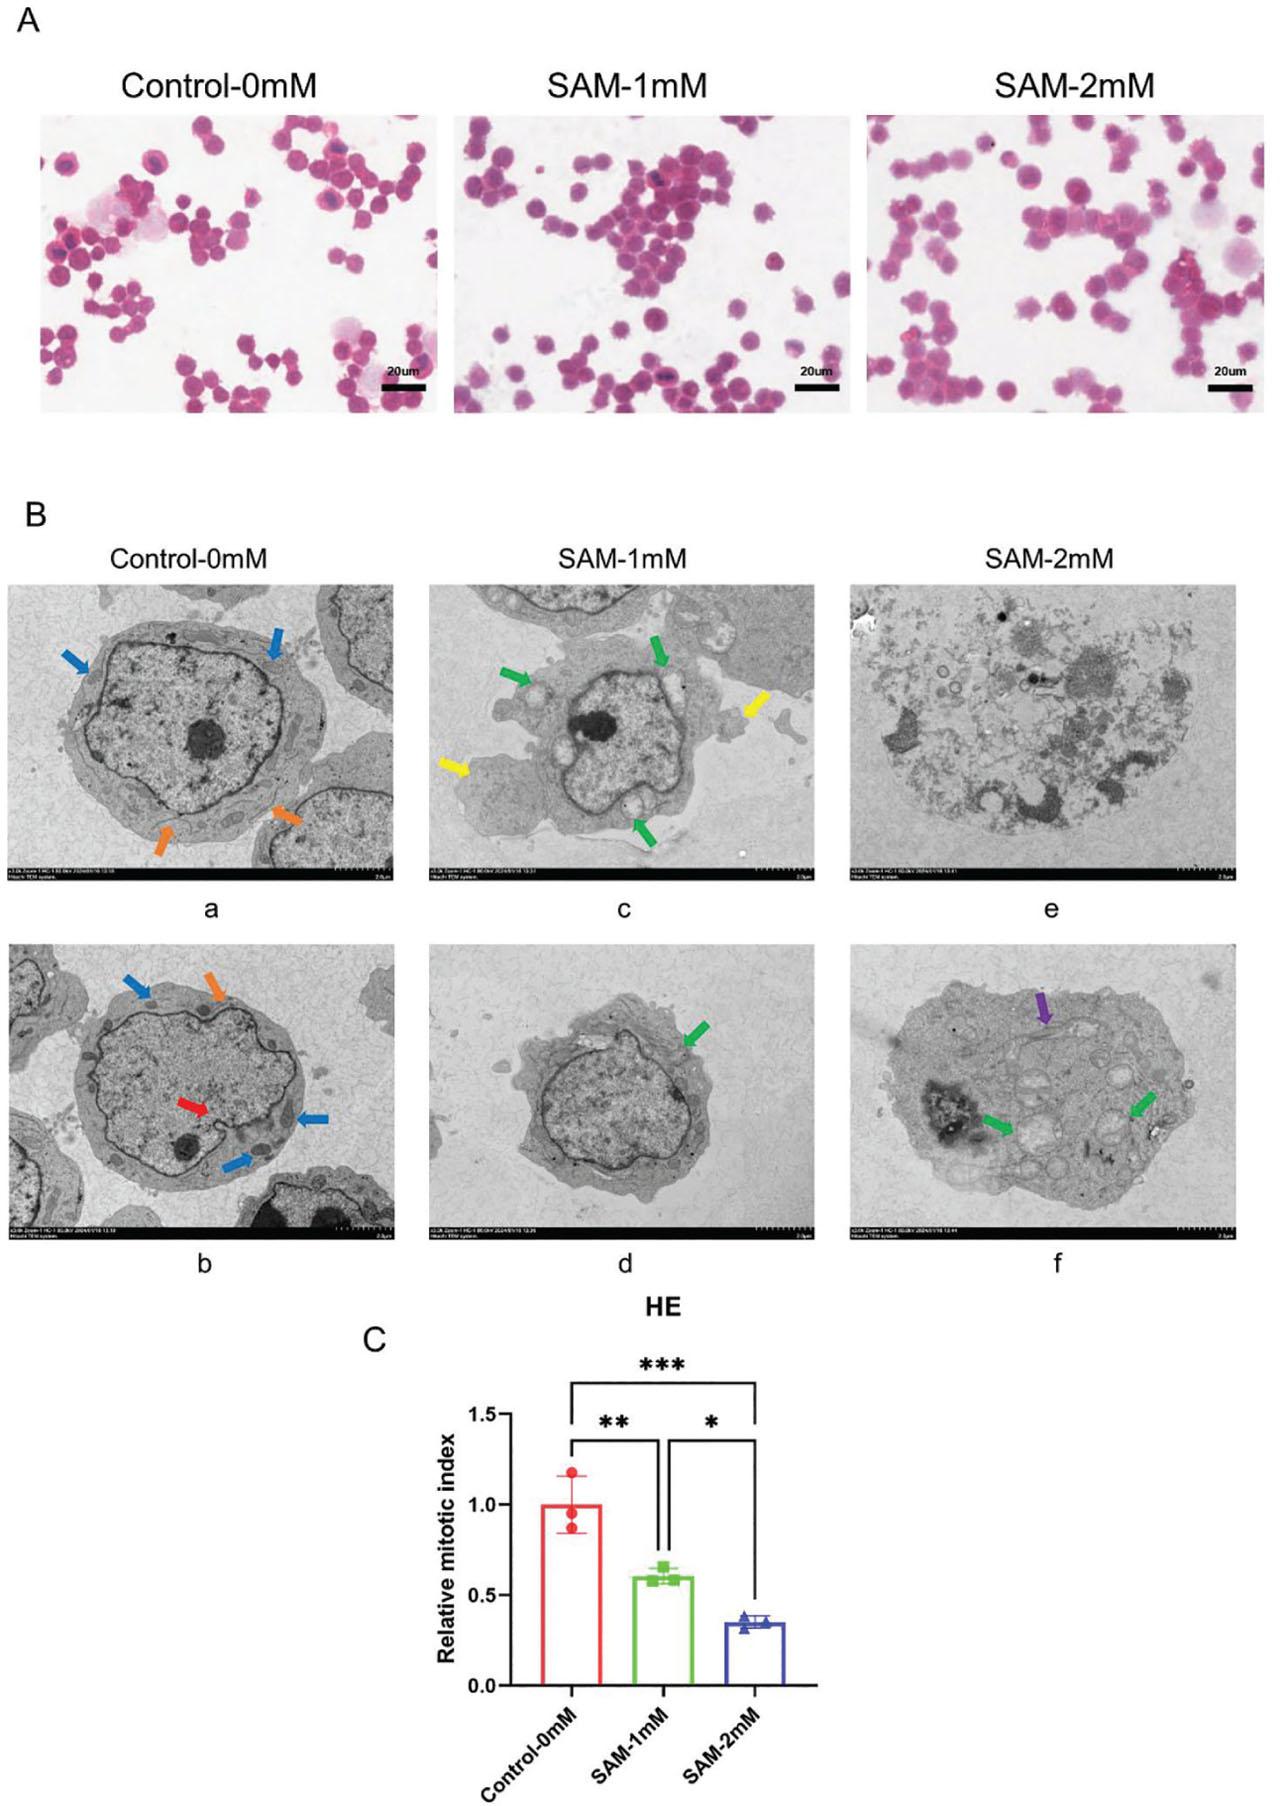
Fig 3.
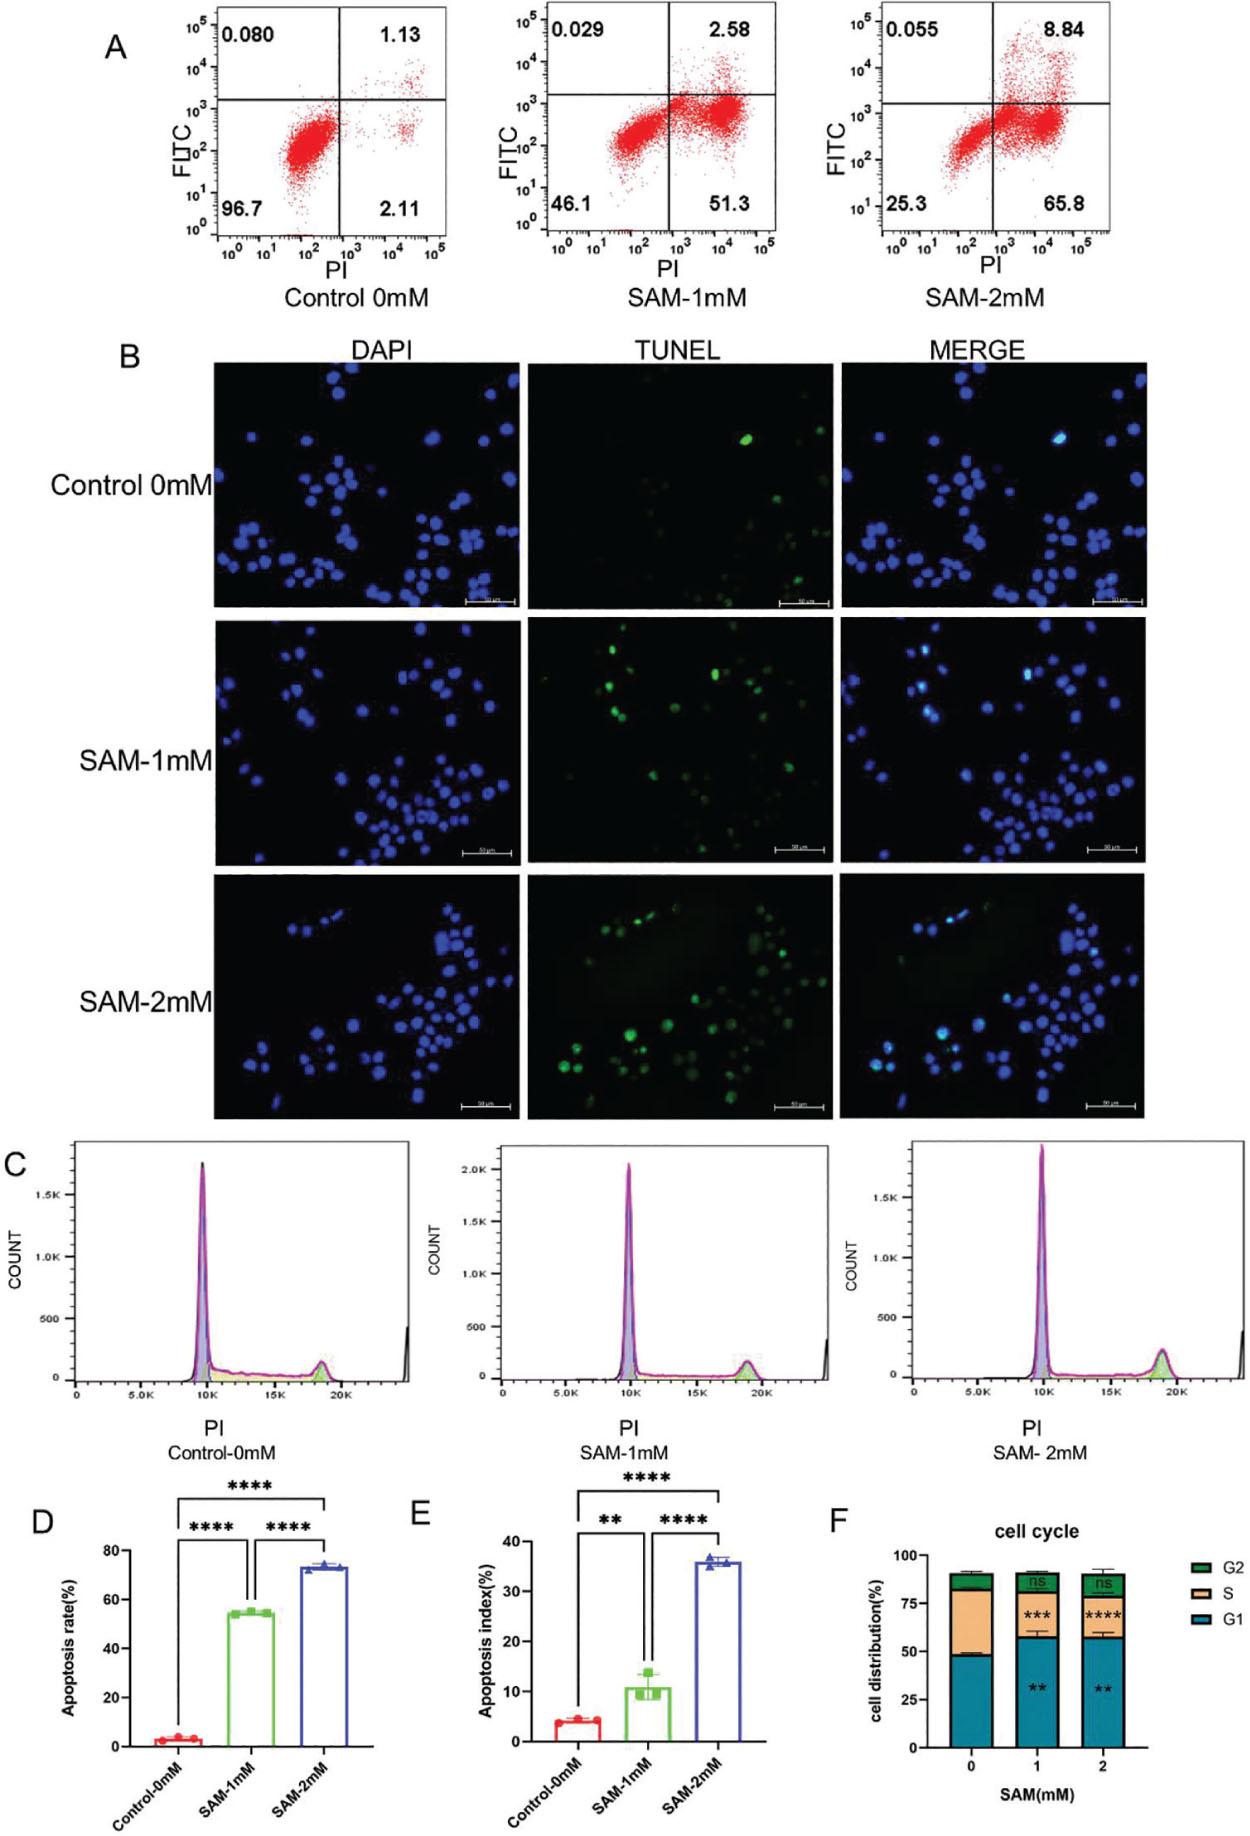
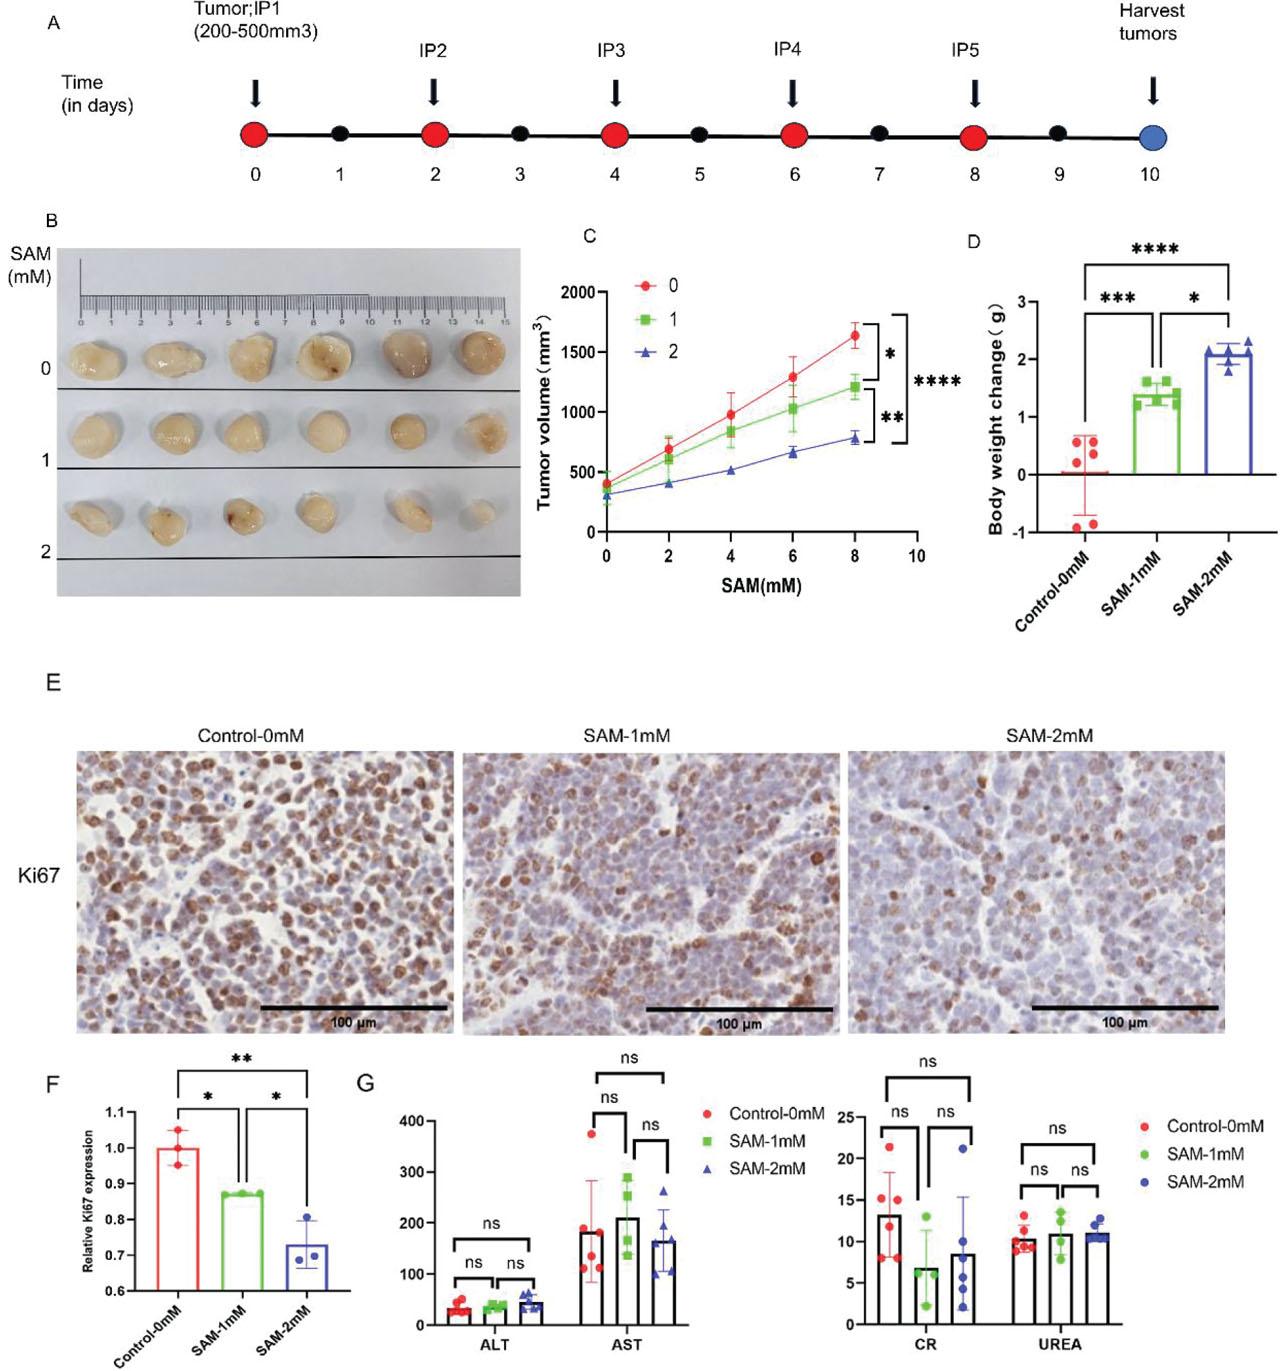
Fig 4.
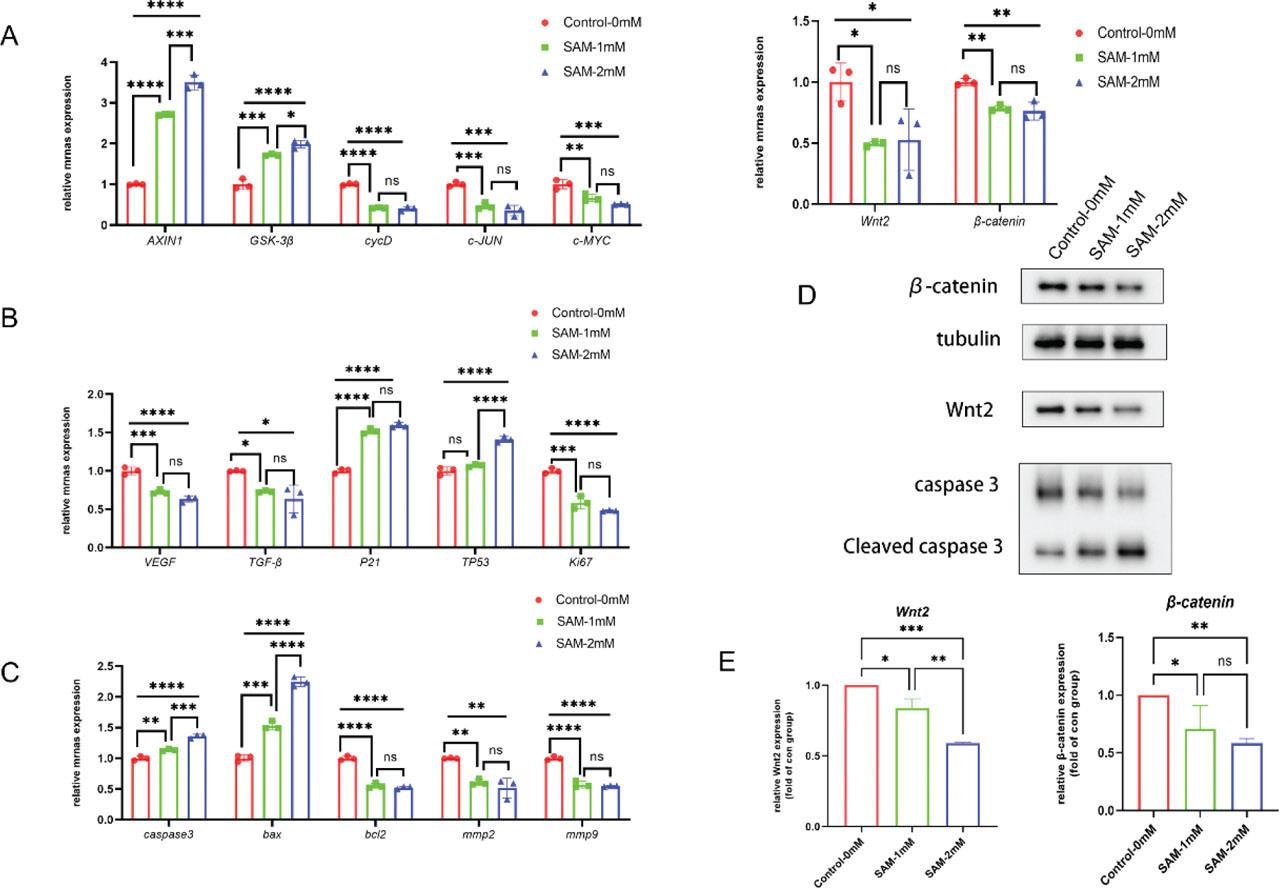
Fig 5.
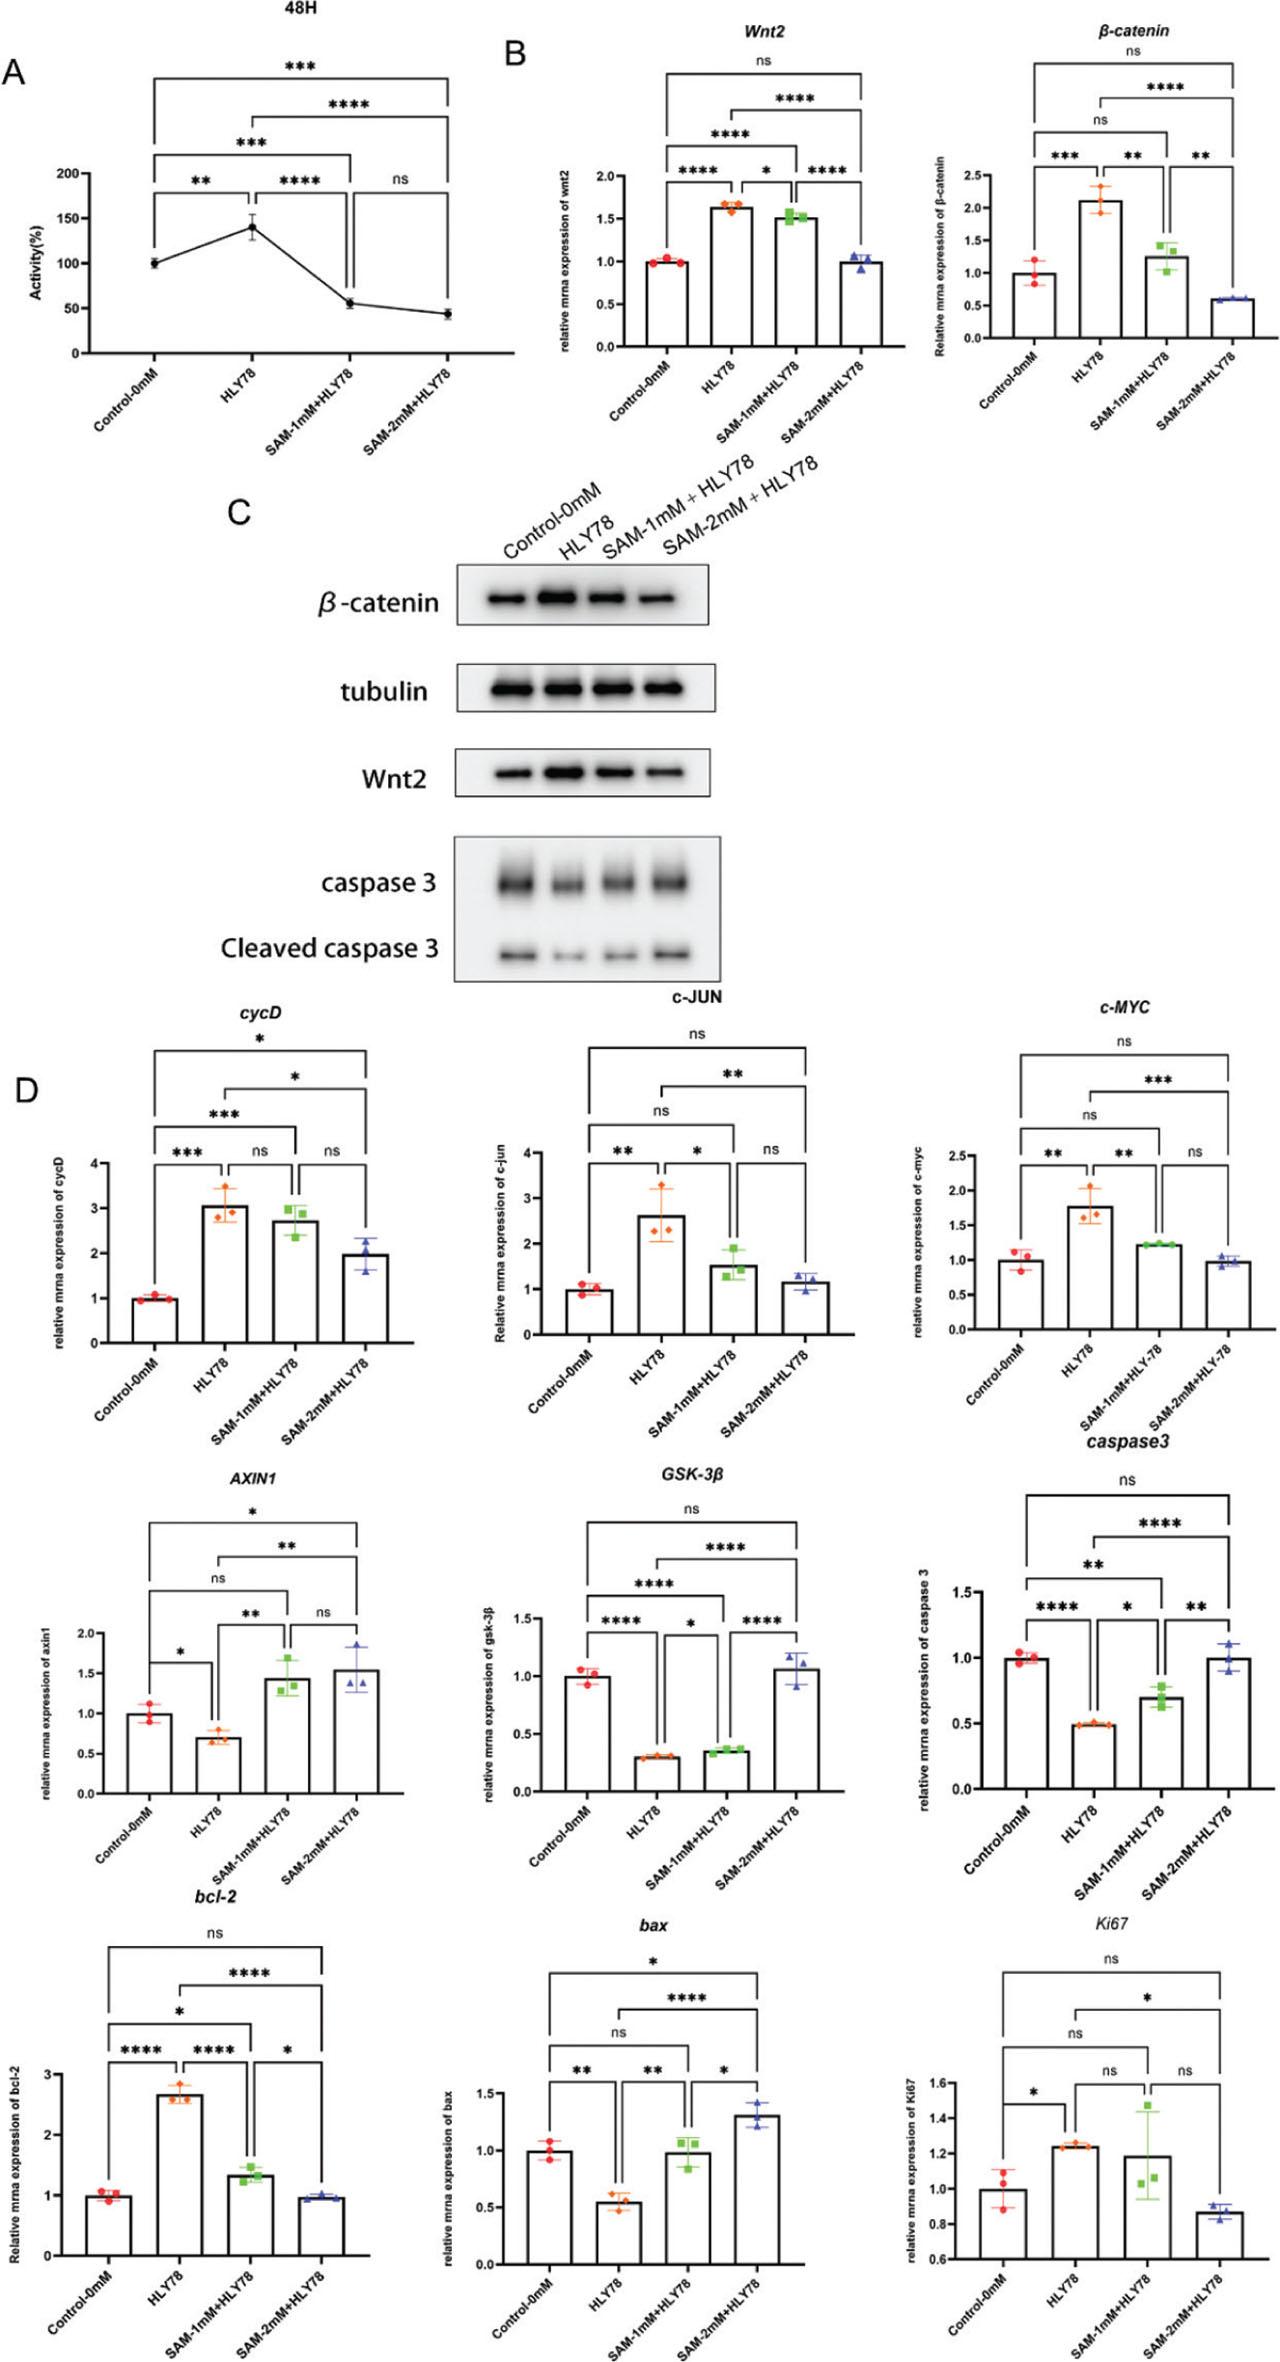
Fig 6.
The primers of RT-PCR
| Genes | Primer sequences |
|---|---|
| GAPDH | F: 5′-ACCCACTCCTCCACCTTTGAC-3′ |
| R: 5′-TGTTGCTGTAGCCAAATTCGTT-3′ | |
| Ki67 | F: 5′-ACGCCTGGGTTACTATCAAAAGG-3′ |
| R: 5′-CAGACCCATTTACTTGTGTTGGA-3′ | |
| CASPASE 3 | F: 5′-GAAATTGTGGAATTGATGCGTGA-3′ |
| R: 5′-CTACAACGATCCCCTCTGAAAAA-3′ | |
| Bax | F: 5′-CCCGAGAGGTCTTTTTCCGAG-3′ |
| R: 5′-CCAGCCCATGATGGTTCTGAT-3′ | |
| BCL-2 | F: 5′-GGTGGGGGTCATGTGTGTGTGG-3′ |
| R: 5′-CGGTTCAGGTACTCAGTCATCC-3′ | |
| MMP-2 | F: 5′-CCCACTGCGGTTTTCTCGAAT-3′ |
| R: 5′-CAAAGGGGGTATCCATCGCCAT-3′ | |
| MMP-9 | F: 5′-TGTACCGCTATGGTTACACTCG-3′ |
| R: 5′-GGCAGGGGACAGTTGCTTCT-3′ | |
| VEGF | F: 5′-AGGGCAGAATCATCACGAAGT-3′ |
| R: 5′-AGGGTCTCGATTGGATGGCA-3′ | |
| TGF-β | F: 5′-CTAATGGTGGAAACCCACAACG-3′ |
| R: 5′-TATCGCCAGGAATTGTTGCTG-3′ | |
| P21 | F: 5′-CGATGGAACTTCGACTTTGTCA-3′ |
| R: 5′-GCACAAGGGTACAAGACAGTG-3′ | |
| TP53 | F: 5′-GAGGTTGGGCTCTCTGACTGTACC-3′ |
| R: 5′-TCCGTCCCAGTAGATTACCAC-3 | |
| β-CATENIN | F: 5′-CCTGTTCCCCTGAGGGTATT-3′ |
| R: 5′-CCATCAAATCAGCTTGAGTAGCC-3 | |
| Wnt2 | F: 5′-GCCTTTGTTTATGCCATCTCCT-3′ |
| R: 5′-CTTGGCGCTTCCCATCTTCTT-3′ | |
| c-MYC | F: 5′-TGCACCCACATCATCTACAG-3′ |
| R: 5′-ACTCGTCATTCCACTCCCAT-3′ | |
| cycD | F: 5′-AGTGAGCTCAGGAGGAGGTGGTGTAA-3′ |
| R: 5′-AGTAAGCTTGTGAGGGCAGAGGTGTC-3′ | |
| c-JUN | F: 5′-TCCAAGTGCCGAAAAAGGAAG-3′ |
| R: 5′-CGAGTTCTGAGCTTTCAAGGT-3′ | |
| Axin1 | F: 5′-GACAAGATCGCAGAGGAAGG-3′ |
| R: 5′-ACCCCCACAGTCAAACTCGTC-3′ | |
| GSK-3β | F: 5′-CCTGGGAACTCCAACAAGGG-3′ |
| R: 5′-GGGGTCGGAAGACCTTAGTC-3′ |