
Fig 1.
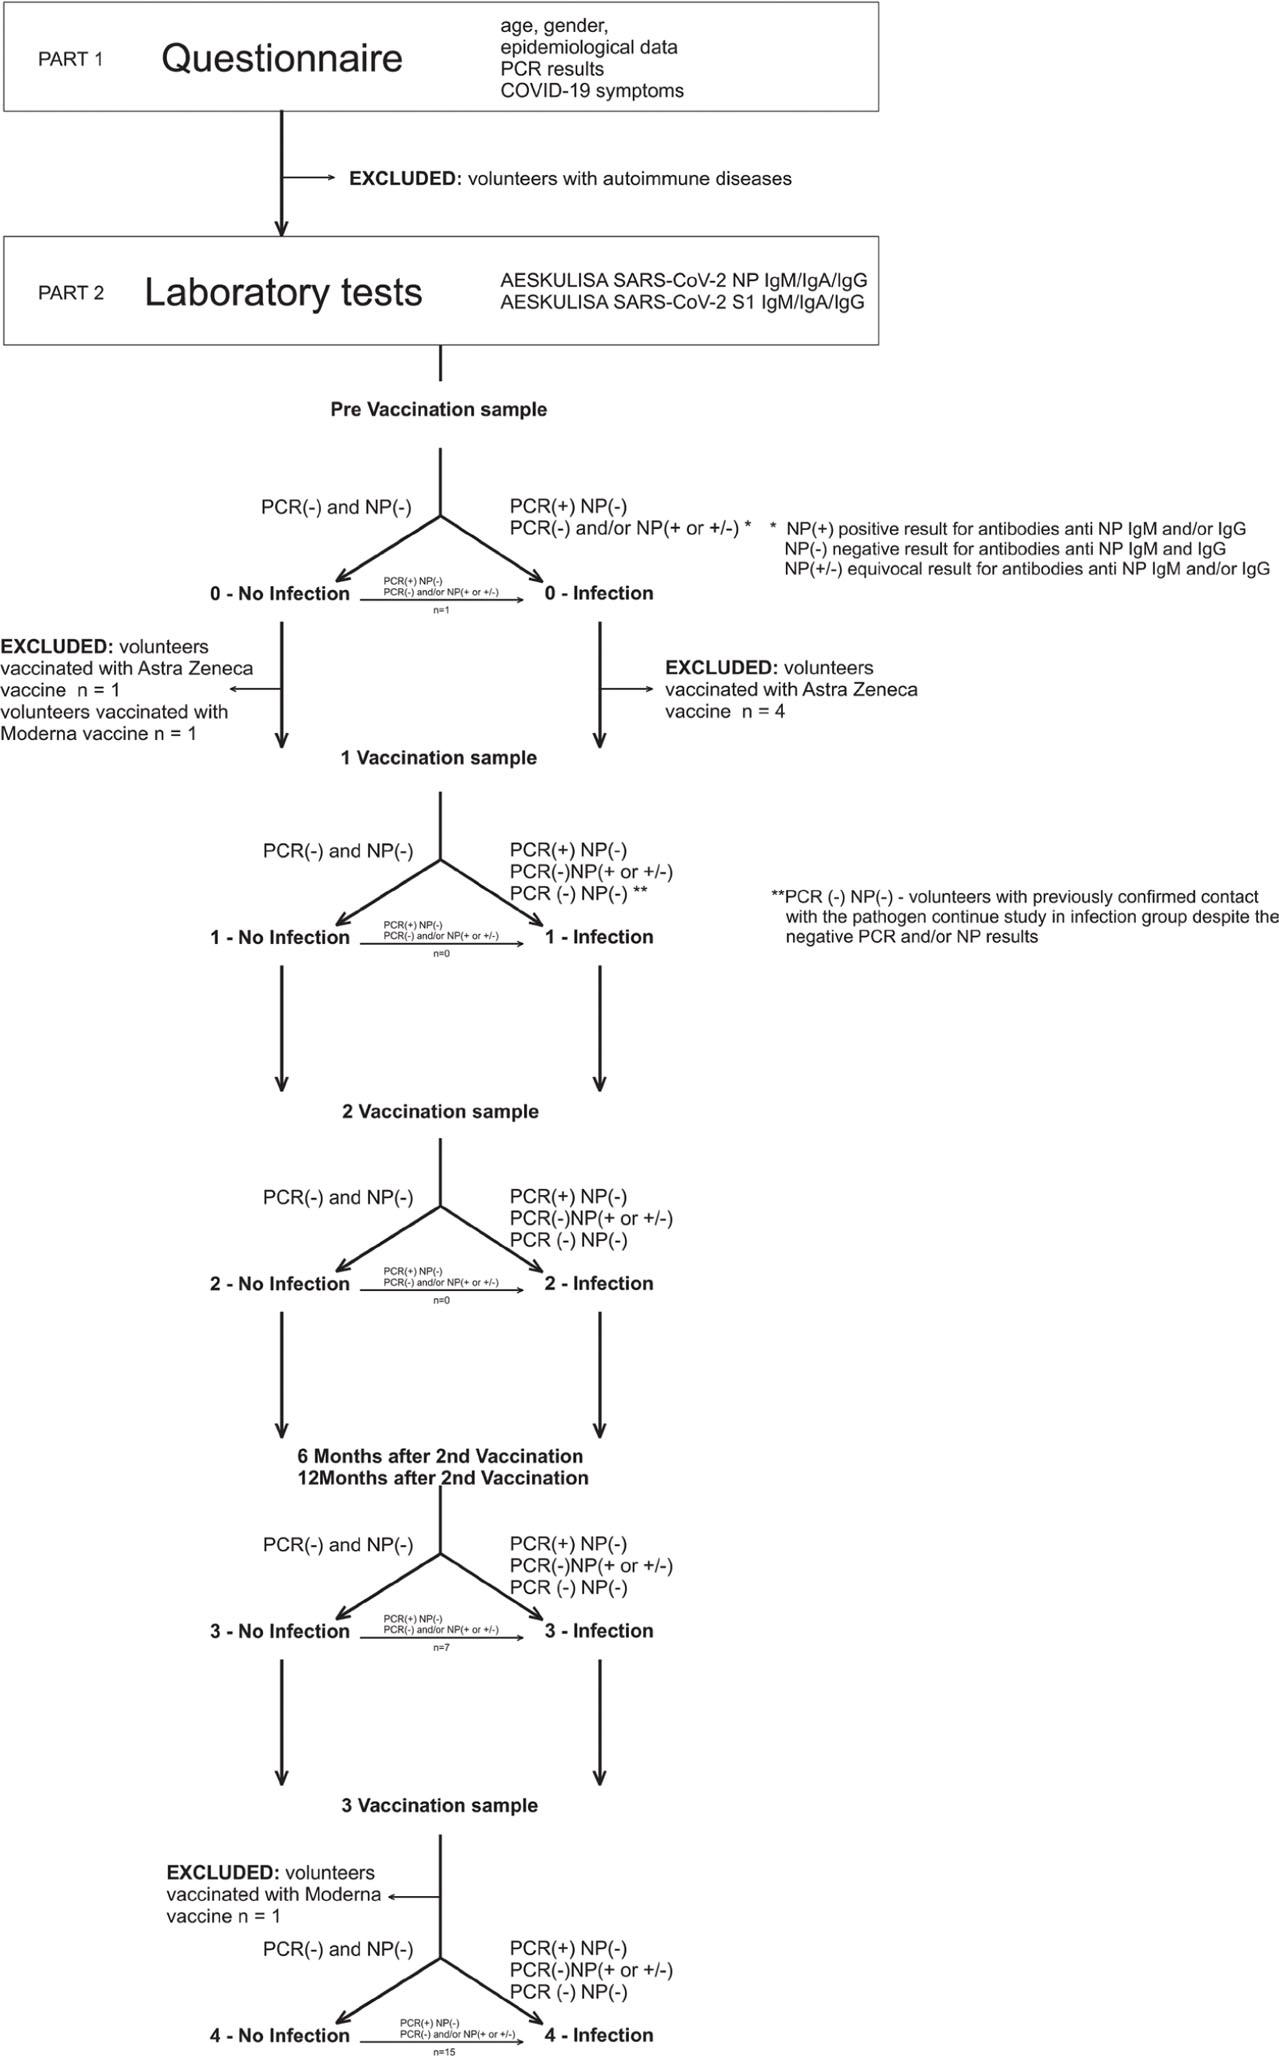
Fig 2.
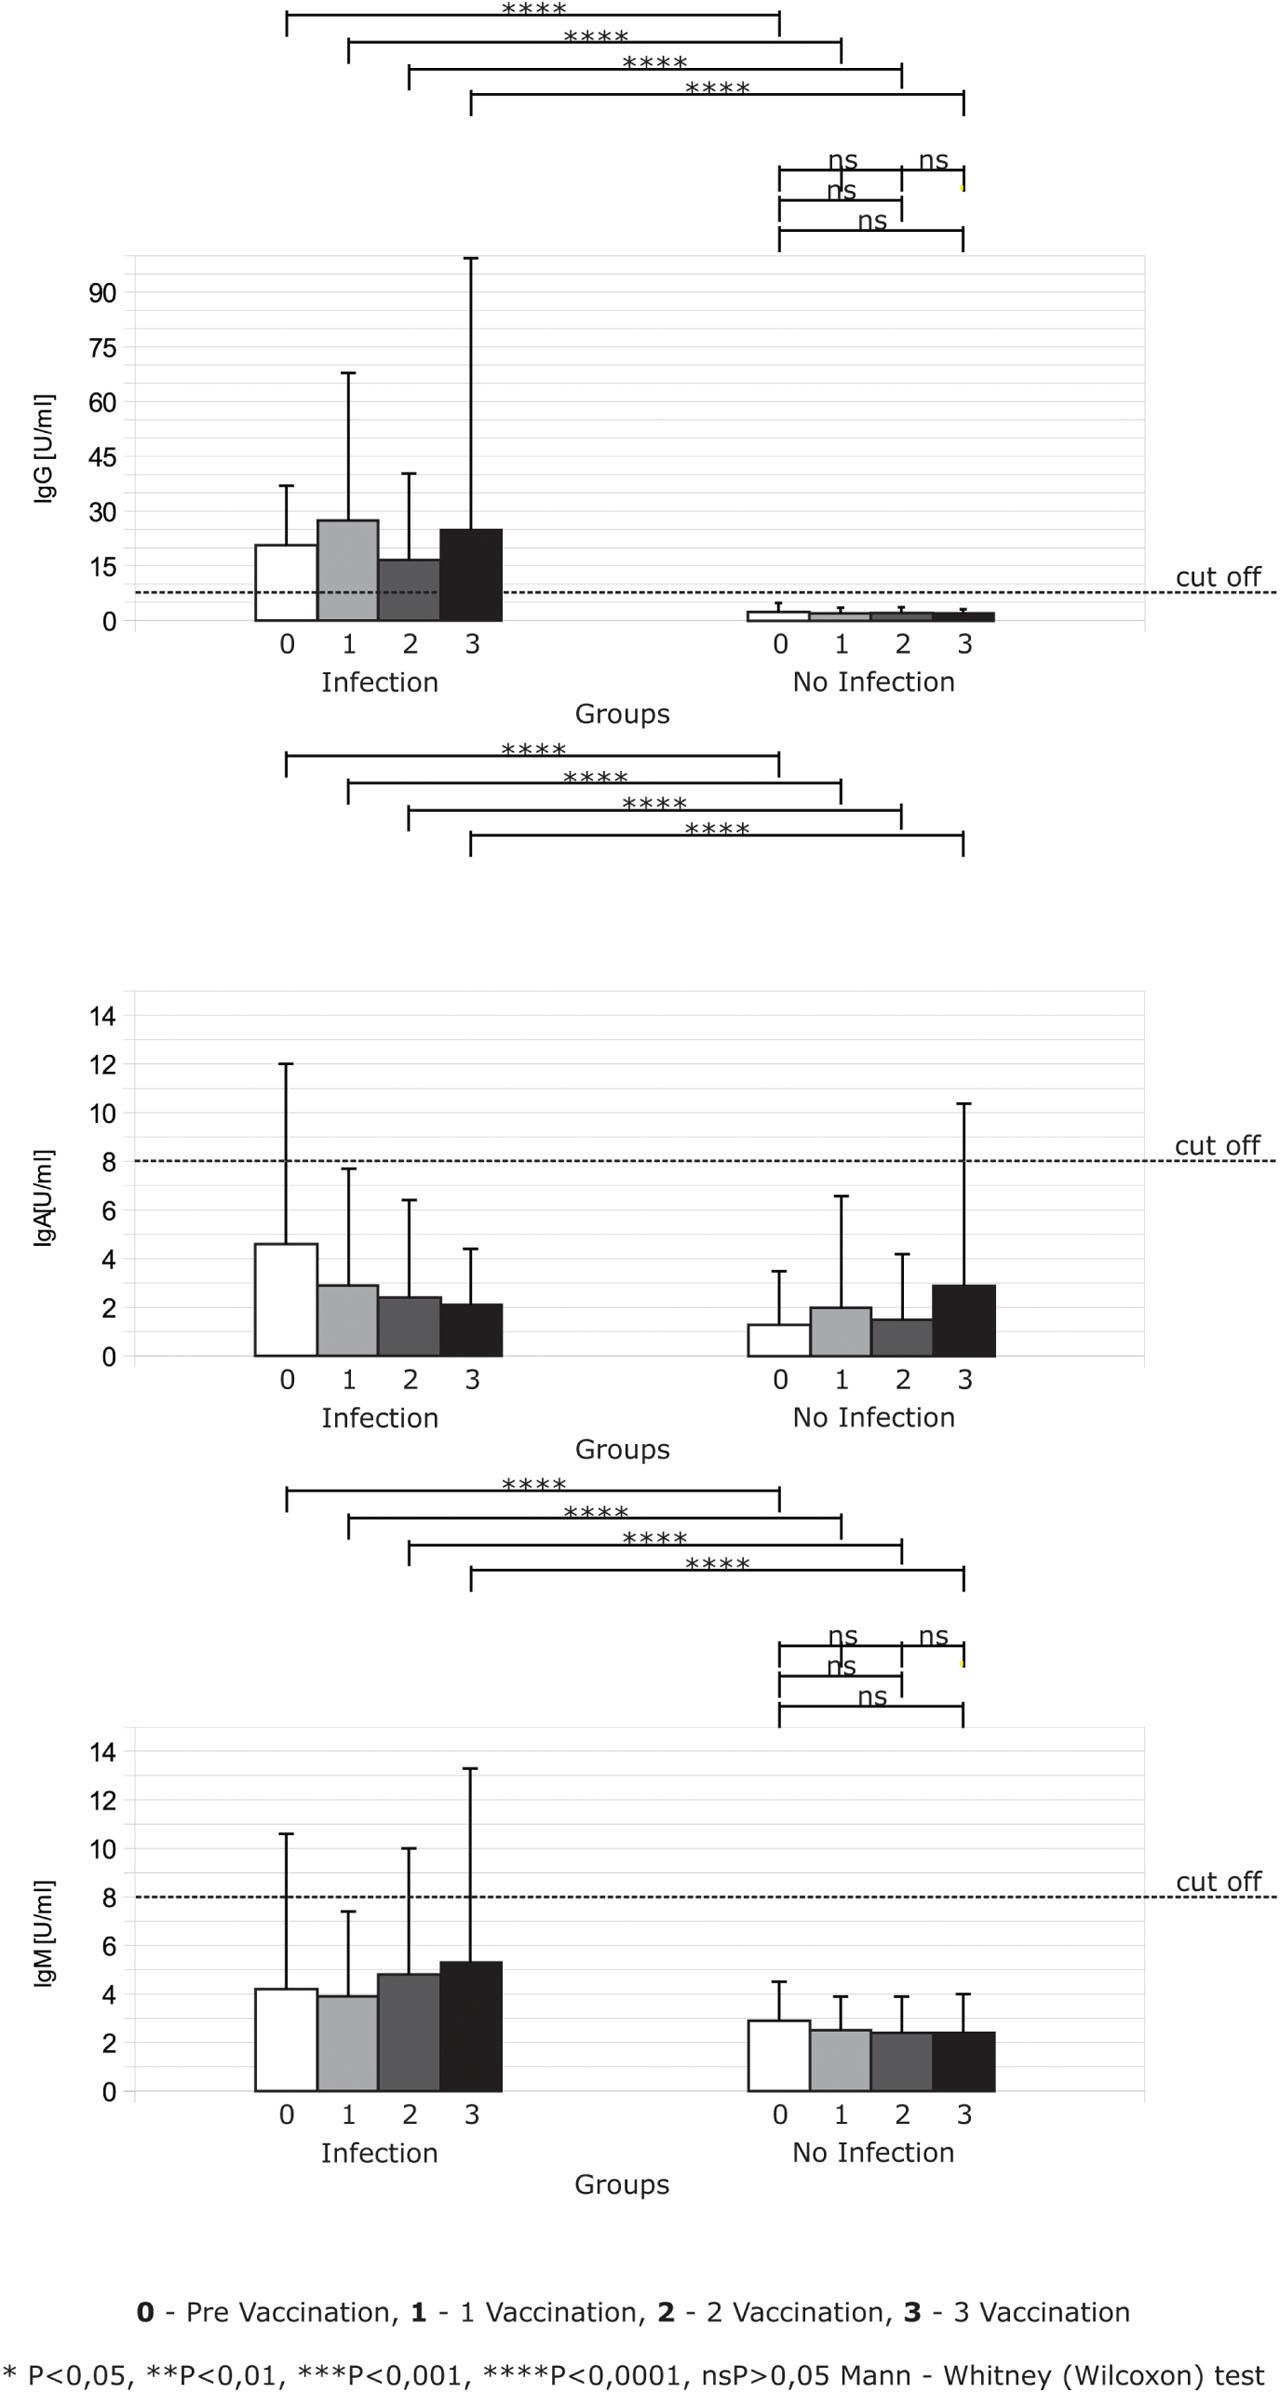
Fig 3.
Changes of IgM, IgA and IgG antibodies levels against NP produced post vaccination according to prior infection of SARS-Cov-2_
| IgA | ||||||||||||
| Before vaccine | After first vaccine | After second vaccine | After third vaccine | |||||||||
| Group | No |
|
| No |
|
| No |
|
| No |
|
|
| Infection | 17 |
|
| 40 |
|
| 101 |
|
| 15 |
|
|
| No infection | 13 |
|
| 62 |
|
| 221 |
|
| 40 |
|
|
| IgM | ||||||||||||
| Before vaccine | After first vaccine | After second vaccine | After third vaccine | |||||||||
| Group | No |
|
| No |
|
| No |
|
| No |
|
|
| Infection | 17 |
|
| 40 |
|
| 101 |
|
| 15 |
|
|
| No infection | 13 |
|
| 62 |
|
| 221 |
|
| 40 |
|
|
| IgG | ||||||||||||
| Before vaccine | After first vaccine | After second vaccine | After third vaccine | |||||||||
| Group | No |
|
| No |
|
| No |
|
| No |
|
|
| Infection | 17 |
|
| 40 |
|
| 101 |
|
| 15 |
|
|
| No infection | 13 |
|
| 62 |
|
| 221 |
|
| 40 |
|
|
Characteristics of the study samples
| Groups | Infection | No infection |
|---|---|---|
| Pre vaccination samples | ||
| N | 17 | 13 |
| Age (years), mean (SD) | 42.1 (10) | 43.7 (13) |
| Race % | White 100% | White 100% |
| Gender M/F | 2/15 | 2/11 |
| 1 Vaccination samples | ||
| N | 40 | 62 |
| Age (years), mean (SD) | 45.8 (10) | 42.3 (11) |
| Race % | White 100% | White 100% |
| Gender M/F | 5/35 | 5/57 |
| 2 Vaccination samples | ||
| N | 101 | 221 |
| Age (years), mean (SD) | 48.9 (11) | 45.6 (11) |
| Race % | White 100% | White 100% |
| Gender M/F | 16/85 | 29/192 |
| 3 Vaccination samples | ||
| N | 15 | 40 |
| Age (years), mean (SD) | 44.4 (12) | 42.3 (12) |
| Race % | White 100% | White 100% |
| Gender M/F | 3/12 | 9/31 |
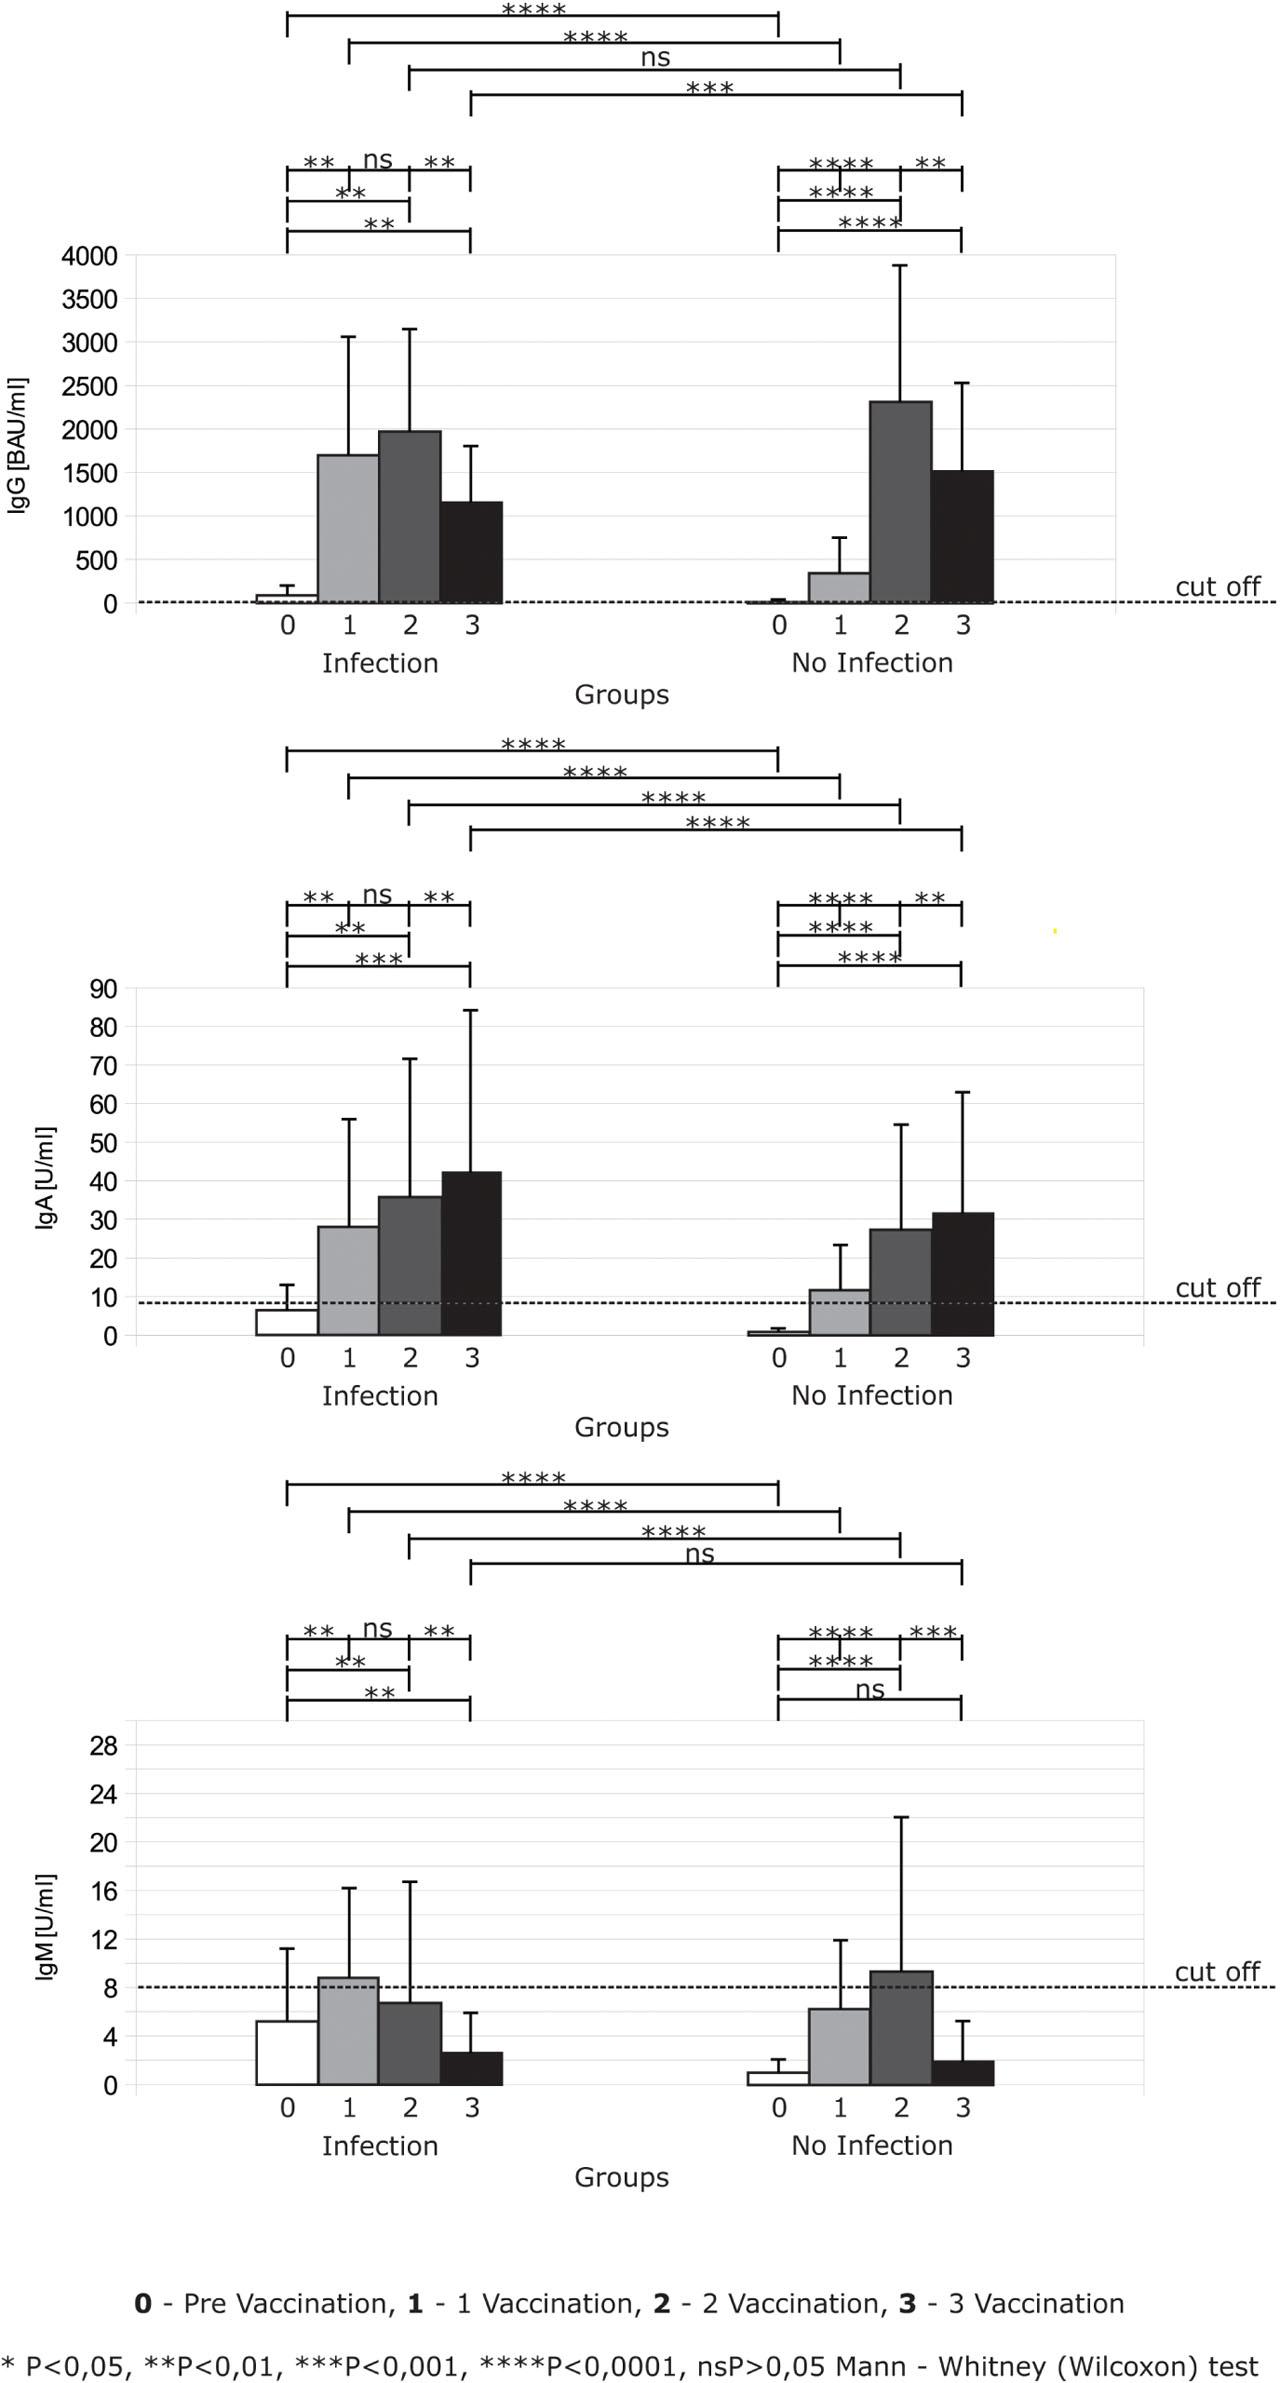
Changes of IgM, IgA and IgG antibodies levels against S1 protein produced post vaccination according to prior infection of SARS- Cov-2_
| IgA | ||||||||||||
| Before vaccine | After first vaccine | After second vaccine | After third vaccine | |||||||||
| Group | No | No |
|
| No |
|
| No |
|
| No |
|
| Infection | 17 |
|
| 40 |
|
| 101 |
|
| 15 |
|
|
| No infection | 13 |
|
| 62 |
|
| 221 |
|
| 40 |
|
|
| IgM | ||||||||||||
| Before vaccine | After first vaccine | After second vaccine | After third vaccine | |||||||||
| Group | No |
|
| No |
|
| No |
|
| No |
|
|
| Infection | 17 |
|
| 40 |
|
| 101 |
|
| 15 |
|
|
| No infection | 13 |
|
| 62 |
|
| 221 |
|
| 40 |
|
|
| IgG | ||||||||||||
| Before vaccine | After first vaccine | After second vaccine | After third vaccine | |||||||||
| Group | No |
|
| No |
|
| No |
|
| No |
|
|
| Infection | 17 |
|
| 40 |
|
| 101 |
|
| 15 |
|
|
| No infection | 13 |
|
| 62 |
|
| 221 |
|
| 40 |
|
|