Have a personal or library account? Click to login
In Vitro Effects of Silver Nanoparticles on Pathogenic Bacteria and on Metabolic Activity and Viability of Human Mesenchymal Stem Cells Cover

In Vitro Effects of Silver Nanoparticles on Pathogenic Bacteria and on Metabolic Activity and Viability of Human Mesenchymal Stem Cells

Open Access
|Feb 2024

Figures & Tables

Fig 1.

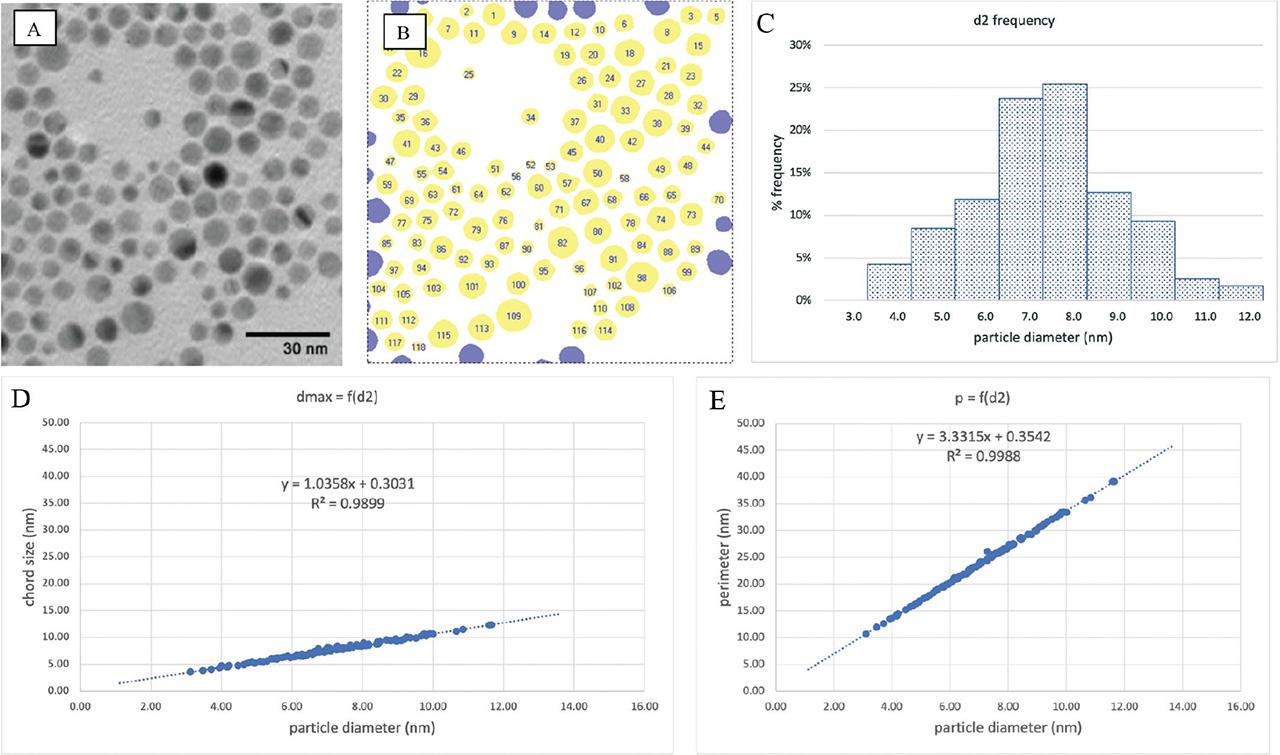
Nanoparticles size and shape analysis (A) Representative micro-graphs (TEM) of Ag-NPs provided by the manufacturer (https://www.sigmaaldrich.com/PL/pl/product/aldrich/730785) and (B) computer-processed image for size measurements. (C) Histogram of size distribution function with size defined as an equivalent diameter. (D) Values of a maximum chord plotted against the equivalent diameter for individual particles. (E) Values of a perimeter plotted against the equivalent diameter for individual particles. Ag-NPs, silver nanoparticles.

Fig 2.

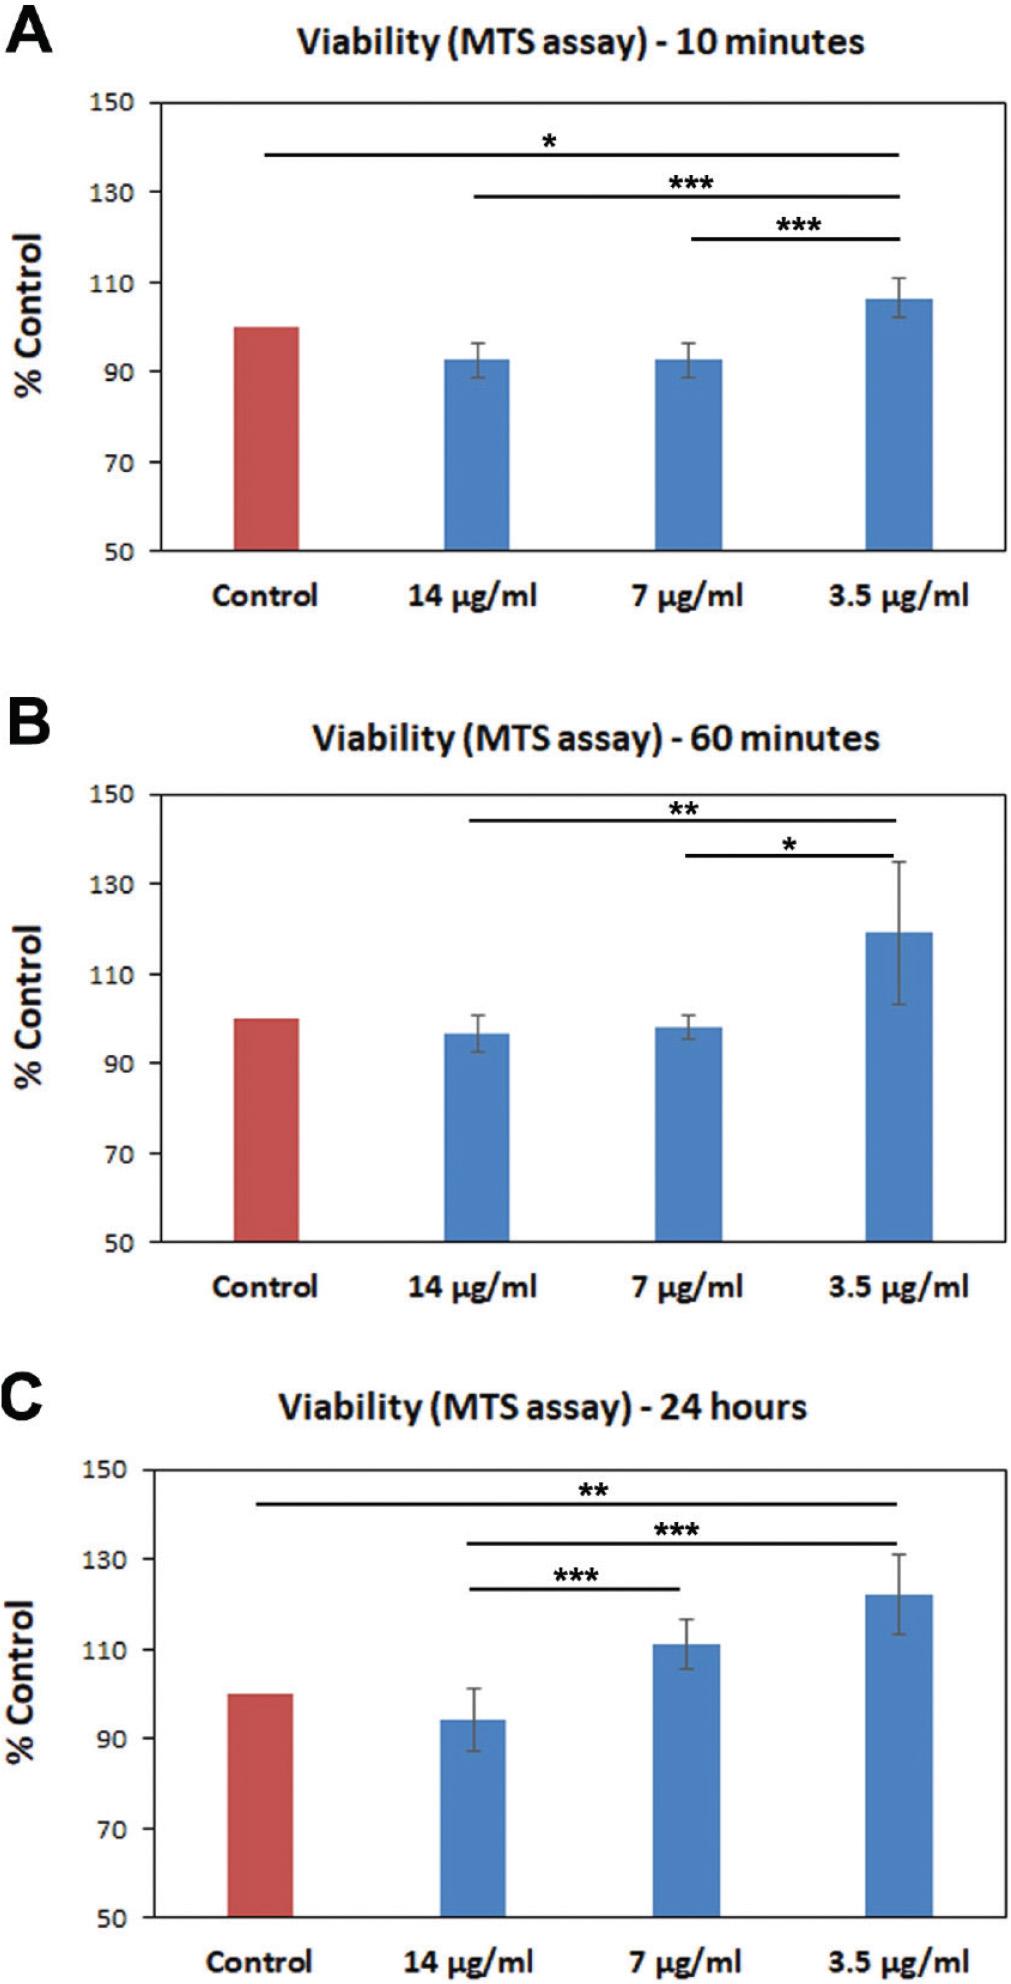
Metabolic activity of hMSCs incubated with Ag-NPs at a concentration of 0 μg/mL, 3.5 μg/mL, 7 μg/mL, and 14 μg/mL for (A) 10 min, (B) 60 min, and (C) 24 h. *P < 0.05, **P < 0.01, ***P < 0.001. Ag-NPs, silver nanoparticles.

Fig 3.

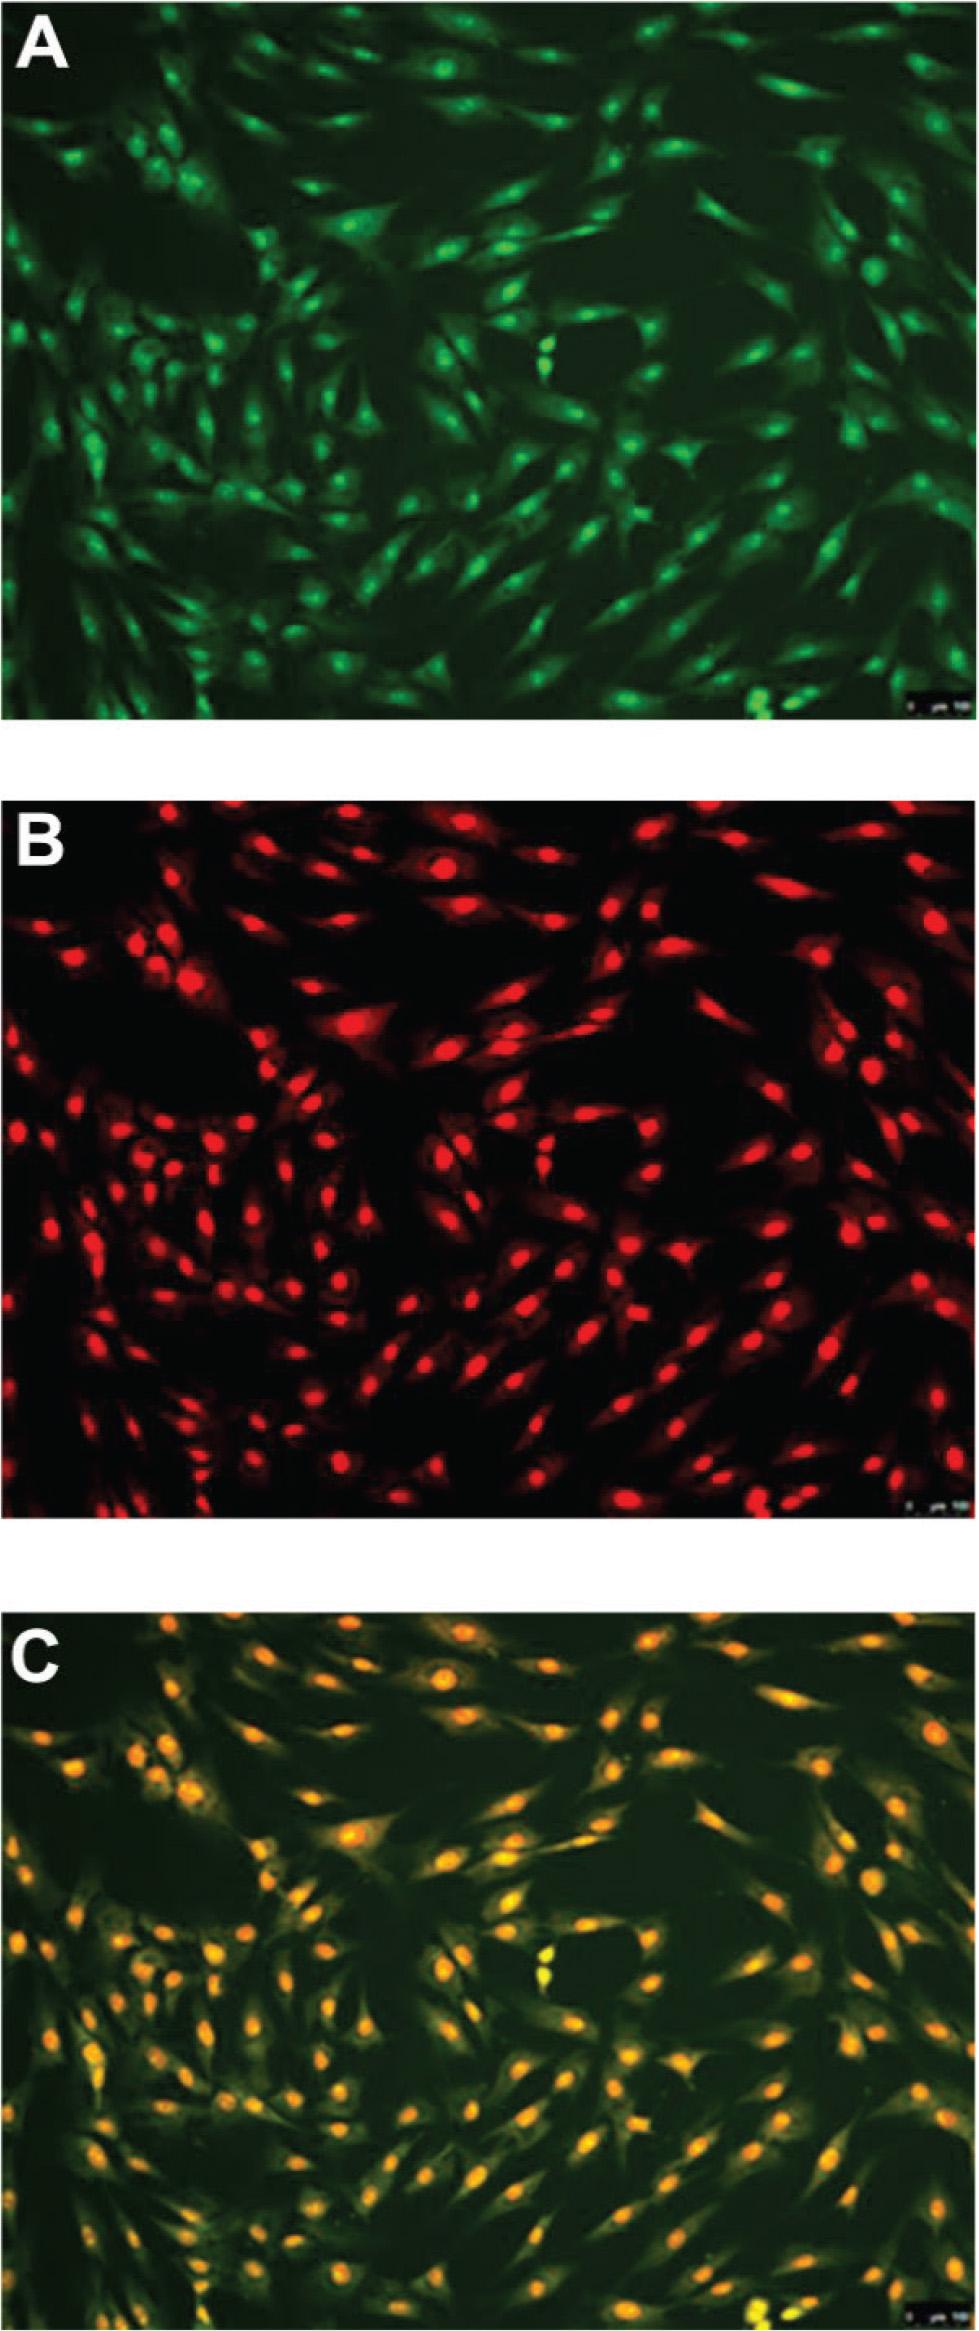
Representative images of hMSC cells stained with acridine orange and propidium iodide: all cells (A) (green); dead cells (red) (B) and overlap of both (C). hMSCs were fixed with MeOH, which caused cell death and membrane permeabilization.

Fig 4.

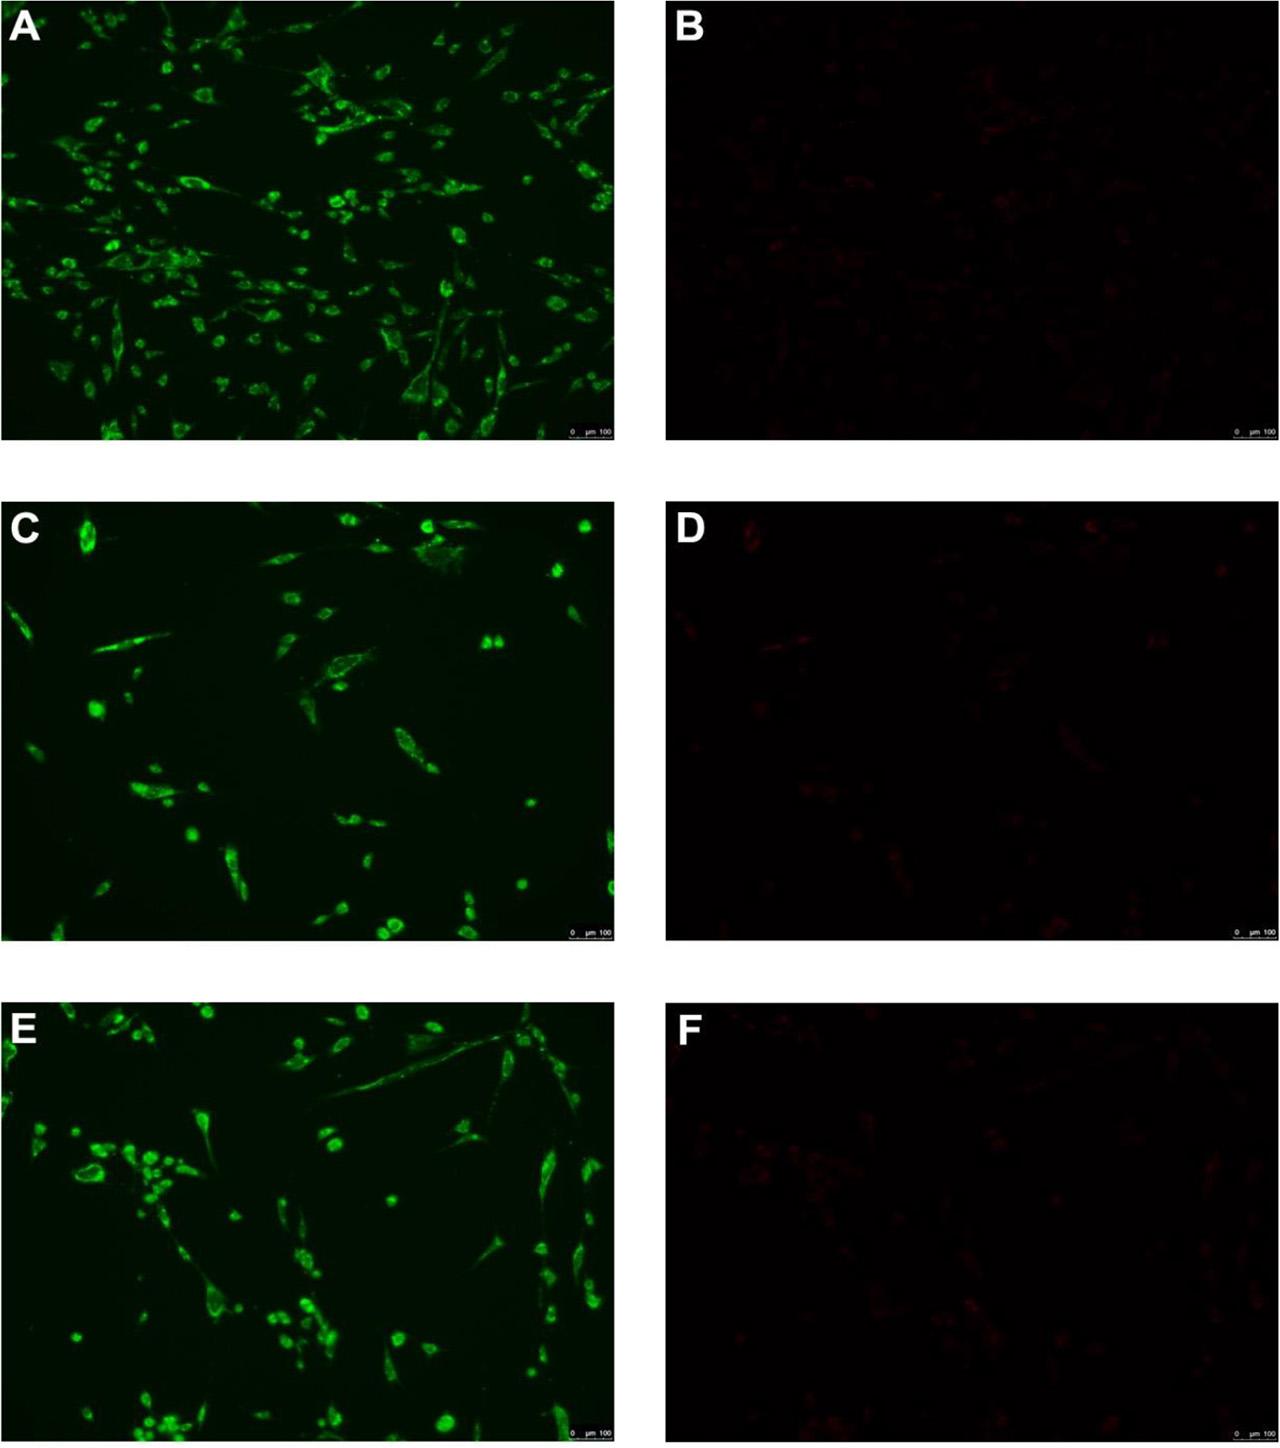
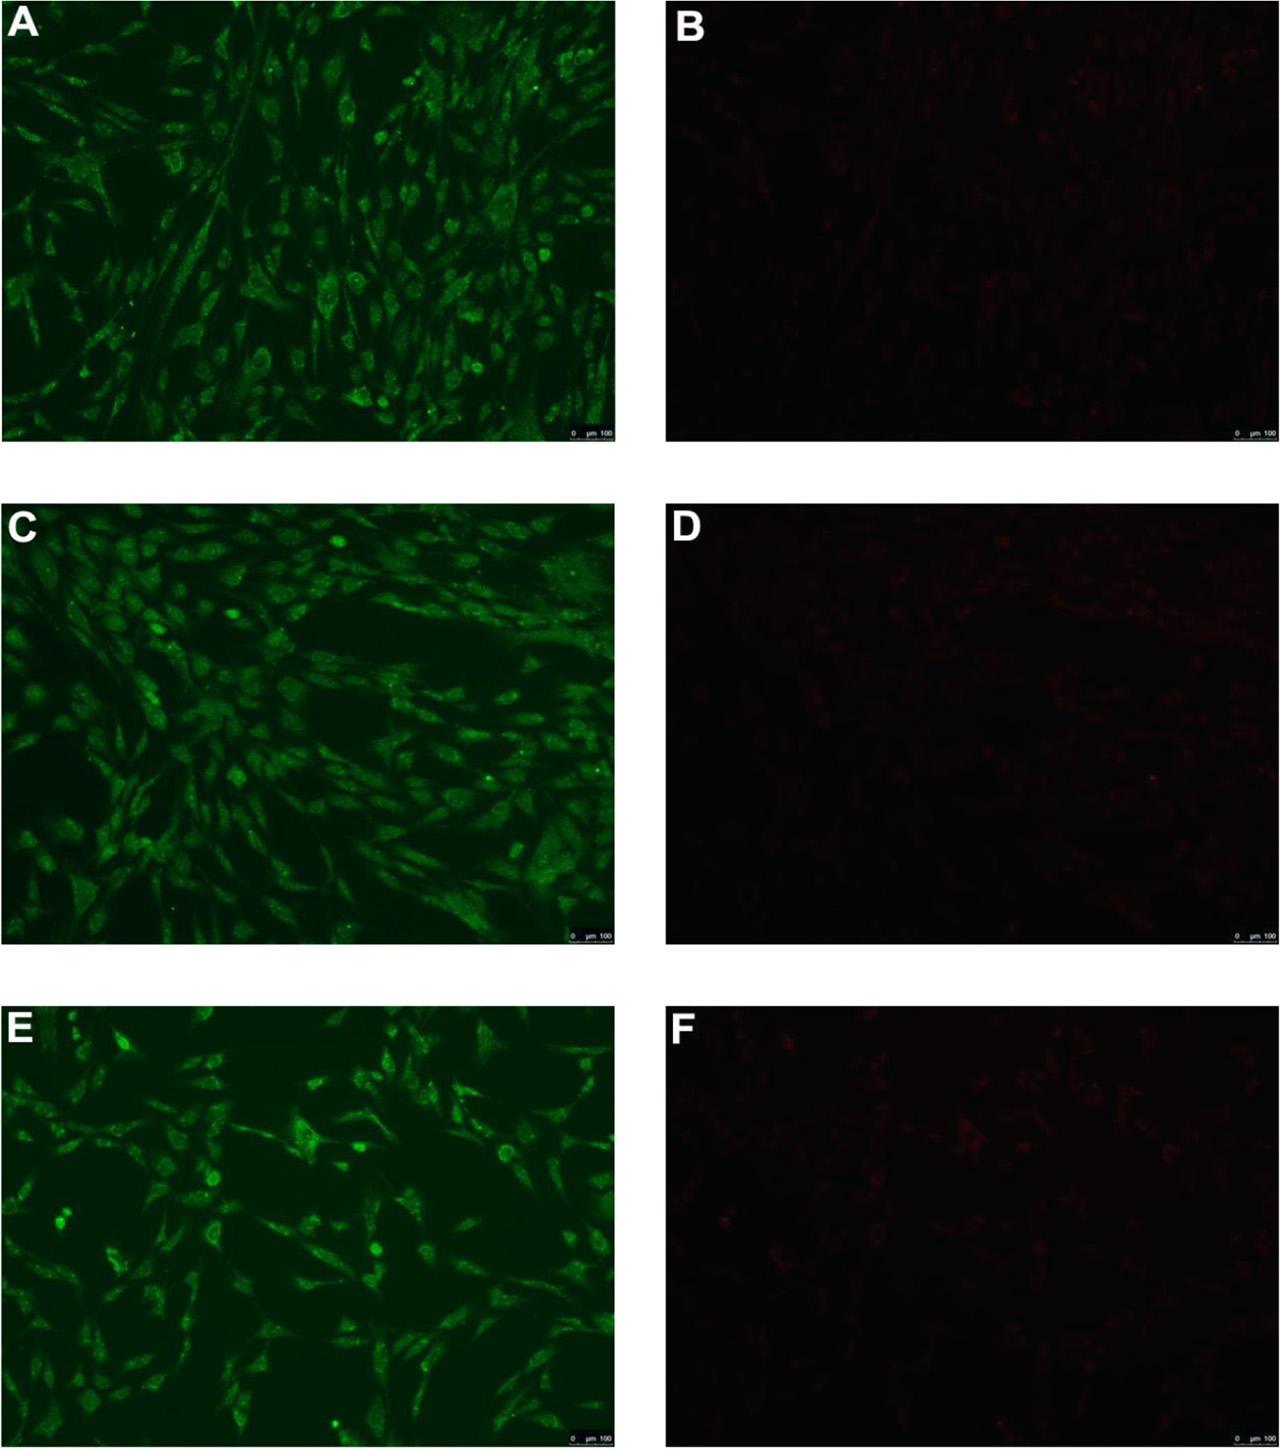
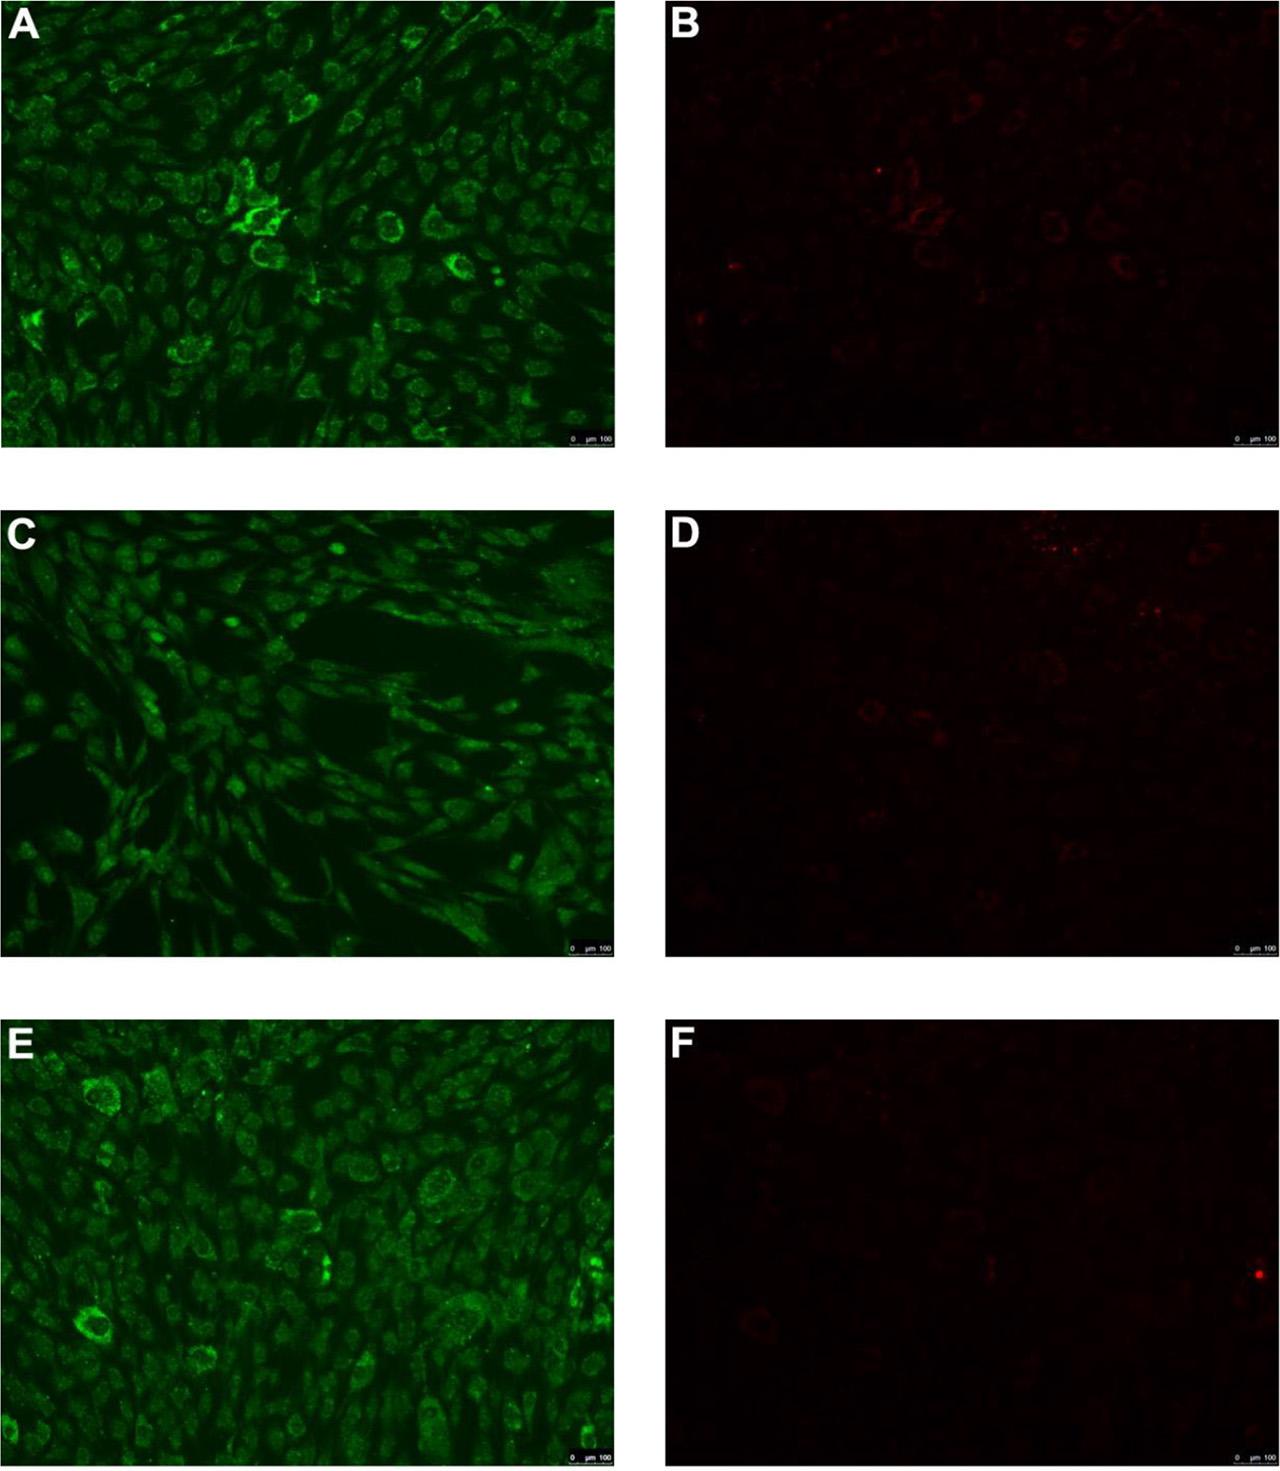
hMSCs incubated with Ag-NPs at a concertation of 14 μg/mL (A,B); 7 μg/mL (C,D); and 3.5 μg/mL (E,F) for the duration of 24 h. Green color—all cells (a,c,e); Red color—dead cells (b,d,f). Ag-NPs, silver nanoparticles.

Fig 5.

hMSCs incubated with Ag-NPs at a concertation of 14 μg/mL (A,B); 7 μg/mL (C,D); and 3.5 μg/mL (E,F) for the duration of 1 h. Green color—all cells (a,c,e); Red color—dead cells (b,d,f). Ag-NPs, silver nanoparticles.

Fig 6.

hMSCs incubated with Ag-NPs at a concertation of 14 μg/mL (A,B); 7 μg/mL (C,D); and 3.5 μg/mL (E,F) for the duration of 24 h. Green color—all cells (a,c,e); Red color—dead cells (b,d,f). Ag-NPs, silver nanoparticles.

Fig 7.

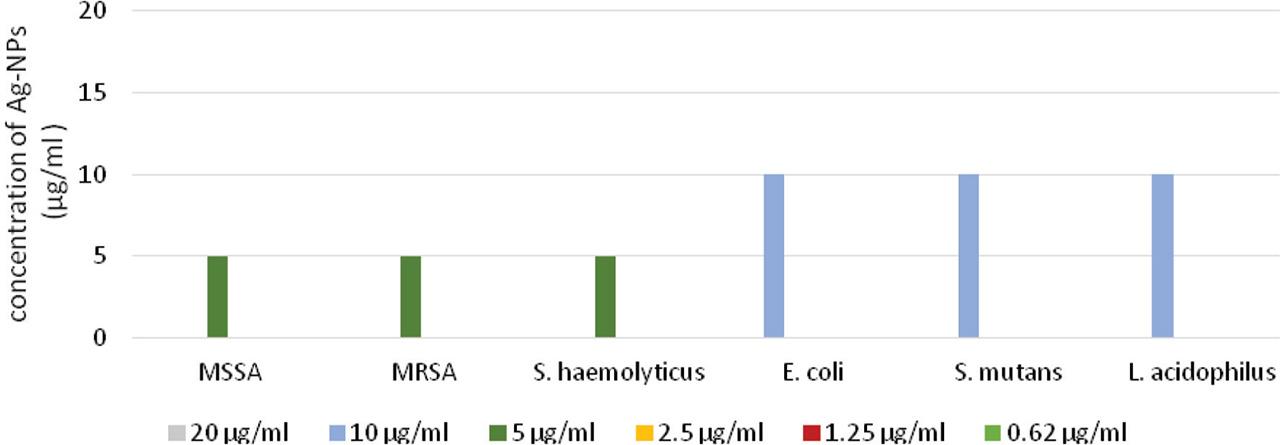
Antimicrobial activity of Ag-NPs against bacterial strains determined with the well-diffusion method. Bars represent the zones of inhibition of different concentrations of Ag-NPs for the tested bacterial strains. The data represent mean ± SD (n = 3). Ag-NPs, silver nanoparticles; MRSA, methicillin-resistant Staphylococcus aureus; MSSA, methicillin-susceptible Staphylococcus aureus.

MIC and MBC values (μg/mL) of Ag-NPs for different bacterial strains

Drug-sensitive strainsMultidrug-resistant strains


S. aureus MSSAS. mutansE. coliL. acidophilusS. aureus MRSAS. haemolyticus
MIC μg/mL5105555
MBC μg/mL2010205205
MBC/MIC ratio414141
Language: English
Submitted on: Oct 10, 2023
Accepted on: Jan 30, 2024
Published on: Feb 29, 2024
Published by: Hirszfeld Institute of Immunology and Experimental Therapy
In partnership with: Paradigm Publishing Services
Publication frequency: 1 times per year

© 2024 Maja Ptasiewicz, Renata Chałas, Joanna Idaszek, Paweł Maksymiuk, Mateusz Kister, Karolina A. Kister, Krzysztof J. Kurzydłowski, Agnieszka Magryś, published by Hirszfeld Institute of Immunology and Experimental Therapy
This work is licensed under the Creative Commons Attribution-NonCommercial-NoDerivatives 4.0 License.