
Table 1
Characteristics of the study participants
| Characteristics | N | Descriptive statistics | ||
|---|---|---|---|---|
| Total sample | Plovdiv | Other settlements | ||
| Sociodemographics | ||||
| Age [years] (mean±SD) | 90 | 45.64±6.67 | 46.48±6.07 | 44.77±7.21 |
| Male sex (N, %) | 90 | 58 (64.44) | 28 (60.90) | 30 (68.20) |
| Bulgarian ethnicity (N, %) | 90 | 83 (92.22) | 41 (89.10) | 42 (95.50) |
| Higher education (N, %) | 88 | 44 (48.89) | 21 (47.70) | 23 (50.00) |
| Perceived income [1–6 Likert scale] (median; IQR) | 65 | 2.00 (1.00) | 3.00 (1.00) | 2.00 (1.00) |
| Cytokines | ||||
| IL-6 [pg/mL] (median; IQR) | 90 | 28.50 (35.18) | 23.10 (42.82) | 29.50 (32.52) |
| TNF-α [pg/mL] (median; IQR) | 90 | 9.80 (19.30) | 8.70 (16.90) | 12.07 (20.01) |
| CRP [mg/L] (median; IQR) | 88 | 9.00 (14.00) | 5.50 (14.00) | 10.50 (12.75) |
| Visfatin [ng/mL] (median; IQR) | 90 | 6.30 (4.03) | 6.30 (3.90) | 6.30 (4.08) |
| Leptin [ng/mL] (median; IQR) | 90 | 46.50 (60.58) | 40.3 (53.32) | 59.40 (66.88) |
| Adiponectin [μg/mL] (median; IQR) | 90 | 7.62 (5.01) | 8.25 (5.58) | 6.58 (4.39) |
| Adiponectin-leptin ratio (median; IQR) | 90 | 0.13 (0.22) | 0.14 (0.22) | 0.13 (0.17) |
| Adiposity-related markers | ||||
| BMI [kg/m2] (mean±SD) | 90 | 39.65±6.50 | 39.37 (6.34) | 39.96 (6.74) |
| WHR (mean±SD) | 90 | 1.10±0.10 | 1.09 (0.10) | 1.10 (0.10) |
| Body fat [%] (mean±SD) | 90 | 38.56±7.91 | 39.32 (7.91) | 37.77 (7.92) |
| Visceral fat [%] (median; IQR) | 90 | 20.00 (4.00) | 17.85 (3.27) | 17.52 (3.08) |
| Environmental factors | ||||
| NO2 [μg/m3] (median; IQR) | 83 | 22.49 (11.53) | 27.04 (5.09) | 15.38 (2.83) |
| PM2.5 [μg/m3] (median; IQR) | 83 | 21.66 (5.57) | 22.09 (2.17) | 17.94 (7.44) |
| PM10 [μg/m3] (median; IQR) | 83 | 33.25 (7.41) | 37.08 (4.72) | 30.17 (6.52) |
| Solid fuel burning (N, %) | 90 | 37 (41.11) | 2 (4.35) | 35 (79.55) |
| Lden [dB] (median; IQR) | 42 | 68.61 (2.82) | 68.61 (2.82) | - |
| NDVI (median; IQR) | 84 | 0.39 (0.09) | 0.39 (0.09) | 0.39 (0.10) |
| Tree cover [%] (median; IQR) | 83 | 4.77 (7.15) | 7.87 (6.23) | 2.29 (3.31) |
| Time in nature [hours/week] (median; IQR) | 90 | 2.00 (2.50) | 2.00 (2.87) | 3.00 (2.13) |
| Other covariates | ||||
| Smoker (N, %) | 90 | 52 (57.78) | 26 (56.52) | 26 (59.09) |
| Self-rated health [1–5 Likert scale] (median; IQR) | 88 | 2.00 (1.00) | 2.00 (1.00) | 3.00 (1.00) |
| Plovdiv city (N, %) | 90 | 46 (51.11) | - | - |
| Population [people] (median; IQR) | 42 | 3402.50 (1487) | 3402.50 (1487) | - |
| Building type (N, %) | 90 | |||
| Apartment building | 43 (47.78) | 35 (76.09) | 8 (18.18) | |
| Detached house | 17 (18.89) | 3 (6.52) | 14 (31.82) | |
| Multifamily house | 28 (31.11) | 8 (17.39) | 20 (45.45) | |
| Other | 2 (2.22) | 0 (0) | 2 (4.55) | |
[i] BMI – body mass index; CRP – C-reactive protein; IQR – interquartile range; IL-6 – interleukin-6; Lden – A-weighted day-evening-night sound levels; NDVI – normalized difference vegetation index; NO2 – nitrogen dioxide; PM10 – particulate matter with aerodynamic diameter ≤10 μm; PM2.5 – particulate matter with aerodynamic diameter ≤2.5 μm; SD – standard deviation; TNF-α – tumour necrosis factor alpha; WHR – waist-to-hip ratio
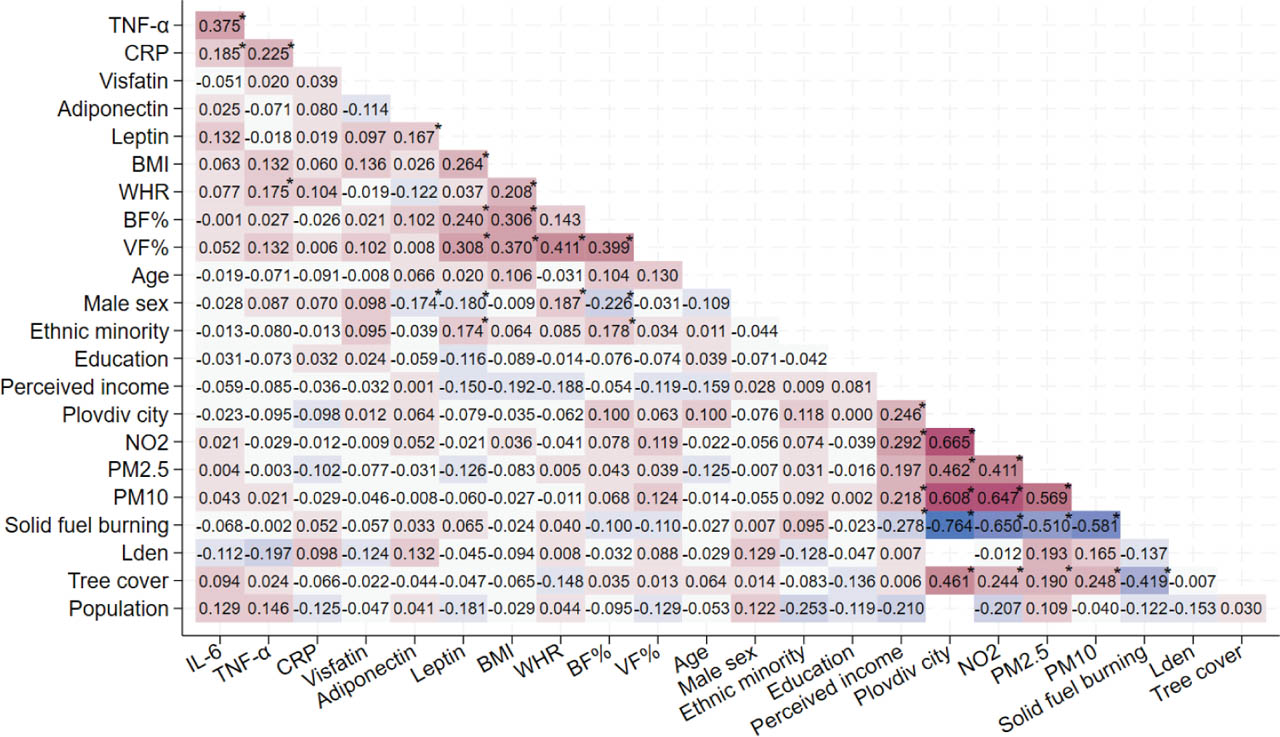
Figure 1
Kendall's tau correlations between proinflammatory markers, adipokines, environmental factors, and other covariates (warmer red shades represent higher positive and colder blue shades represent higher negative correlations) * p<0.05. BF% – body fat percent; BMI – body mass index; CRP – C-reactive protein; IL-6 – interleukin-6; Lden – A-weighted day-evening-night sound levels; NDVI – normalized difference vegetation index; NO2 – nitrogen dioxide; PM10 – particulate matter with aerodynamic diameter ≤10 μm; PM2.5 – particulate matter with aerodynamic diameter ≤2.5 μm.TNF-α – tumour necrosis factor alpha; VF% – visceral fat percent; WHR – waist-to-hip ratio
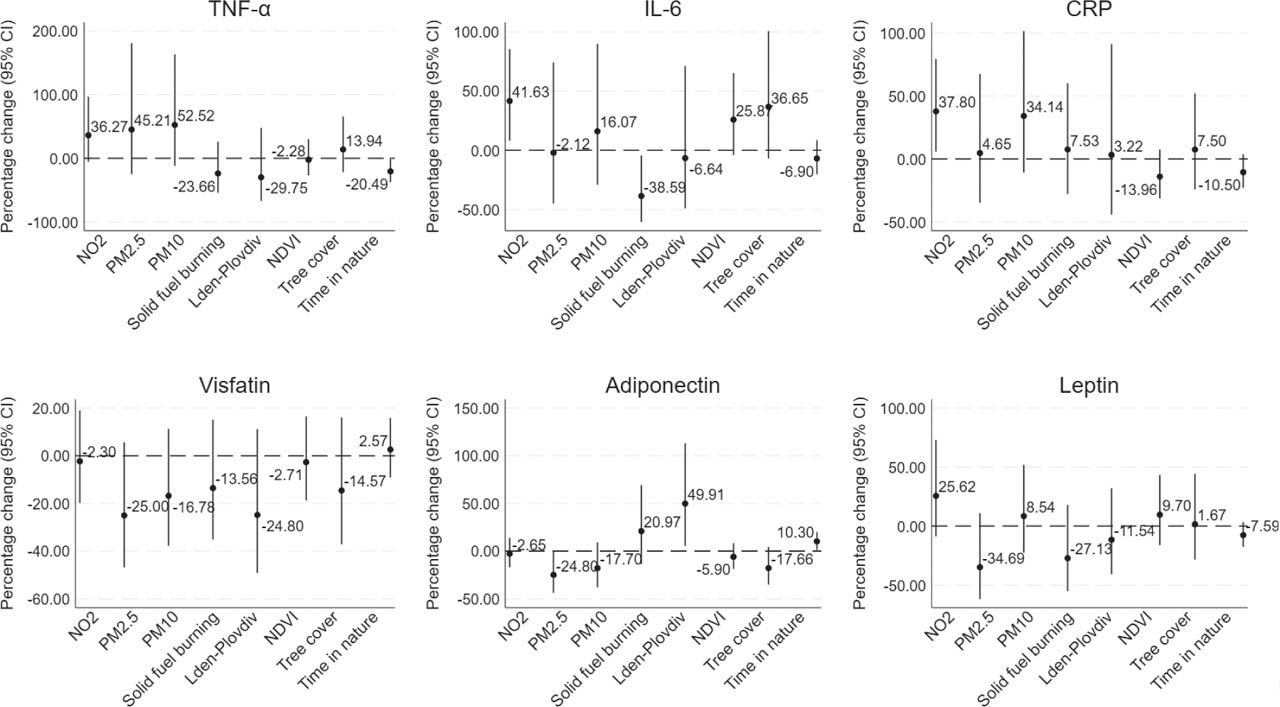
Figure 2
Percentage change in cytokine levels in association with environmental factors. The models are adjusted for age, sex, ethnicity, education, perceived income adequacy, and settlement (for the noise model, settlement was replaced by population). The exposures are tested one-at-a-time in separate models. Coefficients shown are percentage change scores with 95 % confidence intervals, expressed per 10 μg/m3 NO2, PM2.5, and PM10, per 5 dB Lden, per 0.1 in NDVI, per 10 % tree cover, and per 2 h/week in nature. Confidence intervals not crossing the horizontal reference line indicate statistically significant estimates. CRP – C-reactive protein; IL-6 – interleukin-6; Lden – A-weighted day-evening-night sound levels; NDVI – normalised difference vegetation index; NO2 – nitrogen dioxide; PM10 – particulate matter with aerodynamic diameter ≤10 μm; PM2.5 – particulate matter with aerodynamic diameter ≤2.5 μm; TNF-α – tumour necrosis factor alpha
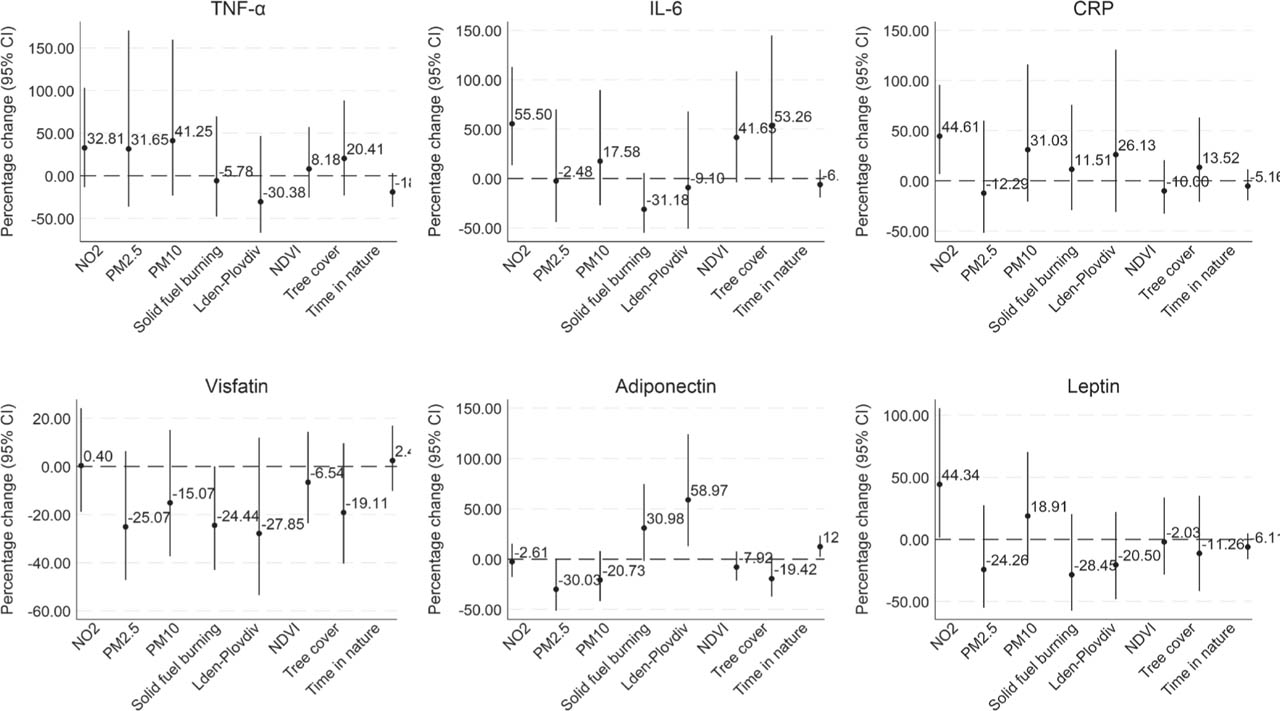
Figure 3
Percentage change in cytokine levels in association with environmental exposures – fully adjusted models. The models are adjusted for age, sex, ethnicity, education, perceived income adequacy, self-rated health, building type, smoking, and settlement (for the noise model, settlement was replaced by population). The exposures are tested one-at-a-time in separate models. Coefficients shown are percentage change scores with 95 % confidence intervals, expressed per 10 μg/m3 NO2, PM2.5, and PM10, per 5 dB Lden, per 0.1 in NDVI, per 10 % tree cover, and per 2 h/week in nature. Confidence intervals not crossing the horizontal reference line indicate statistically significant estimates. CRP – C-reactive protein; IL-6 – interleukin-6; Lden – A-weighted day-evening-night sound levels; NDVI – normalised difference vegetation index; NO2 – nitrogen dioxide; PM10 – particulate matter with aerodynamic diameter ≤10 μm; PM2.5 – particulate matter with aerodynamic diameter ≤2.5 μm; TNF-α – tumour necrosis factor alpha
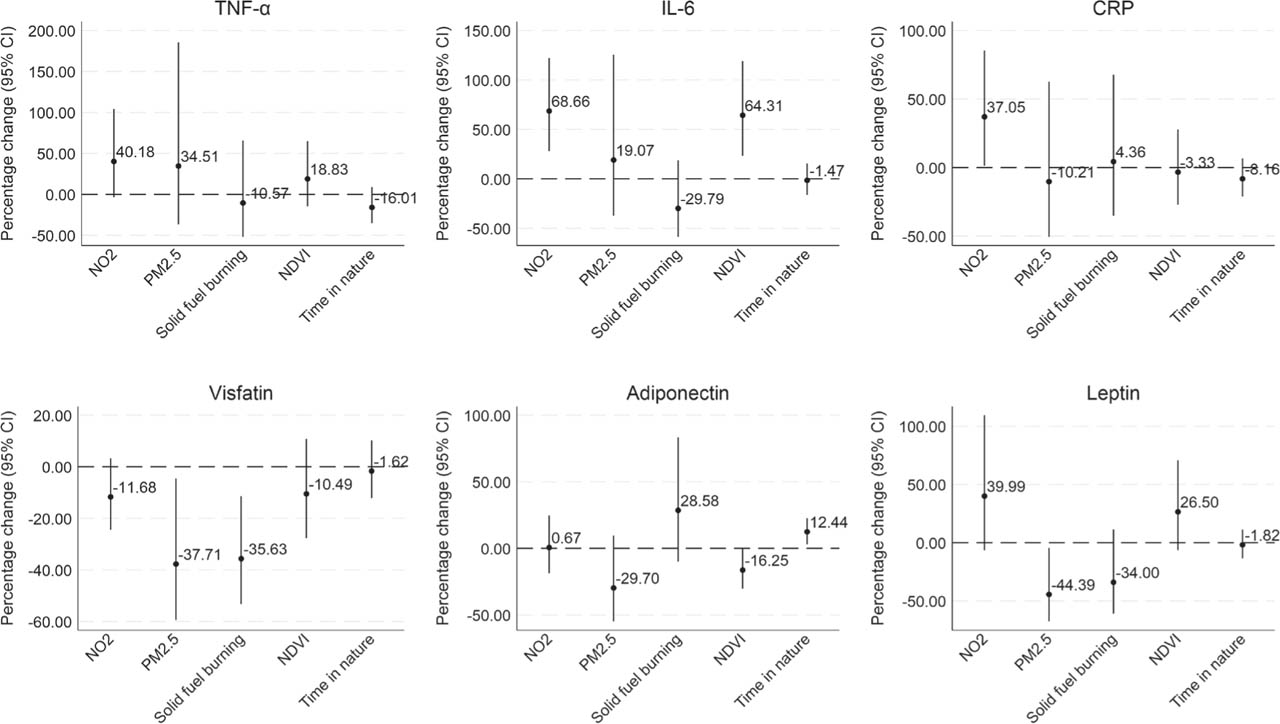
Figure 4
Percentage change in cytokine levels in association with environmental exposures – multi-exposure models. The models are adjusted for age, sex, ethnicity, education, perceived income adequacy, and settlement (for the noise model, settlement was replaced by population). The exposures are adjusted for each other and tested all at once. Coefficients shown are percentage change scores with 95 % confidence intervals, expressed per 10 μg/m3 NO2, PM2.5, per 0.1 in NDVI, and per 2 h/week in nature. Confidence intervals not crossing the horizontal reference line indicate statistically significant estimates. CRP – C-reactive protein; IL-6 – interleukin-6; NDVI – normalised difference vegetation index; NO2 – nitrogen dioxide; PM2.5 – particulate matter with aerodynamic diameter ≤2.5 μm; TNF-α – tumour necrosis factor alpha
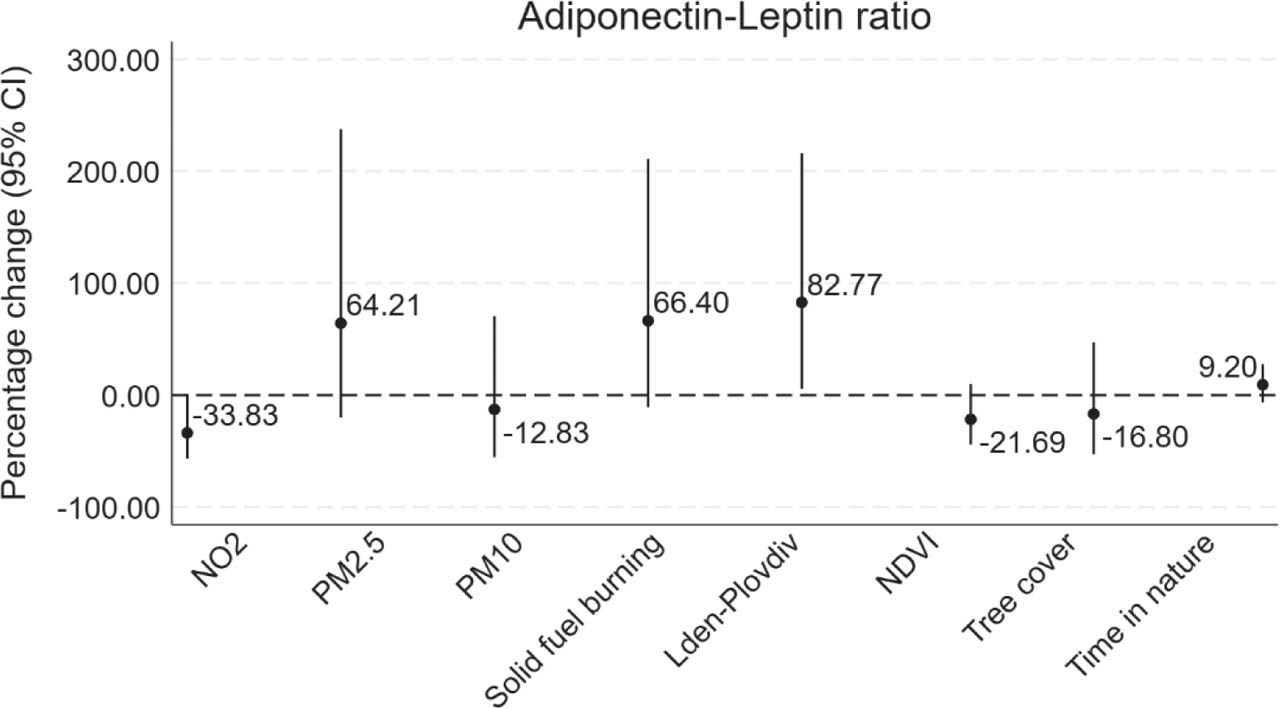
Figure 5
Percentage change in adiponectin-leptin ratio in association with environmental factors. The models are adjusted for age, sex, ethnicity, education, perceived income adequacy, and settlement (for the noise model, settlement was replaced by population). The exposures are tested one-at-a-time in separate models. Coefficients shown are percentage change scores with 95 % confidence inter vals, expressed per 10 μg/m3 NO2, PM2.5, and PM10, per 5 dB Lden, per 0.1 in NDVI, per 10 % tree cover, and per 2 h/week in nature. Confidence intervals not crossing the horizontal reference line indicate statistically significant estimates. Lden – A-weighted day-evening-night sound levels; NDVI – normalised difference vegetation index; NO2 – nitrogen dioxide; PM10 – particulate matter with aerodynamic diameter ≤10 μm; PM2.5 – particulate matter with aerodynamic diameter ≤2.5 μm
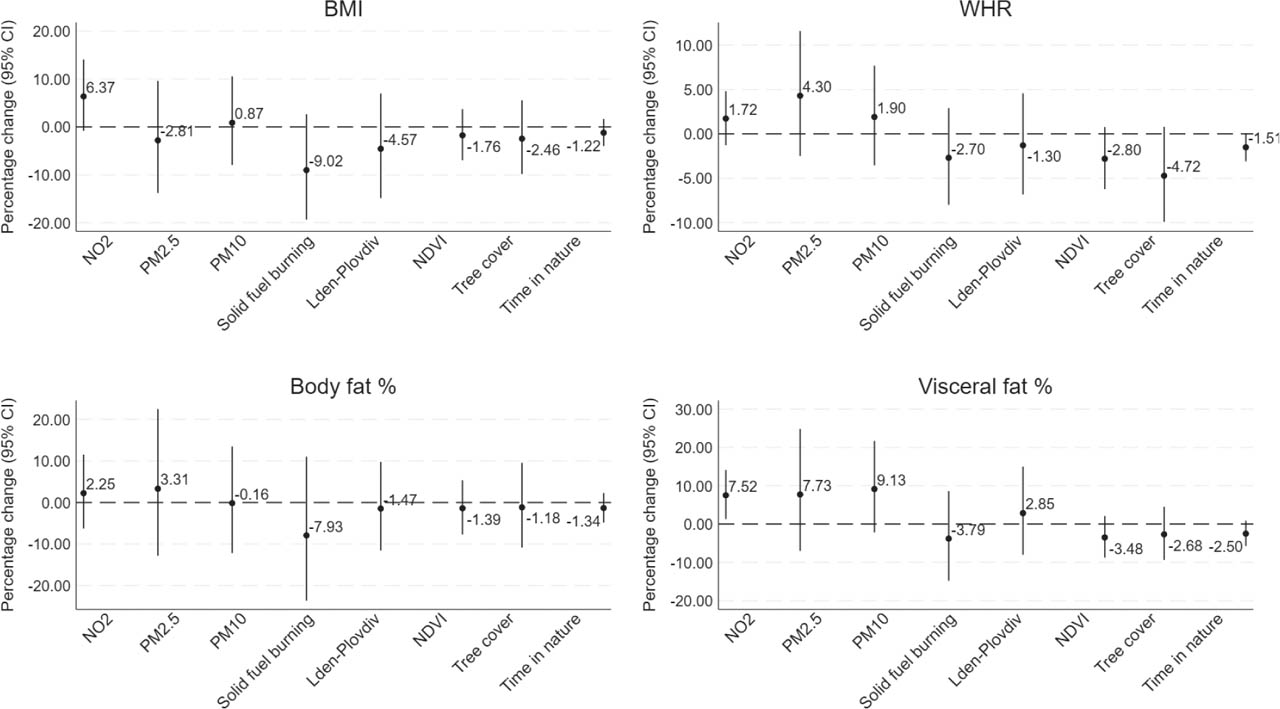
Figure 6
Percentage change in adiposity markers in association with environmental factors. The models are adjusted for age, sex, ethnicity, education, perceived income adequacy, and settlement (for the noise model, settlement was replaced by population). The exposures are tested one-at-a-time in separate models. Coefficients shown are percentage change scores with 95 % confidence intervals, expressed per 10 μg/m3 NO2, PM2.5, and PM10, per 5 dB Lden, per 0.1 units in NDVI, per 10 % tree cover, and per 2 h/week in nature. Confidence intervals not crossing the horizontal reference line indicate statistically significant estimates. BMI – body mass index; Lden – A-weighted day-evening-night sound levels; NDVI – normalised difference vegetation index; NO2 – nitrogen dioxide; PM10 – particulate matter with aerodynamic diameter ≤10 μm; PM2.5 – particulate matter with aerodynamic diameter ≤2.5 μm; WHR – waist-to-hip ratio