
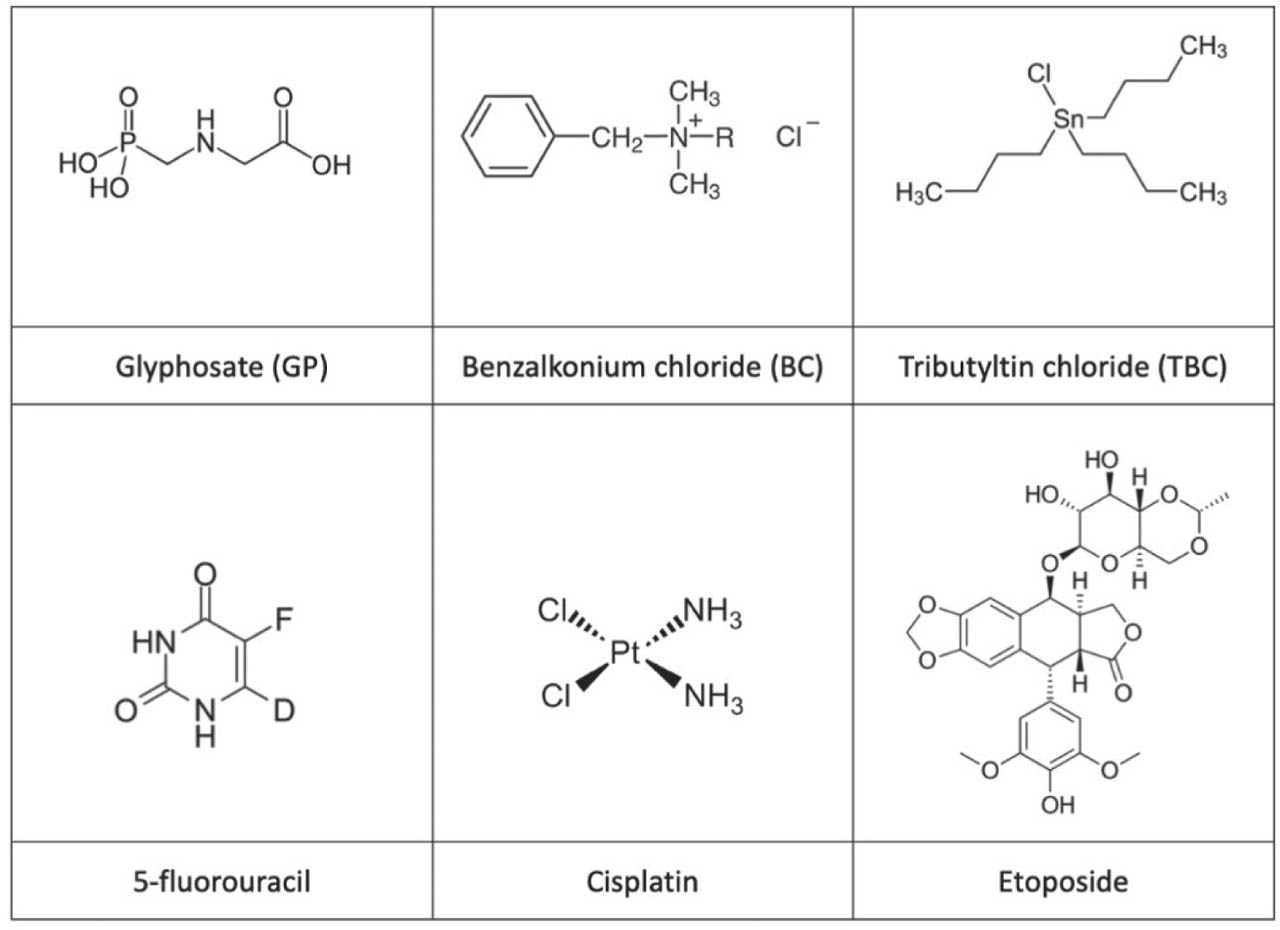
Figure 1
Chemical structure of the tested compounds
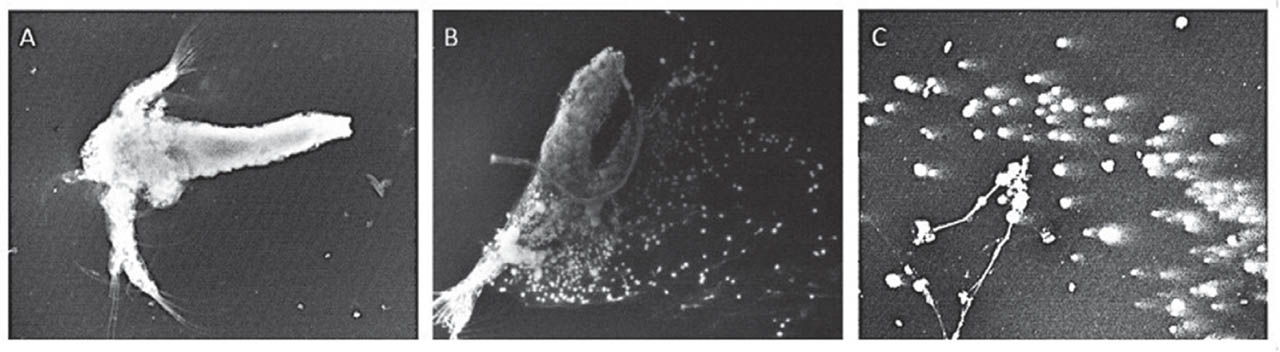
Figure 2
Fluorescence microscopy of A) A. salina nauplii embedded in agarose (100× magnification); B) nauplii partially broken into cells (100× magnification), and C) nauplii completely broken in cell suspension (200× magnification)
Table 1
Mean acute toxicity of tested environmental pollutants on A. salina
| LC50 | Glyphosate (µg/mL) | Benzalkonium chloride (µg/mL) | Tributyltin chloride (µg/mL) | Potassium dichromate (K2Cr2O7)* (µg/mL) |
|---|---|---|---|---|
| 4 h | 160.58±7.77 | 14.15±3.60 | >1.2 | 40.60±1.78 |
| 24 h | 128.20±17.78 | 12.38±1.19 | 0.63±0.03 | 38.50±3.69 |
| 48 h | 42.79±12.44 | 7.45±2.07 | 0.55±0.01 | 21.54±3.86 |
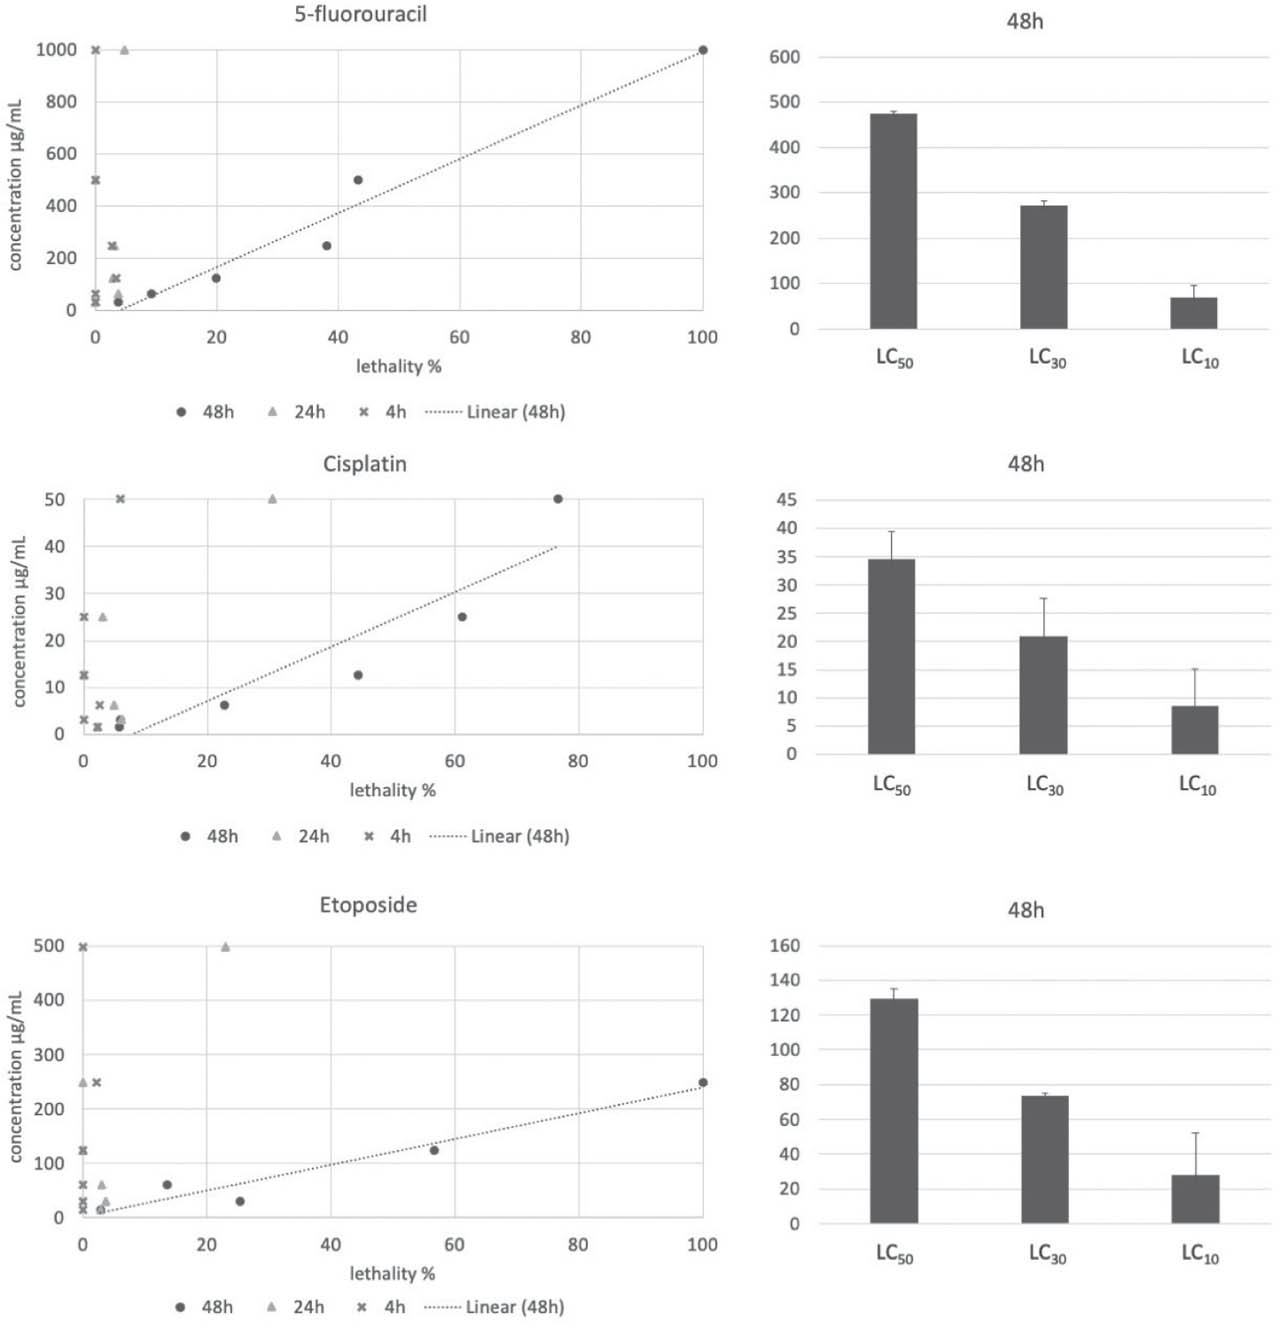
Figure 3
5-fluorouracil, cisplatin, and etoposide toxicity in A. salina over 4 h, 24 h, and 48 h of incubation. Lines represent a trend according to the toxicity results obtained for each concentration for a 48 h incubation period that was used to determine mean (±SD) LC50, LC30, and LC10 values (right)
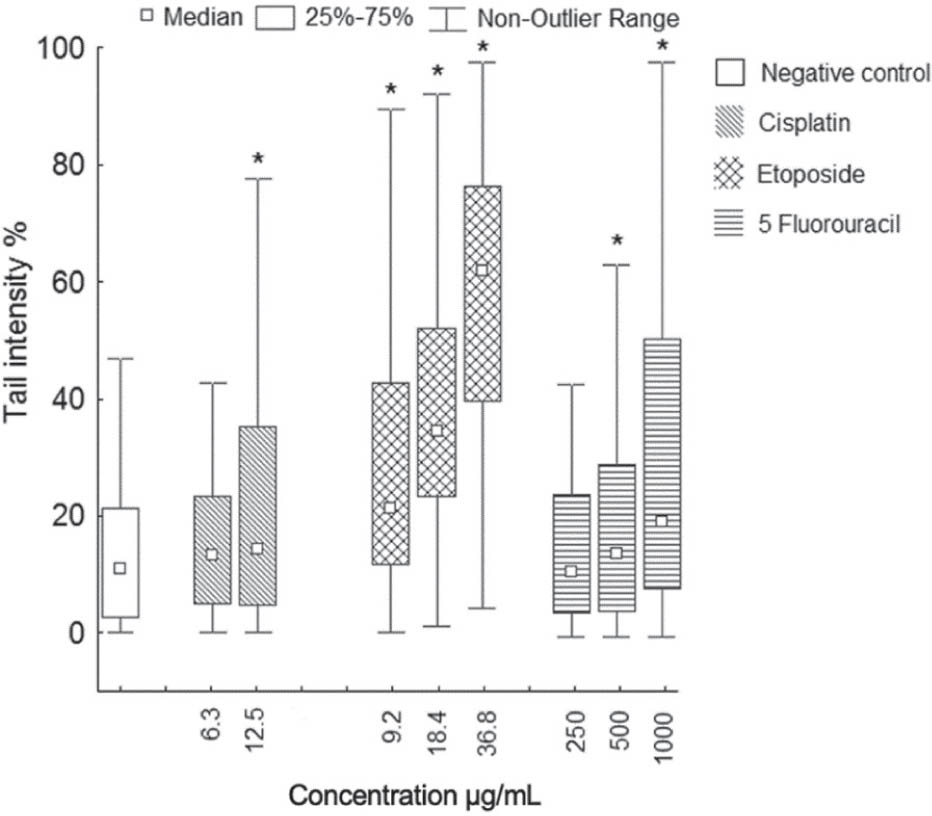
Figure 4
Level of DNA damage measured by tail intensity (%) in the cells of A. salina (150 analysed nucleoids per group). *significant increase in DNA damage compared to negative control (P<0.05; Kruskal-Wallis and Mann-Whitney U test)
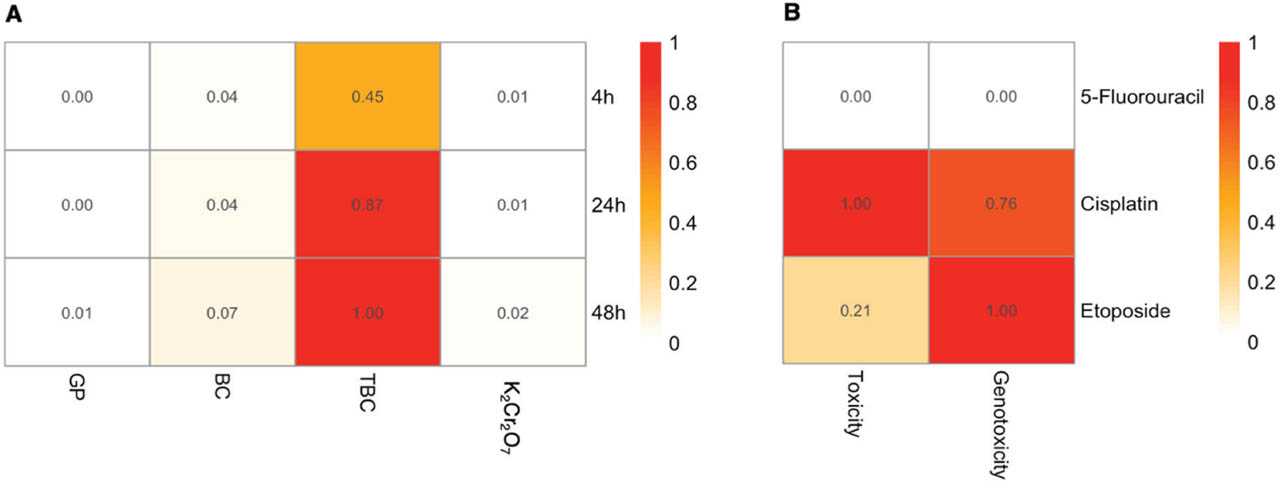
Figure 5
Normalised heatmap comparing A) the acute toxicity (expressed as inverse LC50 values) of glyphosate (GP), benzalkonium chloride (BC), and tributyltin chloride (TBC) and B) the acute toxicity and genotoxicity of three 5-fluorouracil, cisplatin, and etoposide. Higher values (red) represent greater biological effect