
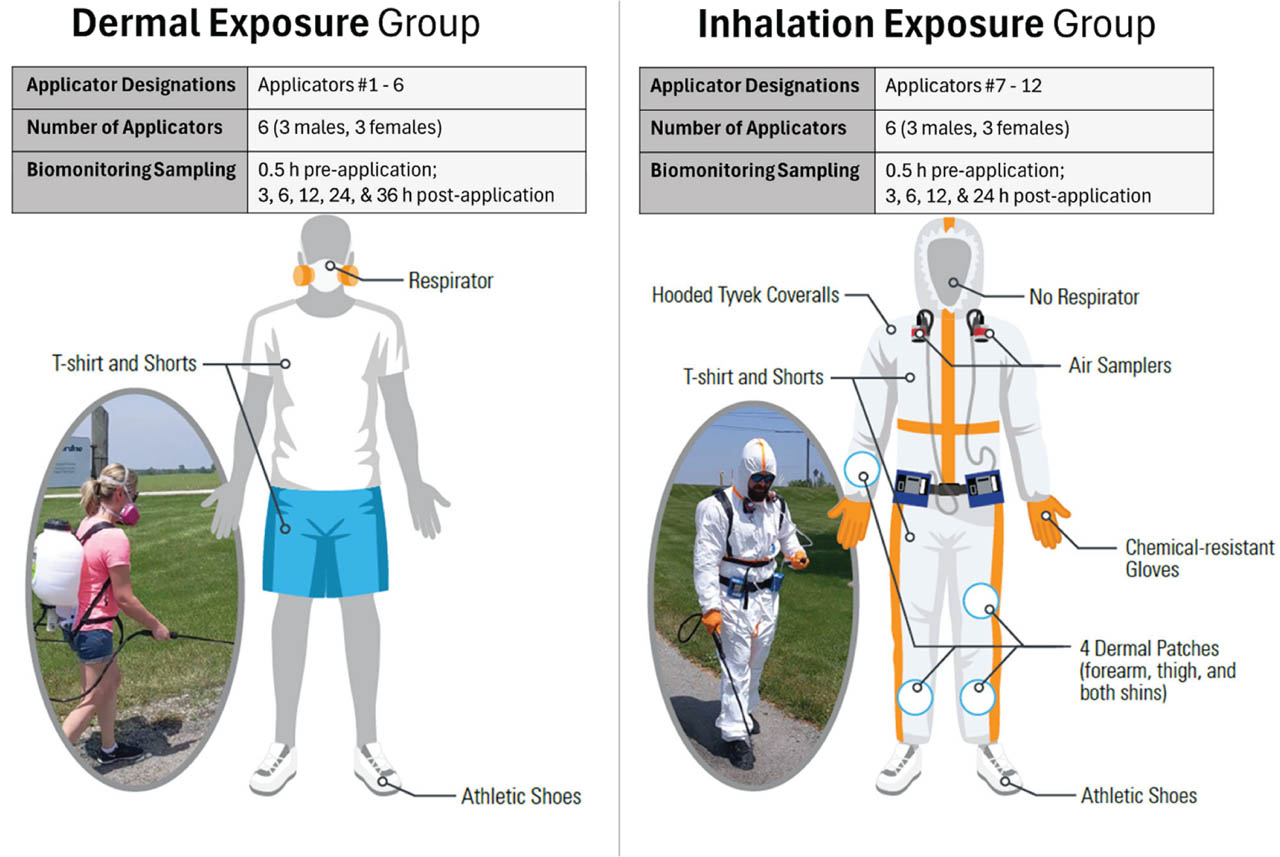
Figure 1
Study design schematic for dermal versus inhalation exposure groups. Left: Dermal exposure group, in which applicators wore typical summer clothing (t-shirt, shorts, and athletic shoes) and a half-face respirator, with no dermal patches applied because the skin was directly exposed. Right: Inhalation exposure group, in which applicators wore Tyvek® coveralls covering the arms, legs, and torso, along with chemical-resistant gloves, but no respirator. Four dermal patches were placed on the outside of the coveralls at the shins, thigh, and forearm (shown as blue-outlined circles) to measure potential dermal deposition. All other aspects of the exposure scenario, including spray equipment, product concentration, application duration, and total volume applied, were identical for both groups
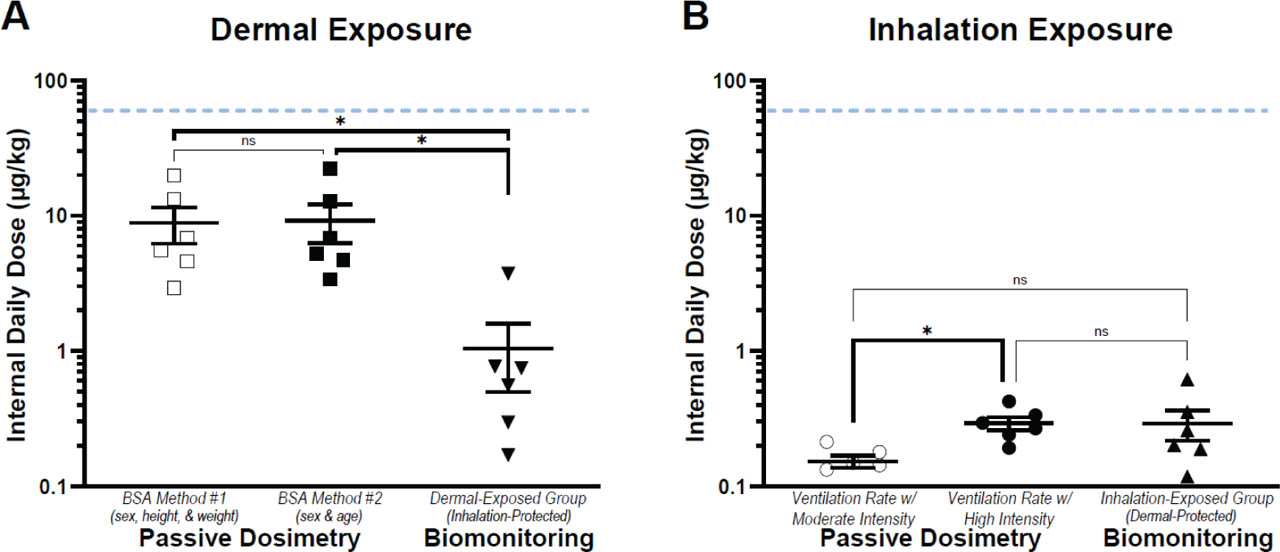
Figure 2
Different techniques and assumptions in estimating internal daily doses of glyphosate originating from A) dermal exposure and B) inhalation exposure. Bars represent mean ± SEM. The blue-dotted line represents the internal dose benchmark derived from the most conservative regulatory health-based guidance value established for glyphosate. *p<0.05; ns: not statistically significant
Table 1
Apportioned body regions and the corresponding patch, clothing protection, and assumed clothing penetration factor used in estimations of internal dose resulting from dermal exposure for each individual applicator
| Apportioned Body Region | BSA Method #1 (sex, height, weight) | BSA Method #2 (age & sex) | Patch Used | Clothing Protection | Clothing Penetration Factor | Dermal Absorption Factor |
|---|---|---|---|---|---|---|
| Head | ✓ | ✓ | minimum of all four patches | No | 1 | 0.01 |
| Trunk | ✓ | ✓ | minimum of all four patches | Yes | 0.1049 | 0.01 |
| Upper arms | † | † | minimum of all four patches | Yes | 0.1049 | 0.01 |
| Forearms | † | † | forearm | No | 1 | 0.01 |
| Hands | ✓ | ✓ | forearm | No | 1 | 0.01 |
| Thighs | ✓ | † | thigh | Yes | 0.1049 | 0.01 |
| Lower legs | ✓ | † | average of lower leg patches | No | 1 | 0.01 |
| Feet | ✓ | ✓ | average of lower leg patches | Yes | 0.1049 | 0.01 |
† Using data from the 2011 Exposure Factors Handbook (22), a regional BSA for both arms entirely (i.e., not separately for the upper arms and forearms) was provided; therefore, to adequately apply a clothing protection factor for the upper arms and exclude it from the forearms as the applicators wore t-shirts, it was assumed that 45 % of the arm’s surface area was attributed to the forearms and 55 % to the upper arms (22). Similarly, for the dataset used in Method #2, which only provided a regional BSA for both legs entirely and not separately for the thighs and lower legs, it was assumed that 40 % of the leg’s surface area was attributed to the lower legs and 60 % to the thighs (22)
Table 2
Applicator-specific information from the six applicators in the inhalation exposure group, including estimated total body surface areas (BSAs), body weight-adjusted ventilation rates (Rp), and glyphosate concentrations determined in dermal patch and breathing zone air samples
| Applicator #7 | Applicator #8 | Applicator #9 | Applicator #10 | Applicator #11 | Applicator #12 | ||
|---|---|---|---|---|---|---|---|
| Sex | Male | Female | Male | Female | Male | Female | |
| Dermal considerations | |||||||
| Age group | 30s | 30s | 30s | 20s | 20s | 20s | |
| Estimated BSA (cm2): Method #1 | 23,335 | 17,510 | 24,040 | 15,454 | 21,868 | 15,310 | |
| Estimated BSA (cm2): Method #2 | 22,449 | 18,149 | 22,449 | 17,756 | 21,915 | 17,756 | |
| Inhalation considerations | |||||||
| Age group | 31 to <41 | 31 to <41 | 21 to <31 | 21 to <31 | 21 to <31 | 21 to <31 | |
| Rp (m3/min-kg) for moderate-intensity activities | 0.000344 | 0.000304 | 0.000345 | 0.000316 | 0.000345 | 0.000316 | |
| Rp (m3/min-kg) for high-intensity activities | 0.000625 | 0.00059 | 0.000644 | 0.000627 | 0.000644 | 0.000627 | |
| Sample location | Dermal patch glyphosate concentrations (µg/cm2) | Average | |||||
| Left shina | 37.89 | 2.72 | 5.75 | 6.95 | 2.40 | 36.62 | 15.39 |
| Right shina | 42.94 | 6.19 | 28.41 | 5.62 | 0.95 | 2.46 | 14.43 |
| Forearmb | 0.055 | 7.58 | 0.19 | 0.76 | 16.42 | 25.89 | 8.48 |
| Thighc | 0.82 | 2.53 | 0.57 | 0.63 | 22.10 | 35.99 | 10.44 |
| Average | 20.43 | 4.75 | 8.73 | 3.49 | 10.47 | 25.24 | 12.18 |
| Sample location | Breathing zone air glyphosate concentrations (µg/m3) | Average | |||||
| Left lapel | 4.4 | 3.5 | 5.2 | 5.7 | 4.8 | 7.5 | 5.2 |
| Right lapel | 3.3 | 3.0 | 3.1 | 3.7 | 5.6 | 6.0 | 4.1 |
| Average | 3.9 | 3.3 | 4.2 | 4.7 | 5.2 | 6.8 | 4.7 |
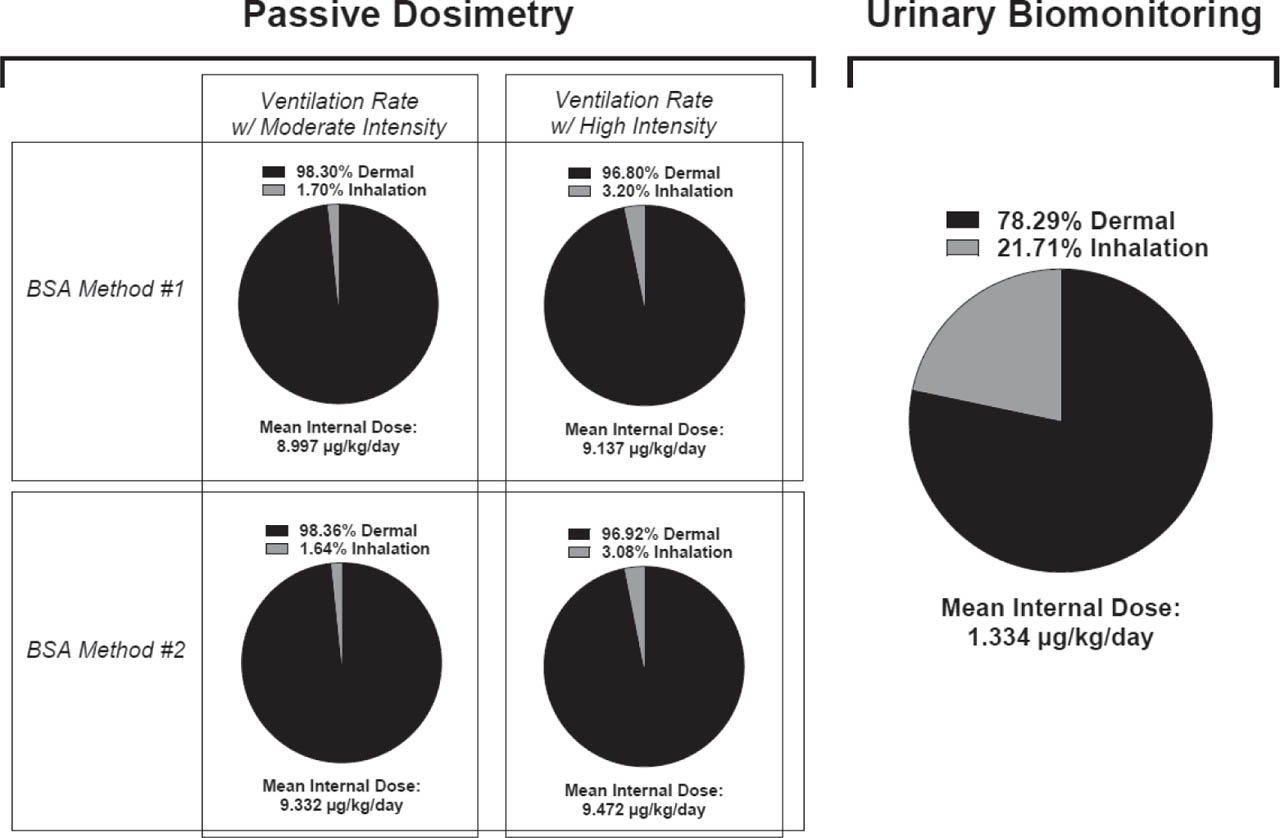
Figure 3
Mean total internal doses of glyphosate estimated from summing those derived from dermal patch data and air sampling data across the different methods and ventilation rates (passive dosimetry) alongside an approximate route-combined biomonitoring-derived internal dose estimated by summing mean internal doses from the dermal and inhalation exposure groups