
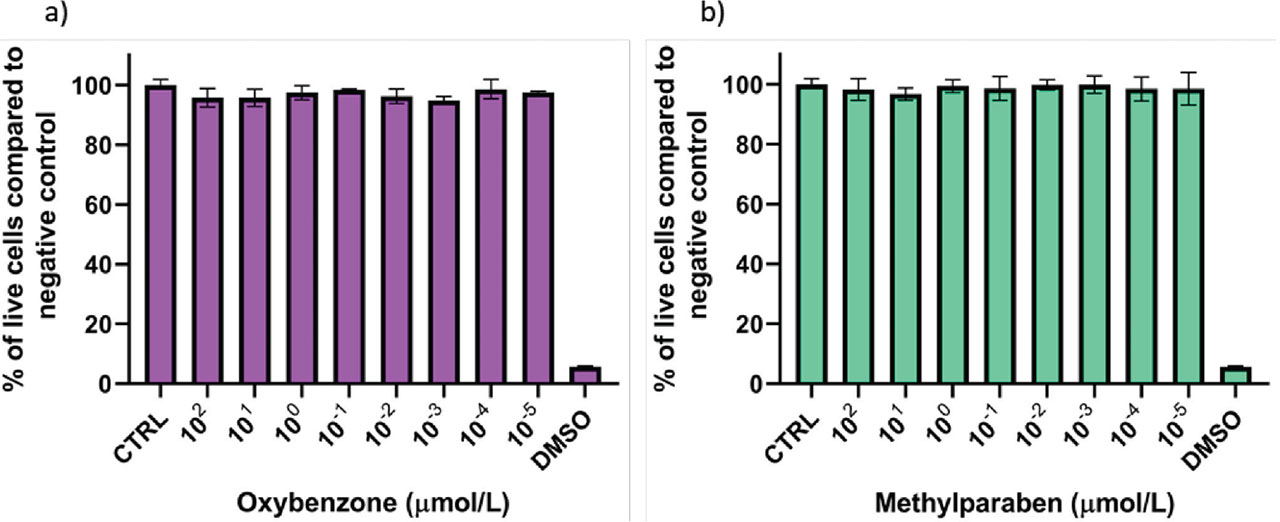
Figure 1
Viability of HeLa-9903 cells treated with: a) oxybenzone and b) methylparaben. The results are given as mean % of live cells vs negative control (untreated cells) and denote means with standard deviations of six replicates from two individual experiments. Cells treated with 10 % (v/v) DMSO served as positive control
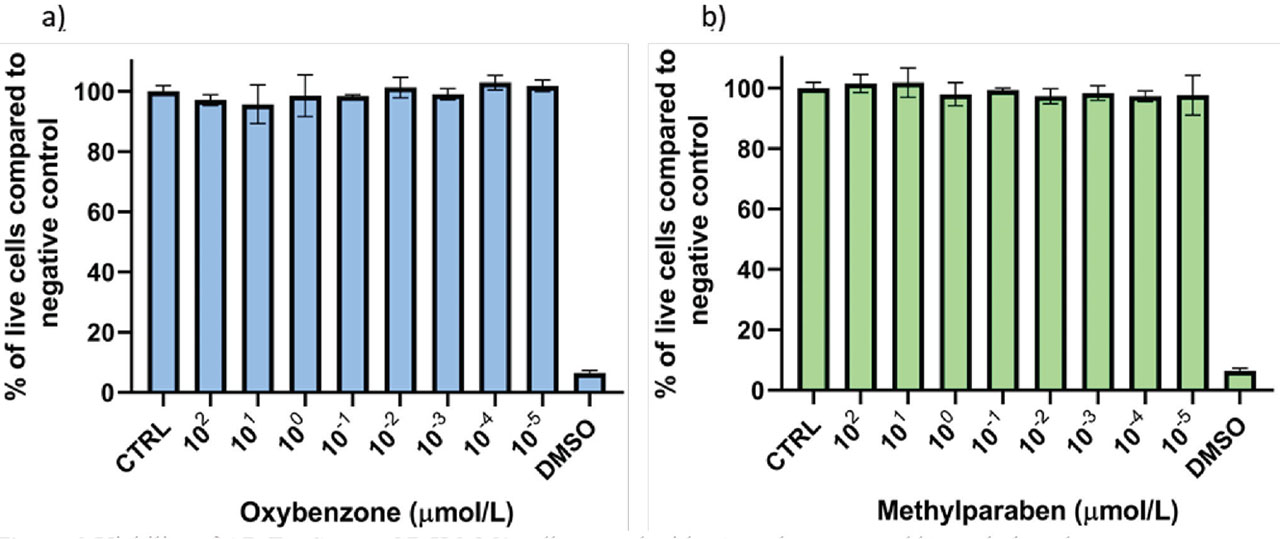
Figure 2
Viability of AR-EcoScreen GR KO M1 cells treated with: a) oxybenzone and b) methylparaben. The results are given as mean % of live cells vs negative control (untreated cells) and denote means with standard deviations of six replicates from two individual experiments. Cells treated with 10 % (v/v) DMSO served as positive control
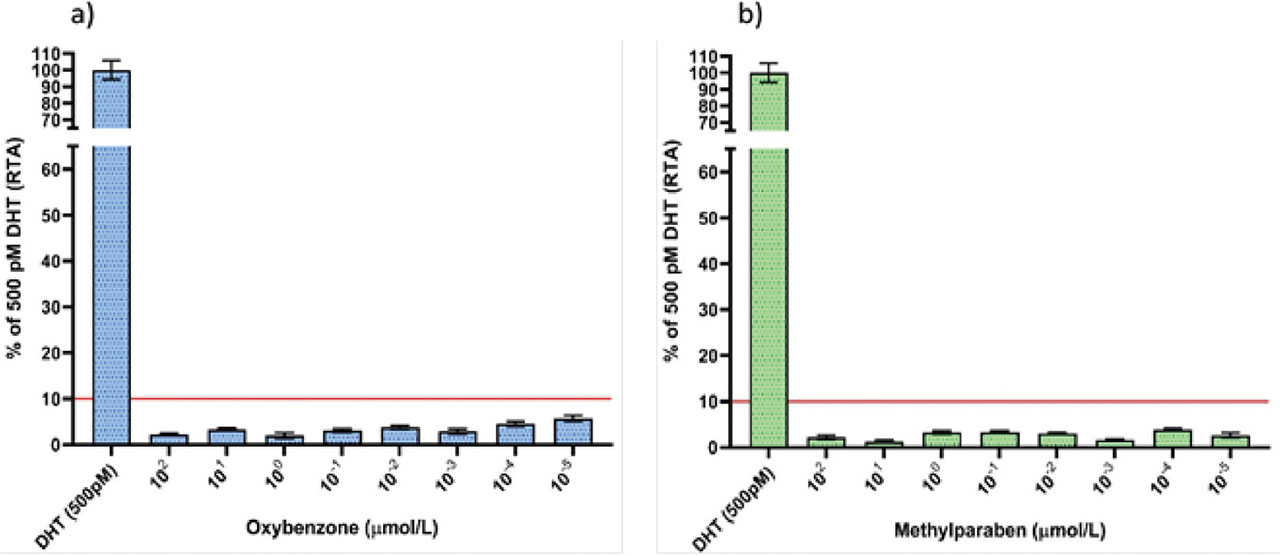
Figure 3
Androgenic activity of a) oxybenzone and b) methylparaben in the AR-EcoScreen GR KO M1 cell line. The results are given as mean % of inhibition vs positive control (500 pmol/L dihydrotestosterone) and denote means with standard deviations (error bars) of six replicates from two individual experiments. Standard deviations are given as error bars
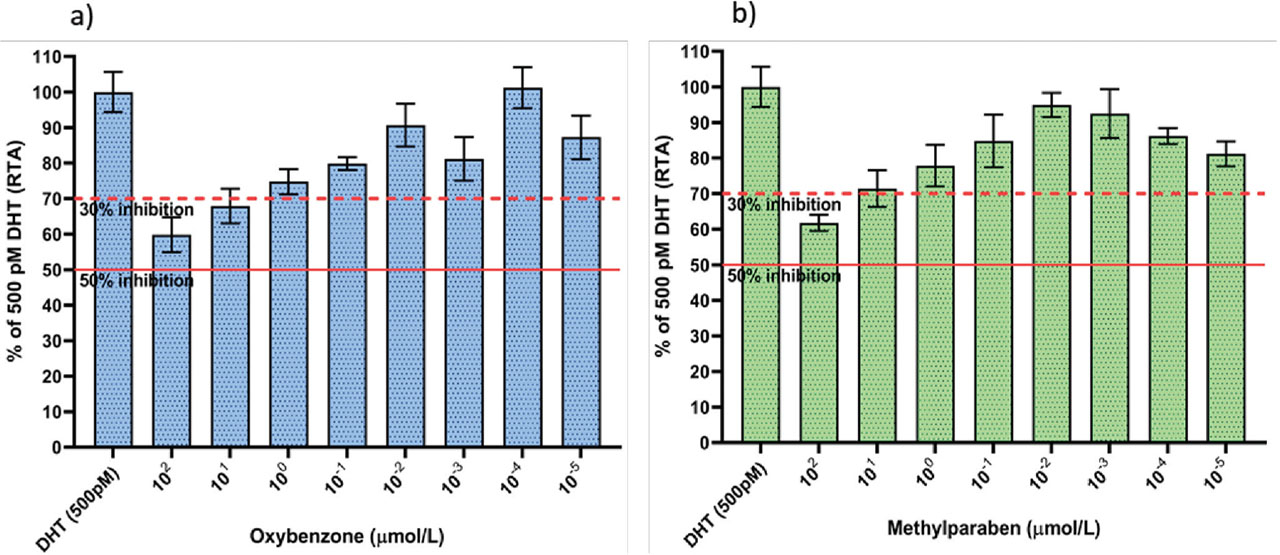
Figure 4
Anti-androgenic activity of a) oxybenzone and b) methylparaben in the AR-EcoScreen GR KO M1 cell line. The results are given as mean % of inhibition vs positive control (500 pmol/L dihydrotestosterone) and denote means with standard deviations (error bars) of six replicates from two individual experiments. Standard deviations are given as error bars
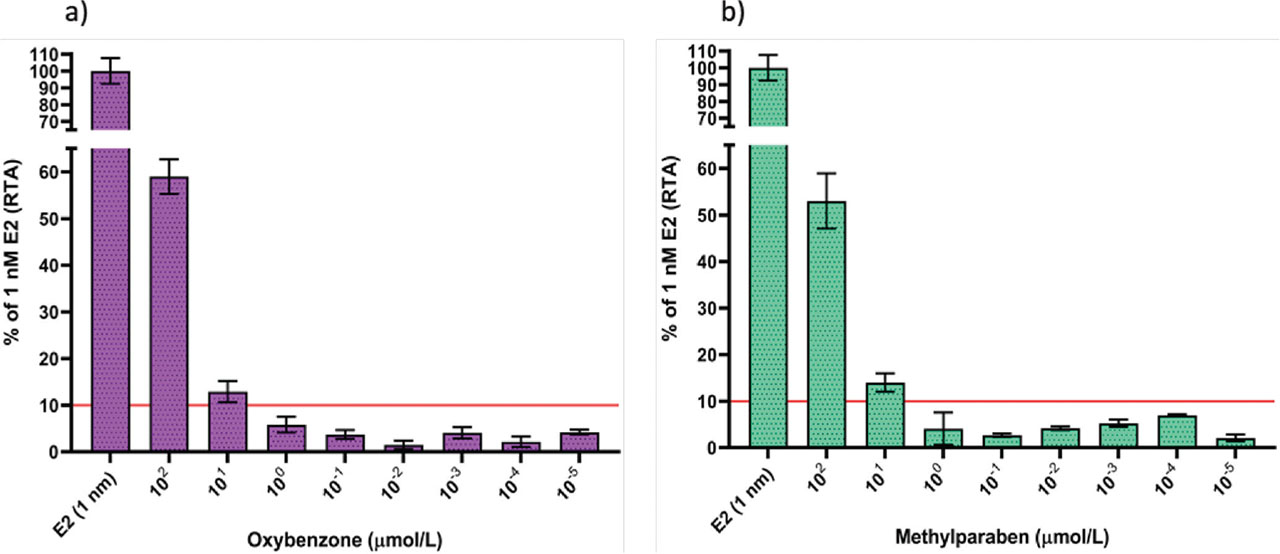
Figure 5
Estrogenic activity of a) oxybenzone and b) methylparaben in HeLa-9903 cells. The results are given as mean % of inhibition vs positive control (1 nmol/L 17 β-oestradiol) and denote means with standard deviations (error bars) of six replicates from two individual experiments. Standard deviations are given as error bars