
Figure 1
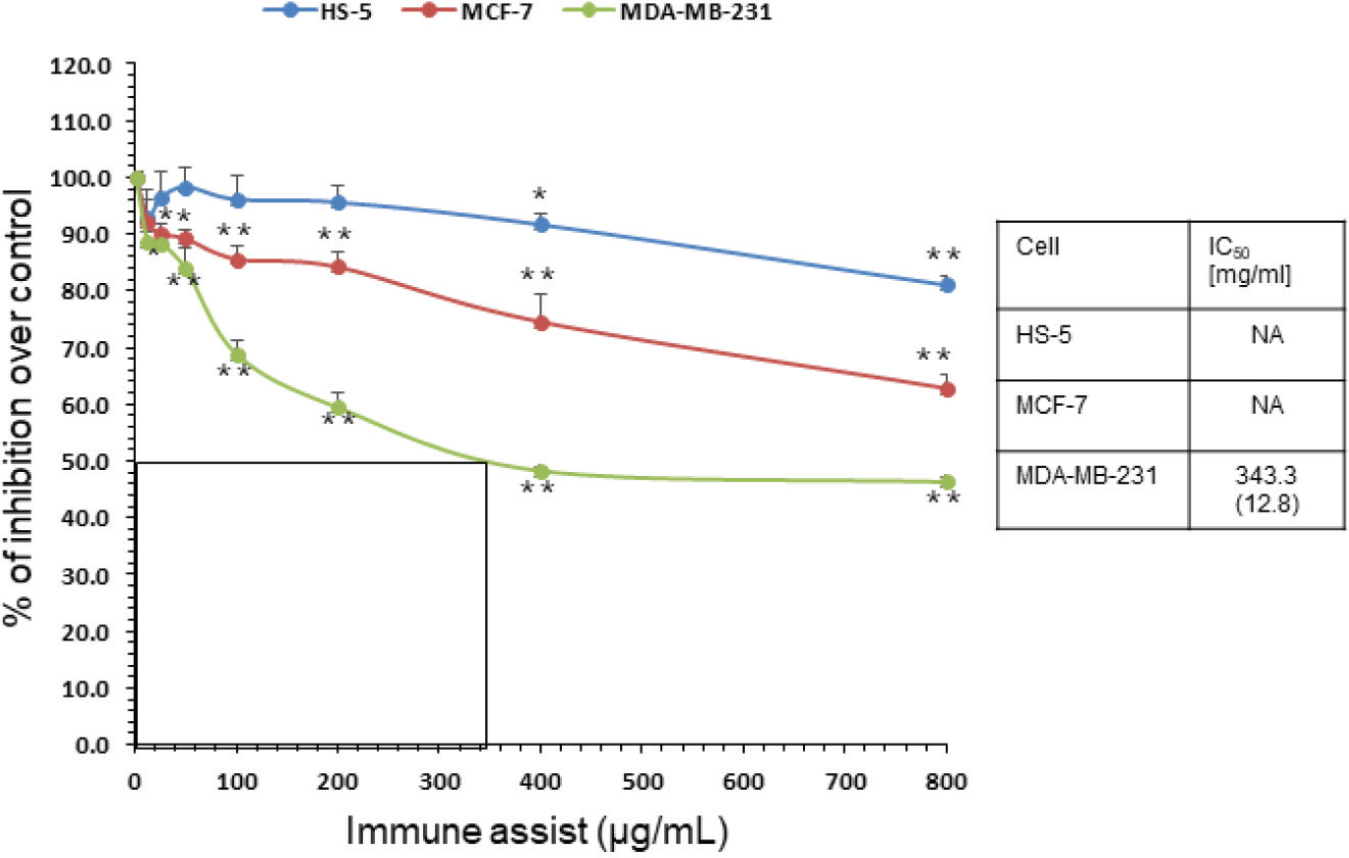
Evaluation of the cytotoxic effects of Immune Assist on HS-5, MCF-7, and MDA-MB-231 cell lines using MTT assay measured after 72 hours treatment. Results are shown as mean±SEM. Statistical significance was assessed using Student’s t-test. *p<0.05,**p<0.005 vs. control
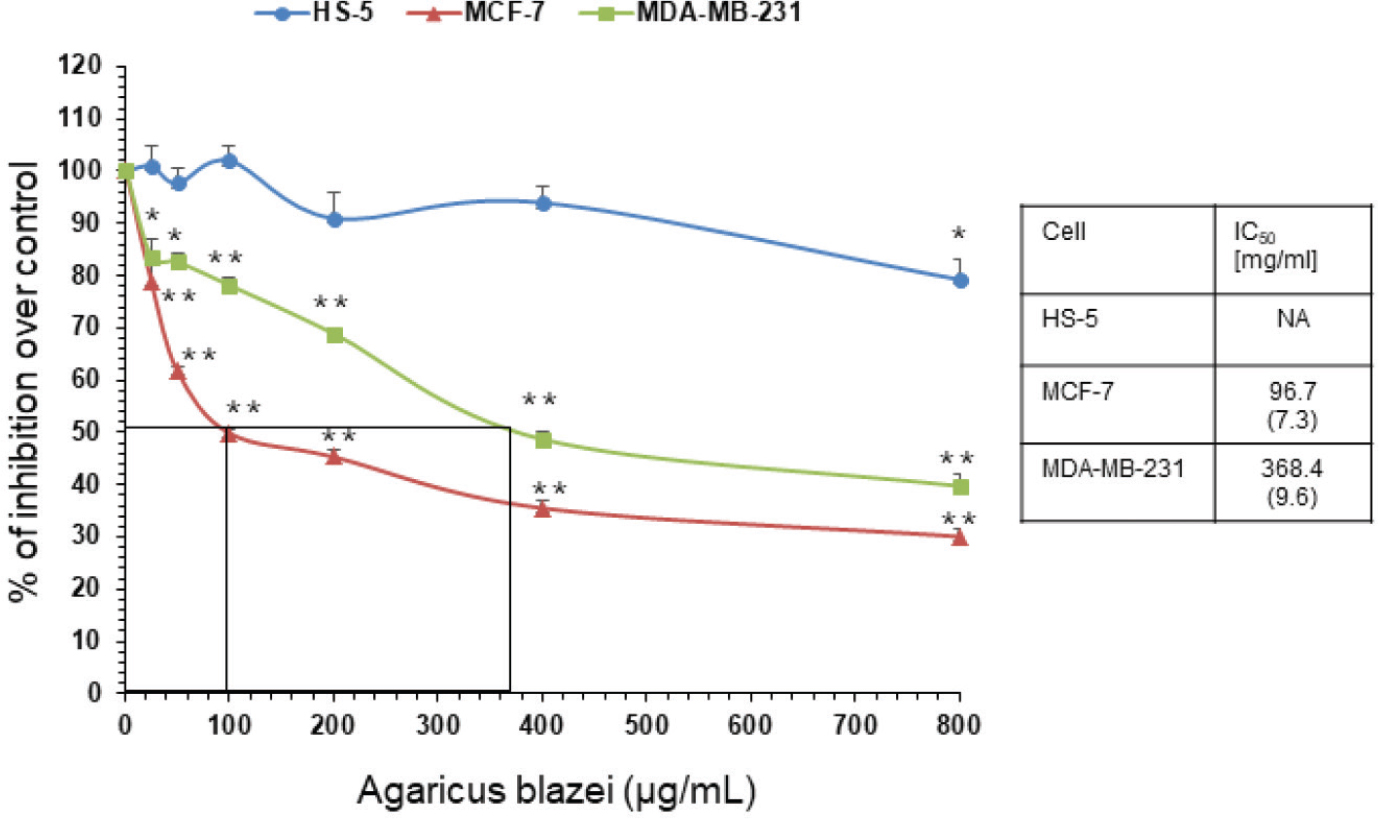
Figure 2
Evaluation of the cytotoxic effects of Agaricus blazei on HS-5, MCF-7, and MDA- MB-231 cells using MTT assay measured after 72 hours treatment. Results are shown as mean±SEM. Statistical significance was assessed using Student’s t-test. *p<0.05,**p<0.005 vs. control
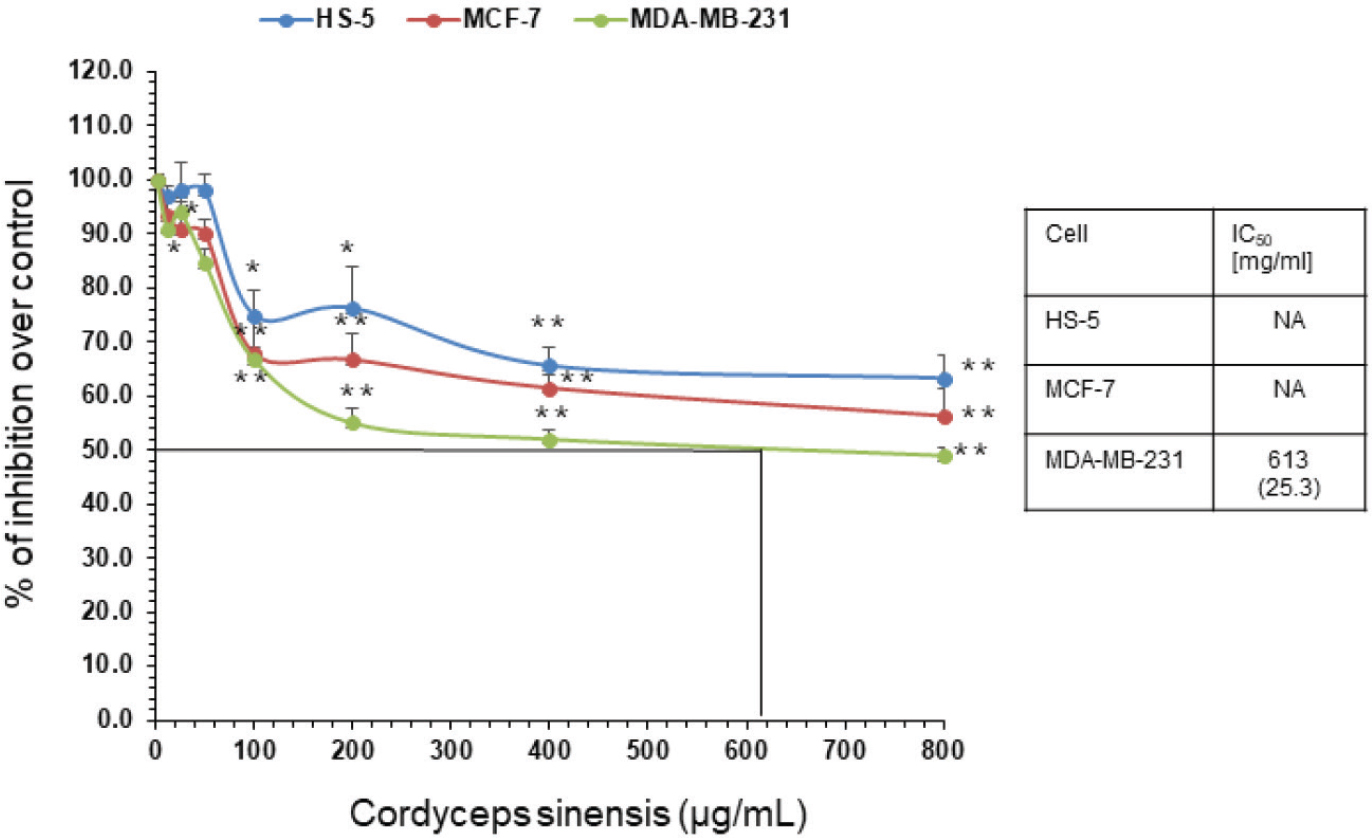
Figure 3
Evaluation of the cytotoxic effects of Cordyceps sinensis on HS-5, MCF-7, and MDA- MB-231 cell lines using MTT assay measured after 72 hours treatment. Results are shown as mean±SEM. Statistical significance was assessed using Student’s t-test. *p<0.05,**p<0.005 vs. control