
Figure 1
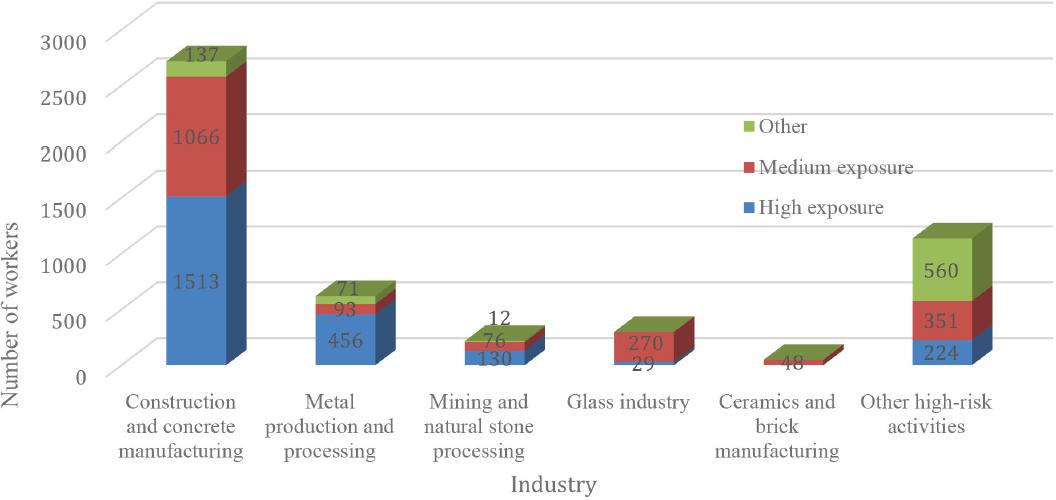
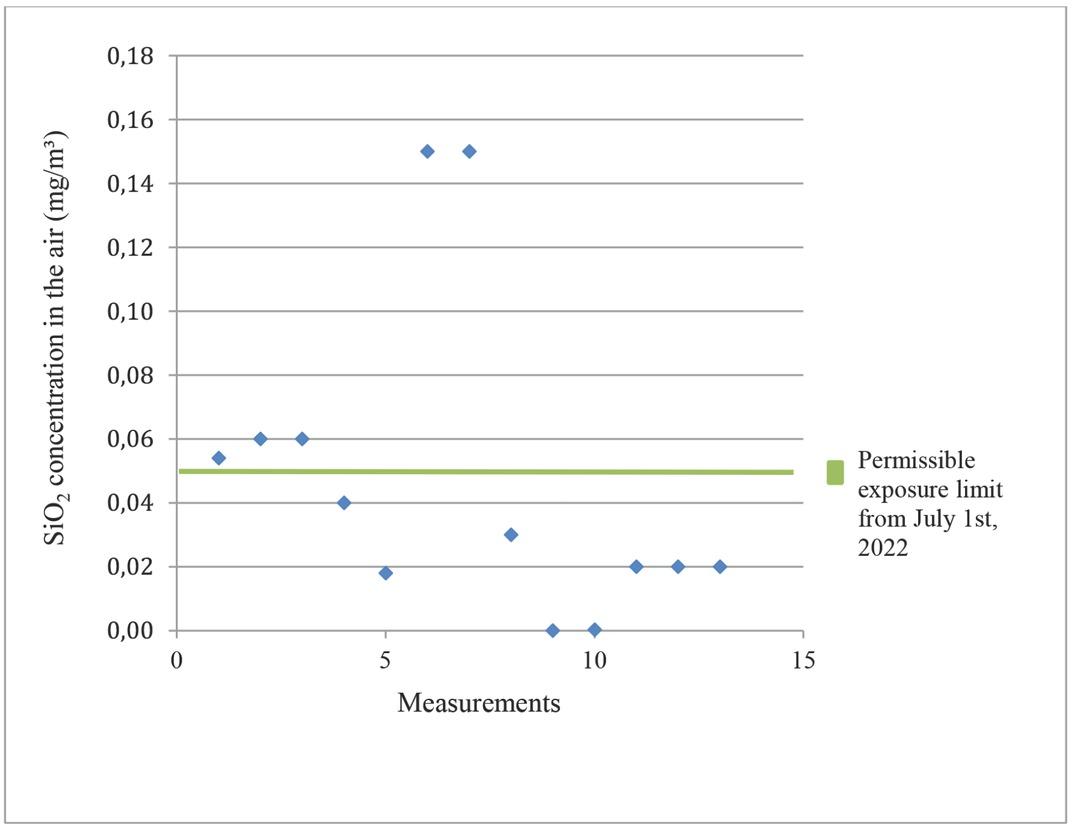
Figure 2
Number of companies and workers exposed to SiO2 by industry (self-reported estimates by company representatives vs literature-based estimates according to job description)
| Industry | Companies (N) | Workers (N) | Workers exposed as estimated by | |||
|---|---|---|---|---|---|---|
| Company representatives | Study authors based on literature data | |||||
| N % | N | % | ||||
| Construction and concrete manufacturing | 140 | 6,005 | 857 14.3 | 2,716 | 45.2 | |
| Metal production and processing | 76 | 4,749 | 172 3.6 | 620 | 13.1 | |
| Mining and natural stone processing | 12 | 530 | 72 13.6 | 218 | 41.1 | |
| Ceramics and brick manufacturing | 2 | 70 | 5 7.1 | 48 | 68.6 | |
| Glass production | 3 | 1,018 | 298 29.3 | 299 | 29.3 | |
| Other | 44 | 5,692 | 668 11.7 | 1,106 | 19.4 | |
| Total | 277 | 18,064 | 2,072 11.5 | 5,007 | 27.7 | |