
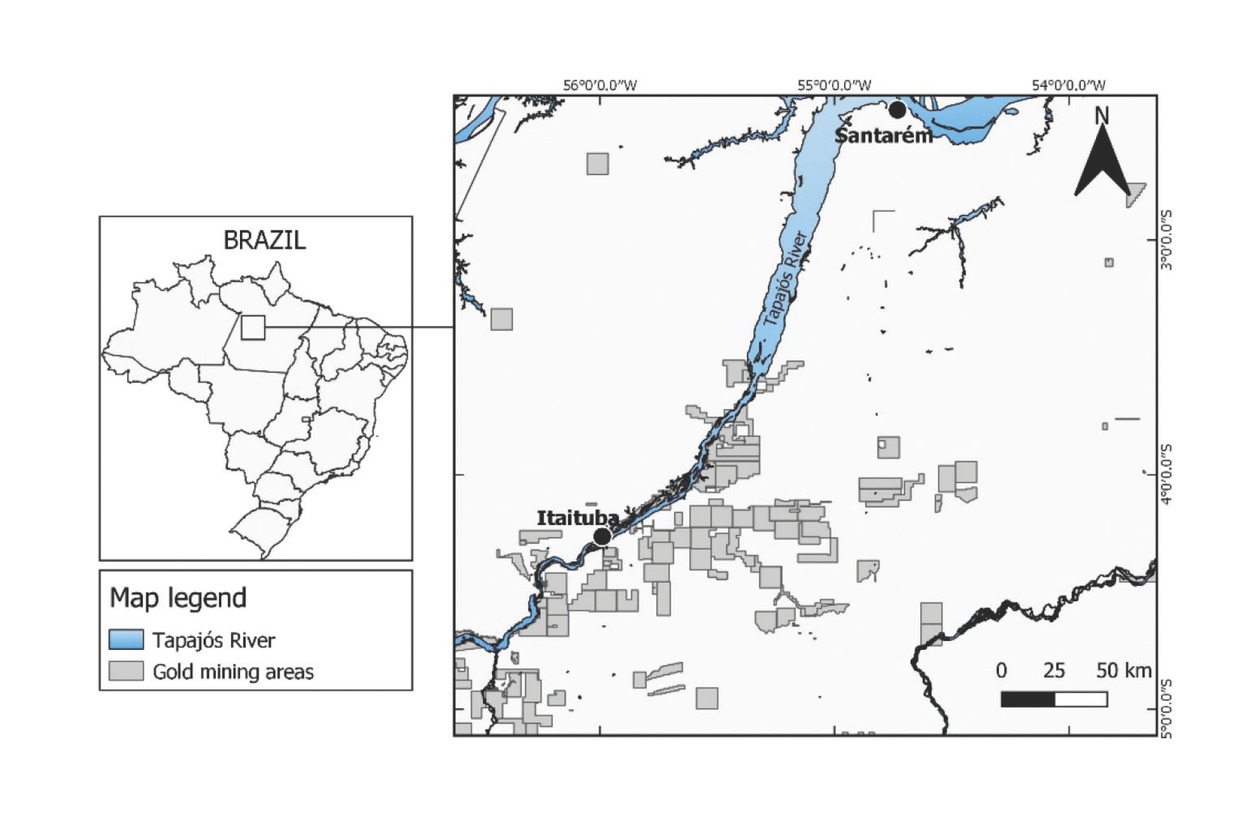
Figure 1
Geographical position of Itaituba
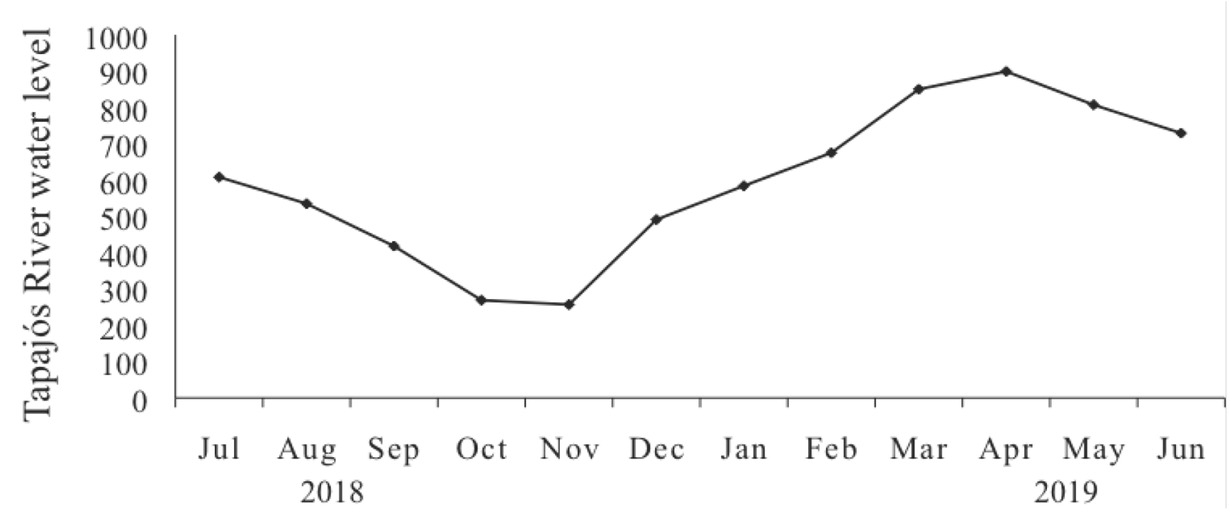
Figure 2
Variations of the Tapajós River water levels (cm) in Itaituba from July 2018 to June 2019
Table 1
Fish species consumed by pregnant women (n=110) from Itaituba, Brazil
| Fish local name (species) | Participants reporting eating listed fish (N) | % | Fish description by diet |
|---|---|---|---|
| Tambaqui (Colossoma macropomum) | 90 | 82 | Frugivore |
| Pescada branca (Plagioscion squamosissimus) | 74 | 67 | Piscivore |
| Pacú (Serrassalmidae spp.) | 60 | 54 | Frugivore |
| Tucunaré (Cichla spp.) | 49 | 44 | Piscivore |
| Aracú (Leporinus spp.) | 41 | 37 | Omnivore |
| Caratinga (Geophagus spp.) | 40 | 36 | Omnivore |
| Surubim (Pseudoplatystoma spp.) | 37 | 33 | Piscivore |
| Charutinho (Hemiodus spp.) | 33 | 30 | Omnivore |
| Dourada (Brachyplatystoma rousseauxii) | 33 | 30 | Carnivore |
| Filhote (Brachyplatystoma filamentosum) | 33 | 30 | Carnivore |
| Pirarucu (Arapaima gigas) | 30 | 27 | Piscivore |
| Curimatá (Prochilodus nigricans) | 28 | 25 | Detritivore |
| Acari (Pterygoplichthys spp.) | 22 | 20 | Detritivore |
| Matrinxã (Brycon spp.) | 22 | 20 | Omnivore |
| Aruanã (Osteoglossum bicirrhosum) | 21 | 19 | Carnivore |
| Pirarara (Phractocephalus hemioliopterus) | 21 | 19 | Omnivore |
| Apapá (Pellona spp.) | 18 | 16 | Carnivore |
| Piau (Anostomidae spp.) | 16 | 14 | Detritivore |
| Pirapitinga (Piaractus brachypomus) | 16 | 14 | Frugivore |
| Jaraqui (Semaprochilodus spp.) | 2 | 2 | Detritivore |
| Mapará (Hypophthalmus spp.) | 2 | 2 | Planktivore |
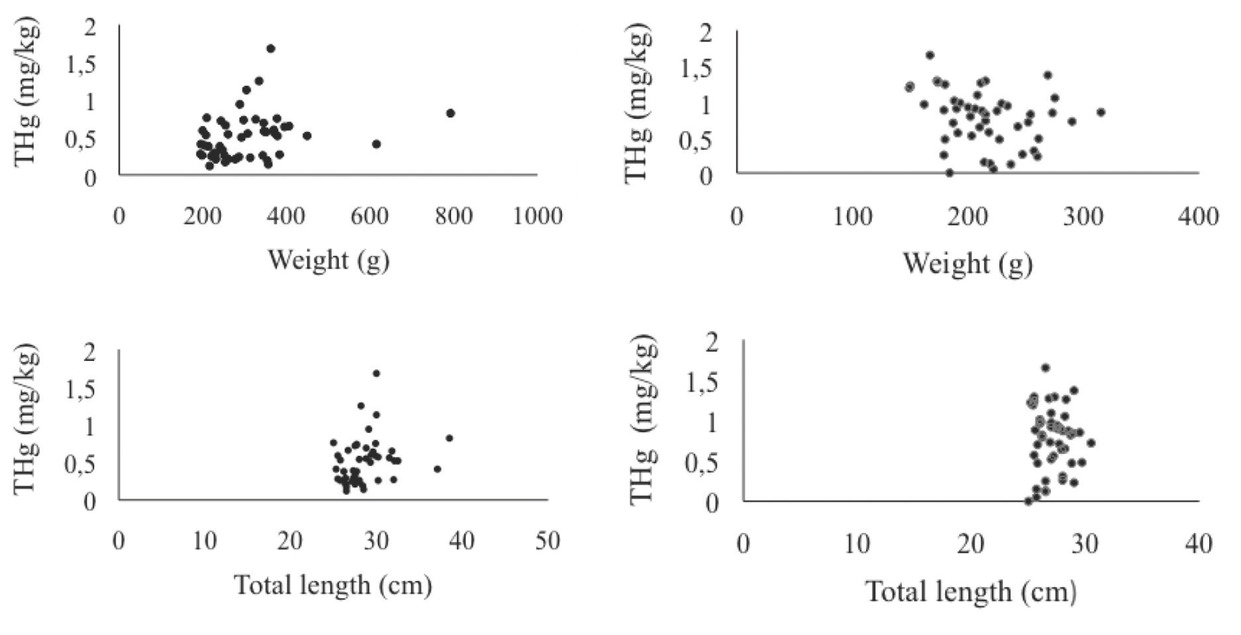
Figure 3
Relationship between mercury concentration and weight and total length of fish caught and consumed in Itaituba. Left columns: Cichla spp. (tucunaré; n=48); right columns: P. squamosissimus (pescada; n=48)
Table 2
Biometric parameters in two predator fish species from the Tapajós River basin, Amazon, Brazil
| Biometric parameters | Dry season | Rainy season | |||
|---|---|---|---|---|---|
| Mean ± SD | Min–Max | Mean ± SD | Min–Max | ||
| Plagioscion squamosissimus | Weight (g) | 224±40 | 150–315 | 207±32 | 149–261 |
| Total length (cm) | 27.2±0.5 | 25.0–30.5 | 27.1±1.2 | 25.4–29.7 | |
| Standard length (cm) | 22.4±1.4 | 20.1–24.8 | 22.4±1.2 | 20.7–25.4 | |
| Cichla spp. | Weight (g) | 344±129 | 195–792 | 271±69 | 194–406 |
| Total length (cm) | 29.4±3.1 | 25.0–38.5 | 27.8±2.0 | 25.5–32.1 | |
| Standard length (cm) | 24.5±2.8 | 20.7–32 | 23.2±1.7 | 21.0–27.3 | |
Table 3
Total mercury concentrations (mg/kg) in Cichla spp. (tucunaré) and P. squamosissimus (pescada) fish caught in the Tapajós River basin, Brazil
| Dry season (July – December 2018) | Rainy season (January – June 2019) | |||
|---|---|---|---|---|
| Cichla spp. (n=26) | P. squamosissimus (n=24) | Cichla spp. (n=24) | P. squamosissimus (n=24) | |
| Mean ± SD | 0.62±0.35 | 0.73±0.37 | 0.39±0.21* | 0.54±0.37 |
| Min–max | 0.17–1.68 | 0.05–1.37 | 0.12–0.94 | 0.25–1.65 |
| Median | 0.59 | 0.83 | 0.29 | 0.89 |
| 25th quartile | 0.39 | 0.55 | 0.24 | 0.55 |
| 75th quartile | 0.75 | 0.92 | 0.54 | 1.12 |
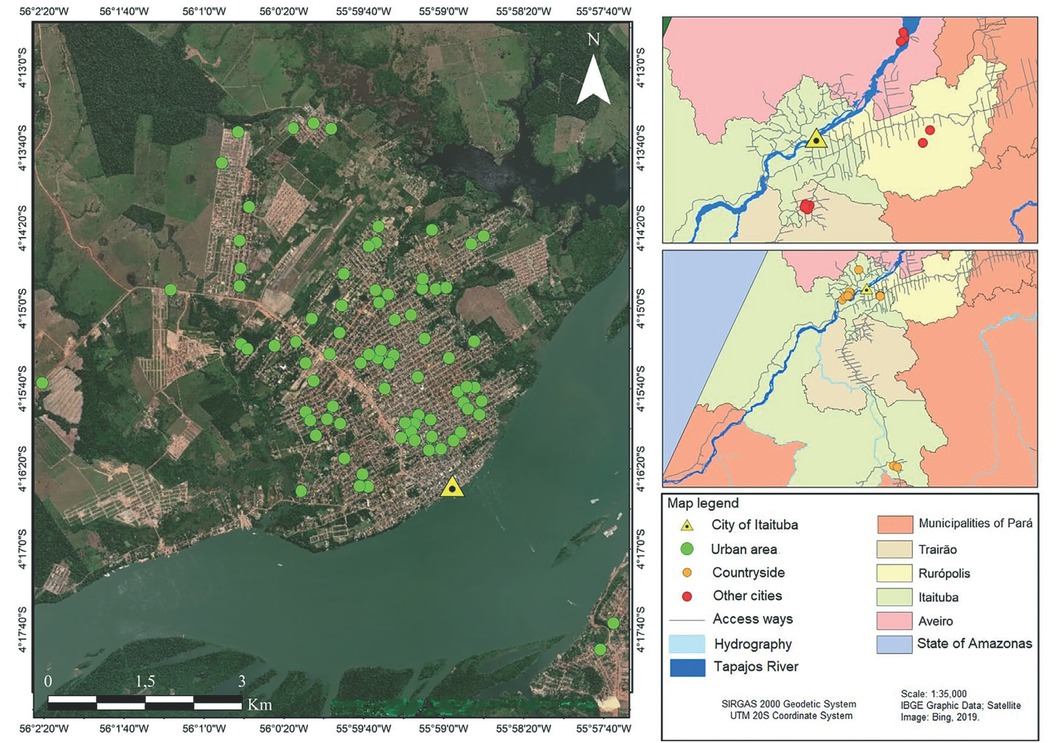
Figure 4
Distribution of participants by residence in and around Itaituba along the Tapajós River (Amazon, Brazil). The left panel shows residences as green dots. The lower part of the right panel shows the legend, translated as follows: Itaituba (Cidade de Itaituba); Urban area (Área urbana); Rural zone (Zona rural); Other cities (Outras cidades); Access roads (Vias deacesso) ; Water (Hidrographia); the Tapajós River (Rio Tapajós) ; Pará Municipalities (Municipios do Pará); State of Amazonas (Estado do Amazonas)
Table 4
Relationship between socio-demographic characteristics of participating pregnant women from Itaituba and hair THg concentrations (mg/kg)
| n | % | Hair THg (mean ± SD) | ||
|---|---|---|---|---|
| Age | 18–20 | 40 | 36.4 | 2.3±3.5 |
| 21–30 | 57 | 51.8 | 1.6±1.4 | |
| 31–40 | 13 | 11.8 | 1.5±2.3 | |
| Schooling | Elementary school | 54 | 49.2 | 2.1±2.3 |
| High school | 38 | 34.5 | 1.7±2.1 | |
| Academic education | 18 | 16.3 | 1.5±2.3 | |
| Marital status | Married or living as married | 85 | 77.2 | 1.5±1.7 |
| Single | 25 | 22.8 | 2.5±4.3 | |
| Race | White | 2 | 1.8 | 0.6±0.01 |
| Black | 7 | 6.3 | 3.9±6.3 | |
| Mixed race | 101 | 91.9 | 1.7±1.9 | |
| Occupation | Housewife | 90 | 81.9 | 1.8±2.0 |
| Student | 7 | 6.3 | 3.6±6.4 | |
| Other occupation | 13 | 11.8 | 1.3±1.5 |
Table 5
Relationship between body mass index (BMI) of participating pregnant women from Itaituba and hair THg concentration (mg/kg)
| BMI | Weight status | n | Hair THg (mean ± SD) |
|---|---|---|---|
| 18.5–24.9 | normal | 33 | 1.9±2.8 |
| 25.0–29.9 | overweight | 49 | 1.8±2.7 |
| 30.0–39.9 | obese | 24 | 1.8±1.4 |
| ≥40.0 | severe obesity | 4 | 1.4±0.6 |
Table 6
Relationship between blood pressure in participating pregnant women from Itaituba and hair THg concentration (μg/g)
| Blood pressure (mmHg, mean ± SD)a | n | Fish intake (g/week) | Hair THg (mg/kg, mean ± SD) | |
|---|---|---|---|---|
| Systolic | Diastolic | |||
| 101±7 | 65±6 | 40 | 0–100 | 1.1±0.9 |
| 103±8 | 68±8 | 26 | 101–200 | 1.7±1.3 |
| 101±10 | 67±5 | 23 | 201–400 | 1.6±1.3 |
| 103±12 | 69±10 | 21 | 401–800 | 2.43±2.2 |
Table 7
Hair THg levels in participating pregnant women from Itaituba and distribution of increased health risks from Hg exposure by fish consumption
| Fish consumption (g/week) | Hair THg (mg/kg, mean ± SD) | Risk rate based on US EPA RfD a | Risk rate based on LOAEHC b |
|---|---|---|---|
| 0–100 (n=37) | 1.1±0.9 | 0.7 (33 %) | 2.3 (83 %) |
| 101–200 (n=25) | 1.7±1.3 | 1.7 (58 %) | 5.7 (87 %) |
| 201–400 (n=24) | 1.6±1.3 | 1.1 (54 %) | 3.8 (100 %) |
| > 400 (n=22) | 2.4±2.2* | 1.2 (57 %) | 3.9 (100 %) |
[i] * Significant difference (p<0.05) from the group of women consuming 0–100 g of fish a week. a reference dose of 1.0 mg/kg (49). b lowest observable adverse effect hair concentration of 0.3 mg/kg, (50). Both risk rates are given as medians of distribution. Percentage in parentheses refers to women above these safety limits (raw data and calculations are available from the authors upon request)