
Figure 1

Figure 2
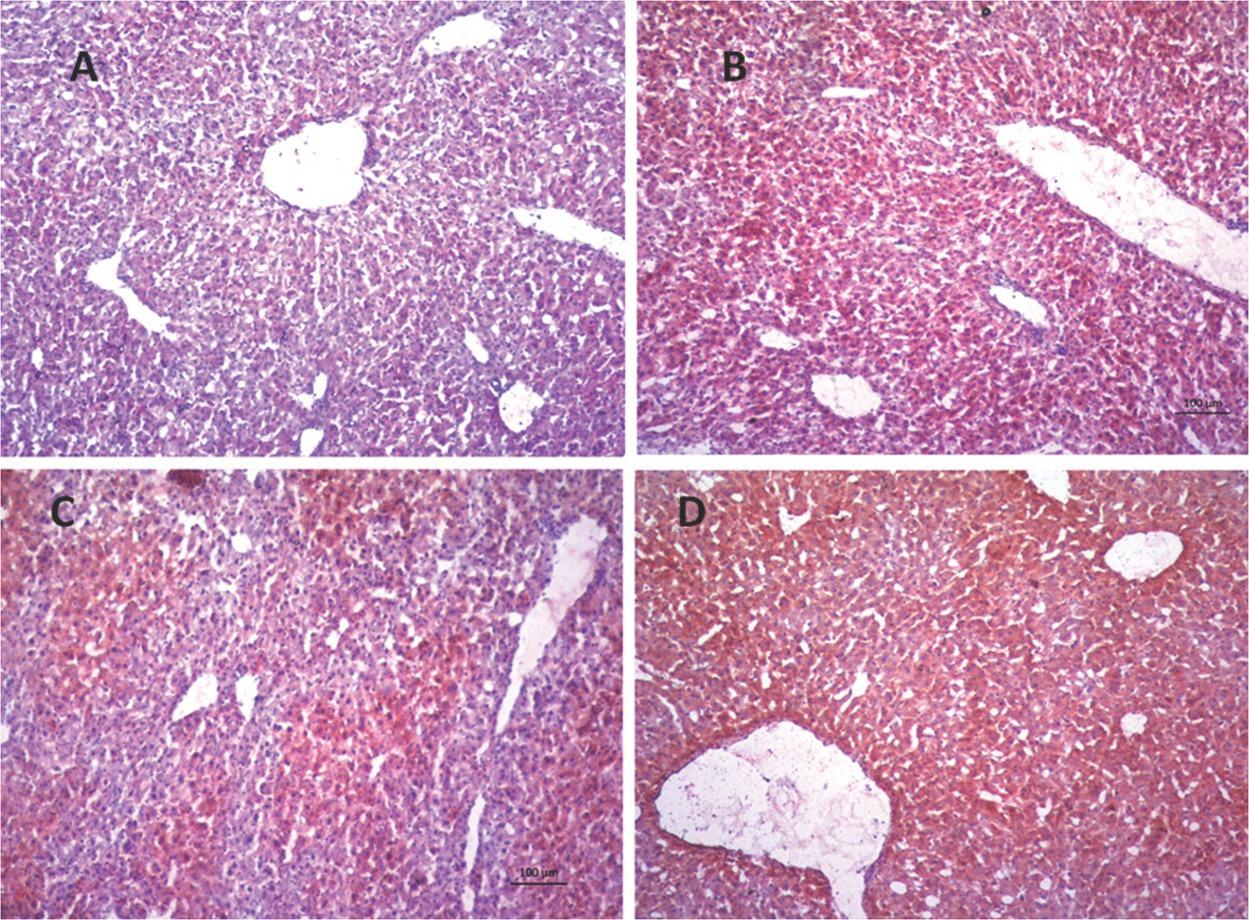
Figure 3
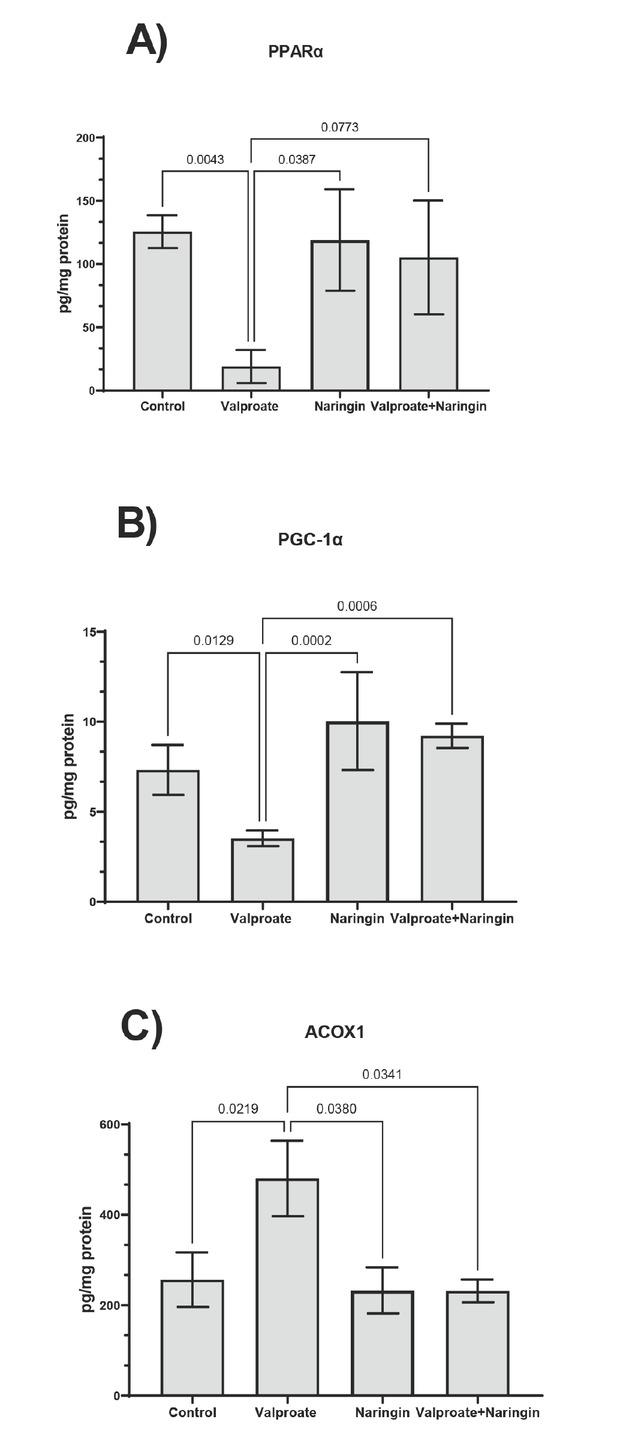
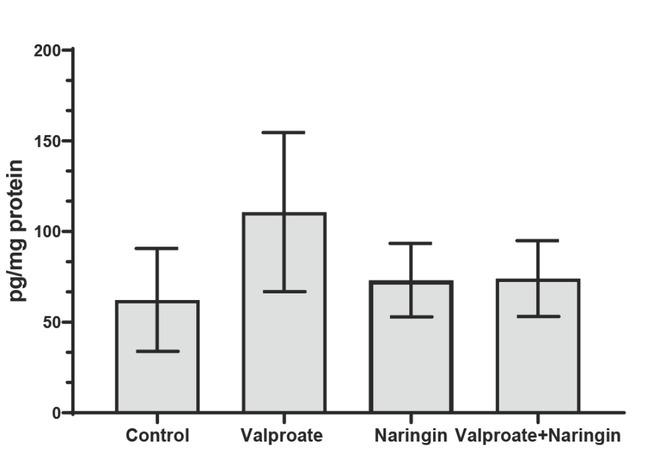
Figure 4

Figure 5
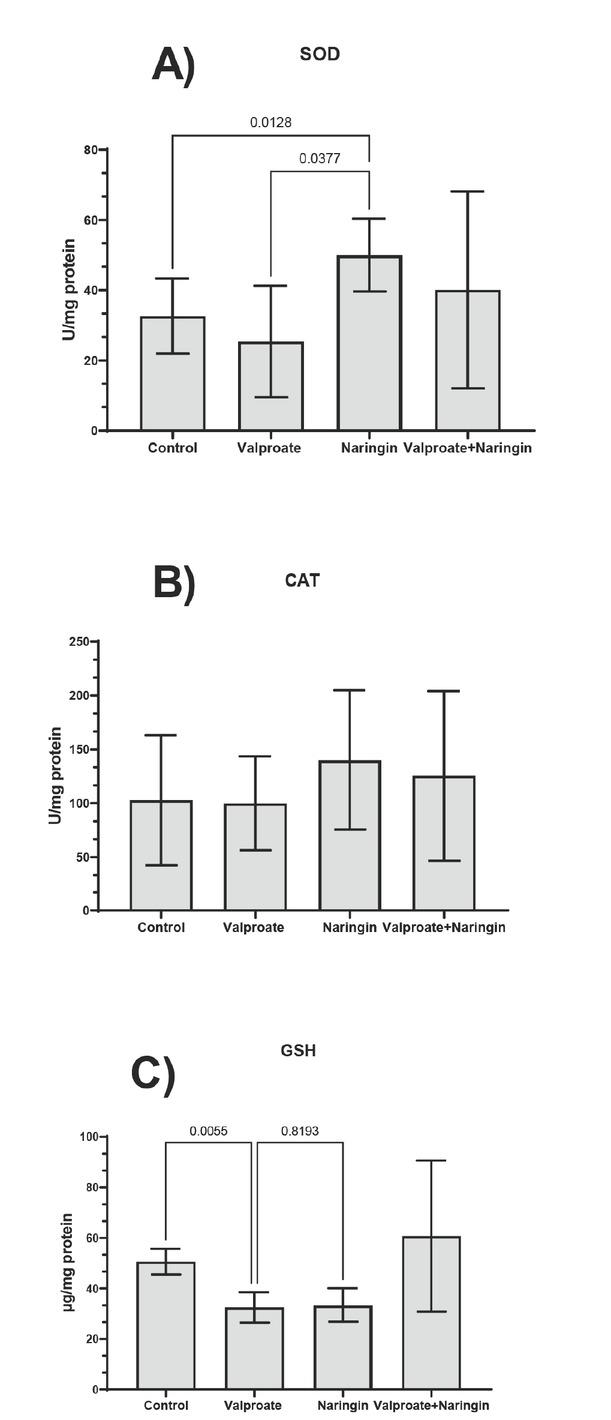
Figure 6
Serum biochemistry parameters in control mice and mice treated with daily doses of 150 mg/kg bw valproate, 25 mg/kg bw naringin, and their combination for 10 days
| Parameter | Control | Valproate | Naringin | Valproate+Naringin |
|---|---|---|---|---|
| Glucose (mmol/L) | ||||
| Mean ± SD | 5.9±0.9 | 12.7±1.4a | 14.0±4.2a,b | 17.8±1.5b |
| Median | 5.8 | 12.6 | 13.4 | 16.3 |
| Range | 5.0–7.2 | 11.5–14.3 | 9.8–19.3 | 9.8–19.9 |
| Amylase activity (U/L) | ||||
| Mean ± SD | 365.3±110.6 | 555.0±520.4a | 371.8±23.8 | 455.8±102.4b |
| Median | 331.0 | 355.0 | 373.5 | 459.0 |
| Range | 273.0–526.0 | 184.0–1326.0 | 342.0–398.0 | 356.0–549.0 |
| Lactate dehydrogenase (LDH) activity (U/L) | ||||
| Mean ± SD | 264.8±29.2 | 316.4±40.3a | 382.0±97.8a | 498.5±324.2a |
| Median | 257.0 | 331.0 | 392.0 | 531.5 |
| Range | 240.0–305.0 | 250.0–348.0 | 263.0–518.0 | 122.0–809.0 |
| Creatinine (mg/L) | ||||
| Mean ± SD | 22.8±3.3 | 31.3±7.8a | 27.5±10.5 | 42.8±3.6b |
| Median | 22.5 | 29.0 | 25.0 | 43.0 |
| Range | 19.0–27.0 | 25.0–42.0 | 18.0–42.0 | 24.0–56.0 |
| Bound urea nitrogen (BUN) (mmol/L) | ||||
| Mean ± SD | 6.0±1.3 | 10.2±7.6a | 6.9±1.1 | 10.0±3.4a |
| Median | 5.7 | 8.5 | 7.0 | 8.5 |
| Range | 4.8–7.7 | 3.0–21.0 | 5.4–8.0 | 7.9–15.0 |
| Bilirubin (μmol/L) | ||||
| Mean ± SD | 5.3±0.2 | 5.6±0.4 | 5.1±0.2 | 5.1±0.2 |
| Median | 5.3 | 5.8 | 5.0 | 5.1 |
| Range | 5.0–5.5 | 5.1–5.9 | 5.0–5.4 | 5.0–5.4 |
| Alkaline phosphatase (ALP) activity (U/L) | ||||
| Mean ± SD | 46.3±6.3 | 44.5±3.1 | 32.0±14.1 | 42.0±2.2 |
| Median | 47.3 | 45.5 | 38.5 | 41.5 |
| Range | 40.0–55.0 | 40.0–47.0 | 11.0–40.0 | 40.0–45.0 |
| Total proteins (mg/L) | ||||
| Mean ± SD | 37.3±5.0 | 34.5±10.2 | 40.5±5.9 | 38.1±0.9 |
| Median | 37.5 | 37.5 | 40.0 | 38.0 |
| Range | 32.0–42.0 | 20.0–43.0 | 37.0–49.0 | 37.0–39.0 |
| Albumin (mg/L) | ||||
| Mean ± SD | 27.0±2.4 | 34.3±6.5 | 36.0±5.0 | 31.0±0.8 |
| Median | 26.5 | 36.0 | 36.0 | 30.0 |
| Range | 25.0–30.0 | 25.0–40.0 | 30.0–42.0 | 29.0–33.0 |