
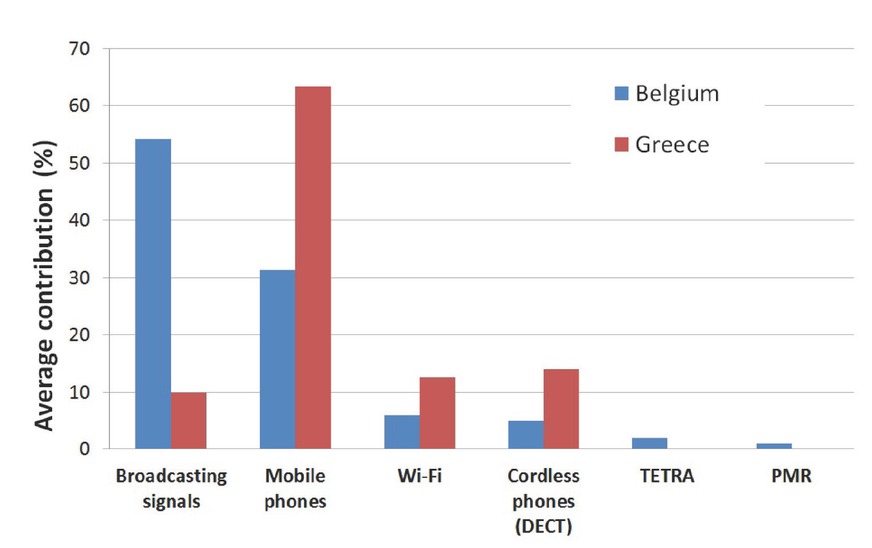
Figure 1
Average contribution (%) of various RF signals measured as electric field strength (V/m) in Belgian and Greek schools (7)
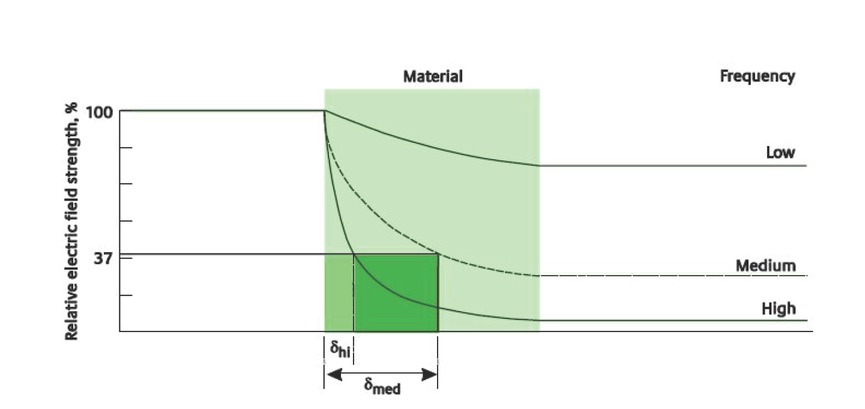
Figure 2
How EM RF energy is absorbed by biological materials, i.e. how skin depth decreases with higher frequency. Reflection of the incident radiation is assumed negligible at each interface in this diagram. Skin depth at high frequency, δhi, is less than that at medium frequency, δmed. (14, 16)
Table 1
Conductivity and skin depth of low and high water content tissues at selected EM RF
| Frequency | Tissues with low water content | Tissues with high water content | ||||||
|---|---|---|---|---|---|---|---|---|
| Fat | Bone | Muscle | Skin | |||||
| σ (S/m) | δ (mm) | σ (S/m) | δ (mm) | σ (S/m) | δ (mm) | σ (S/m) δ | (mm) | |
| 150 MHz | 0.04 | 366.1 | 0.07 | 301.0 | 0.7 | 67.2 | 0.5 | 85.0 |
| 450MHz | 0.04 | 301.9 | 0.10 | 202.2 | 0.8 | 51.3 | 0.7 | 52.9 |
| 835 MHz | 0.05 | 252.0 | 0.14 | 139.5 | 0.9 | 43.5 | 0.8 | 41.5 |
| 1.8 GHz | 0.08 | 157.1 | 0.28 | 66.7 | 1.3 | 29.2 | 1.2 | 28.3 |
| 2.54 GHz | 0.10 | 117.1 | 0.39 | 45.8 | 1.7 | 22.3 | 1.5 | 22.6 |
| 3 GHz | 0,13 | 93.6 | 0.51 | 35.2 | 2.1 | 18.0 | 1.7 | 18.9 |
| 5 GHz | 0.24 | 49.4 | 0.96 | 17.7 | 4.0 | 9.3 | 3.1 | 10.5 |
| 10 GHz | 0.58 | 19.6 | 2.13 | 7.3 | 10.6 | 3.3 | 8.0 | 3.8 |
Table 2
Basic restrictions for time-varying electric and magnetic fields for frequencies 10 MHz–10 GHz according to the International Commission on Non-Ionizing Radiation Protection (24)
| Whole-body average SAR (W/kg) | Localised SAR (W/kg) | ||
|---|---|---|---|
| Head and trunk | Limbs | ||
| Occupational exposure | 0.4 | 10 | 20 |
| General public exposure | 0.08 | 2 | 4 |
Table 3
Examples of Wi-Fi exposure in school indoor/classroom environment
| Reference | Country / Sample | Source / Distance from source (m) (Number of measurements) | Electric field strength (V m-1) | Power density (W m-2) | SAR (W/kg) localised (head and trunk) |
|---|---|---|---|---|---|
| Khalid et al. 2011 (55) | United Kingdom / 3 | access points*/ 0.5 | 5.7b | - | |
| Peyman et al. 2011 (19) | primary, 3 secondary schools | laptops / 0.5 | 2.9b | - | 0.00008c |
| Joseph et al. 2010 (56) | Hungary school teacher/ 31 primary d | Wi-Fi devices* | 2-5 | - | - |
| Vermeeren et al. 2013 (7) | Greece / 5 schools | various Wi-Fi devices*# | 0.09a, 0.20b | - | - |
| Verloock et al. 2014 (111) | Belgium and secondary / 5 primary schools | various access Wi-points Fi clients*# | 0.34a, 2.52b | - | - |
| Gledhill 2014 (59) | New Zealand / 2 schools | access points# / 2 laptops / <0.5 | - | 0.0025a, 0.02b 0.002a, 0.03b | - |
| Karipidis et al. 2017 (54) | Australia 16 secondary / 7 primary schools | access points*# / 1.9 | - | 0.0004a, 0.04b | - |
| Prlić et al. 2021 (10) & Croatia /151 primary Yet unpublished data & secondary schools | access points*# /across the whole classroom (grid 1m x 1m) | < 0.66b | - | 0.0088 #f0.029*f | |
| Relevant ICNIRP reference levels$ | 61 | 10 | 2 | ||
[i] SAR - specific energy absorption rate. * 2.4–2.5 GHz; #5.15–5.85 GHz; a average value; b maximum value; c peak localised SAR in the torso region in a 10-year-old child model at 34 cm from the antenna; d personal dosimetry; f localised averaged value for any 10 g of tissue (based on simulation for total tissue mass of 125.39 kg); $ reference levels for general public exposure to time-varying electric and magnetic fields: electric field strength and equivalent plane wave power density refer to the 2–300 GHz frequency range, while SAR values refer to the 10 MHz–10 GHz frequency range