
Figure 1
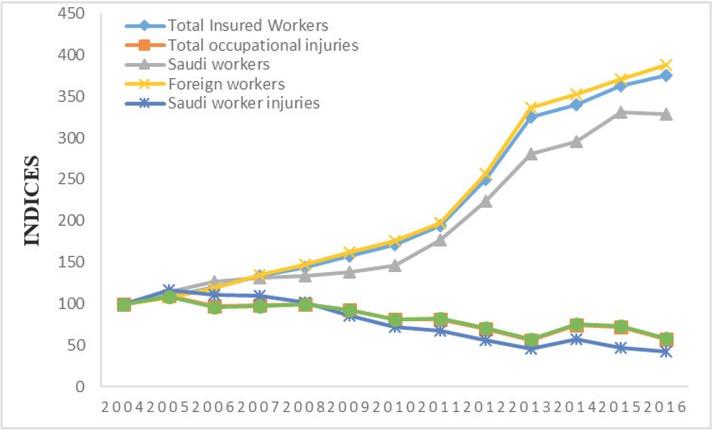
Figure 2

Figure 3
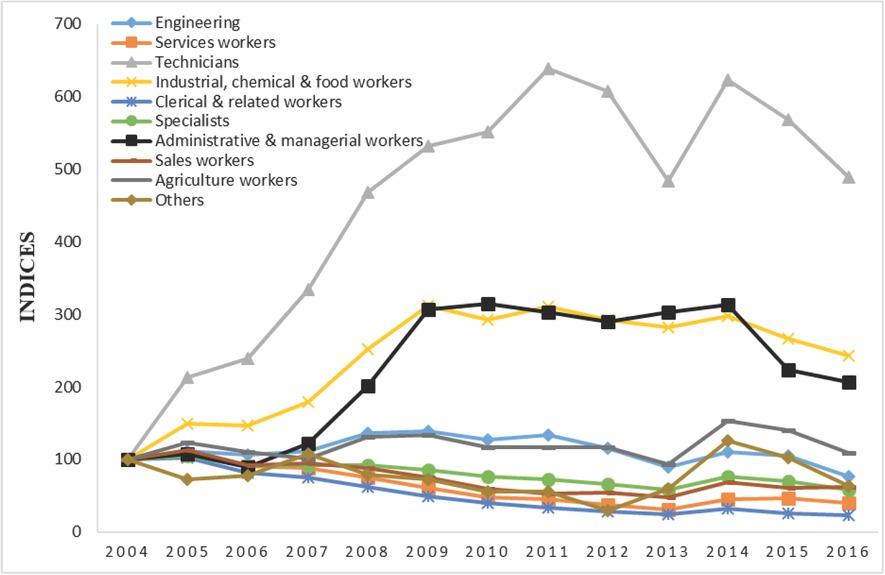
Figure 4
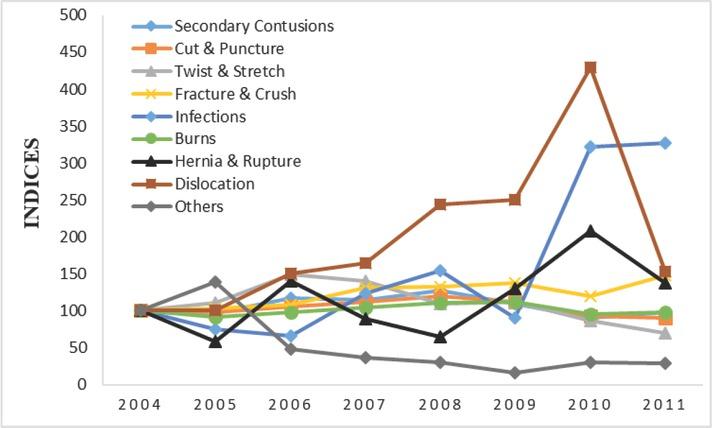
Figure 5

Figure 6

Figure 7

Figure 8

Distribution of occupational injuries by injured body parts in Saudi Arabia between 2004 and 2011, expressed in percentages
| Injured body parts | 2004 | 2005 | 2006 | 2007 | 2008 | 2009 | 2010 | 2011 | Slope |
|---|---|---|---|---|---|---|---|---|---|
| Upper limbs | 15.5 | 15.6 | 25.3 | 25.8 | 26.3 | 26.7 | 21.9 | 23.0 | 1.1 |
| Lower limbs | 20.2 | 20.8 | 18.6 | 19.8 | 19.9 | 20.1 | 16.0 | 30.5 | 0.6 |
| Head | 12.0 | 12.6 | 14.8 | 16.2 | 15.9 | 15.9 | 12.3 | 15.8 | 0.3 |
| Trunk | 10.9 | 11.3 | 14.5 | 14.9 | 14.5 | 12.8 | 9.8 | 13.4 | 0.1 |
| Non-classifiable | 37.0 | 35.9 | 22.4 | 17.8 | 18.0 | 19.9 | 35.6 | 9.6 | -2.4 |
| Multiple parts | 3.7 | 3.2 | 3.6 | 4.7 | 4.4 | 4.0 | 3.6 | 6.7 | 0.3 |
| Body systems | 0.3 | 0.3 | 0.3 | 0.3 | 0.6 | 0.3 | 0.4 | 0.5 | 0.0 |
| Neck | 0.4 | 0.4 | 0.5 | 0.5 | 0.4 | 0.4 | 0.3 | 0.4 | 0.0 |
| Total | 100.0 | 100.0 | 100.0 | 100.0 | 100.0 | 100.0 | 100.0 | 100.0 |
The distribution of establishments, insured workers, occupational deaths, and injuries in Saudi Arabia between 2004 and 2016
| Year | TE | TIW | SW | FW | TOI | OISW | OIFW | TOD |
|---|---|---|---|---|---|---|---|---|
| 2004 | 105462 | 2793757 | 571806 | 2221951 | 93521 | 6470 | 87051 | 320 |
| 2005 | 121554 | 3040134 | 654530 | 2385604 | 102259 | 7543 | 94716 | 493 |
| 2006 | 138002 | 3359566 | 723388 | 2636178 | 90853 | 7156 | 83697 | 437 |
| 2007 | 163764 | 3749575 | 753890 | 2995685 | 91822 | 7129 | 84693 | 506 |
| 2008 | 192685 | 4031146 | 765224 | 3265922 | 93285 | 6548 | 86737 | 646 |
| 2009 | 218363 | 4390447 | 790332 | 3600115 | 86211 | 5579 | 80632 | 587 |
| 2010 | 242561 | 4744134 | 838291 | 3905843 | 75487 | 4641 | 70846 | 507 |
| 2011 | 274034 | 5397485 | 1014889 | 4382596 | 75825 | 4357 | 71468 | 557 |
| 2012 | 335773 | 6985687 | 1279952 | 5705735 | 65656 | 3659 | 61997 | 351 |
| 2013 | 419485 | 9089891 | 1608238 | 7481653 | 52467 | 3005 | 49462 | 285 |
| 2014 | 396512 | 9386250 | 1565453 | 7820797 | 69241 | 3732 | 65509 | 856 |
| 2015 | 420941 | 10122477 | 1892812 | 8229665 | 67087 | 3082 | 64005 | 495 |
| 2016 | 453389 | 10489211 | 1875967 | 8613244 | 53404 | 2766 | 50638 | 522 |
Annual distribution of occupational injuries, workers and number of injuries per workers (injury-to-worker ratio) by occupations in Saudi Arabia
| Number of occupational injuries | |||||||||||||
|---|---|---|---|---|---|---|---|---|---|---|---|---|---|
| Occupations | 2004 | 2005 | 2006 | 2007 | 2008 | 2009 | 2010 | 2011 | 2012 | 2013 | 2014 | 2015 | 2016 |
| N(%) | N(%) | N(%) | N(%) | N(%) | N(%) | N(%) | N(%) | N(%) | N(%) | N(%) | N(%) | N(%) | |
| 30615 | 34131 | 32421 | 34281 | 41566 | 42306 | 39106 | 40726 | 35214 | 27271 | 33726 | 31938 | 23234 | |
| Engineering | (32.7) | (33.4) | (35.7) | (37.3) | (44.6) | (49.1) | (51.8) | (53.7) | (53.6) | (52.0) | (48.7) | (47.6) | (43.5) |
| Services workers | 56627 | 60417 | 51369 | 49569 | 42453 | 34118 | 27102 | 25257 | 21220 | 17229 | 25491 | 26224 | 22388 |
| (60.6) | (59.1) | (56.5) | (54.0) | (45.5) | (39.6) | (35.9) | (33.3) | (32.3) | (32.8) | (36.8) | (39.1) | (41.9) | |
| Technicians | 776 | 1653 | 1854 | 2594 | 3636 | 4131 | 4279 | 4955 | 4710 | 3753 | 4833 | 4412 | 3794 |
| (0.8) | (1.6) | (2.0) | (2.8) | (3.9) | (4.8) | (5.7) | (6.5) | (7.2) | (7.2) | (7.0) | (6.6) | (7.1) | |
| 669 | 1000 | 978 | 1199 | 1682 | 2087 | 1958 | 2077 | 1960 | 1886 | 1989 | 1779 | 1625 | |
| Industrial, chemical & food workers | (0.7) | (1.0) | (1.1) | (1.3) | (1.8) | (2.4) | (2.6) | (2.7) | (3.0) | (3.6) | (2.9) | (2.7) | (3.0) |
| 2185 | 2234 | 1787 | 1635 | 1361 | 1061 | 877 | 721 | 617 | 535 | 686 | 555 | 496 | |
| Clerical & related workers | (2.3) | (2.2) | (2.0) | (1.8) | (1.5) | (1.2) | (1.2) | (1.0) | (0.9) | (1.0) | (1.0) | (0.8) | (0.9) |
| Specialists | 1282 | 1343 | 1169 | 1176 | 1175 | 1092 | 978 | 934 | 842 | 739 | 985 | 891 | 749 |
| (1.4) | (1.3) | (1.3) | (1.3) | (1.3) | (1.3) | (1.3) | (1.2) | (1.3) | (1.4) | (1.4) | (1.3) | (1.4) | |
| 110033 | 111111 | 9922 | 112255 | 220077 | 331166 | 332244 | 331122 | 229988 | 331122 | 332233 | 223300 | 221133 | |
| Administrative & managerial workers | (0.1) | (0.1) | (0.1) | (0.1) | (0.2) | (0.4) | (0.4) | (0.4) | (0.5) | (0.6) | (0.5) | (0.3) | (0.4) |
| Sales workers | 793 | 897 | 732 | 751 | 698 | 599 | 469 | 421 | 428 | 374 | 544 | 477 | 490 |
| (0.8) | (0.9) | (0.8) | (0.8) | (0.7) | (0.7) | (0.6) | (0.6) | (0.7) | (0.7) | (0.8) | (0.7) | (0.9) | |
| Agriculture workers | 261 | 322 | 289 | 265 | 342 | 350 | 305 | 306 | 305 | 244 | 399 | 365 | 283 |
| (0.3) | (0.3) | (0.3) | (0.3) | (0.4) | (0.4) | (0.4) | (0.4) | (0.5) | (0.5) | (0.6) | (0.5) | (0.5) | |
| 210 | 151 | 162 | 227 | 165 | 151 | 89 | 116 | 62 | 124 | 265 | 216 | 132 | |
| Others | (0.2) | (0.1) | (0.2) | (0.2) | (0.2) | (0.2) | (0.1) | (0.2) | (0.1) | (0.2) | (0.4) | (0.3) | (0.2) |
Distribution of occupational injuries by cause in Saudi Arabia between 2004 and 2016, expressed in percentages
| Causes | 2004 | 2005 | 2006 | 2007 | 2008 | 2009 | 2010 | 2011 | 2012 | 2013 | 2014 | 2015 | 2016 | Slope |
|---|---|---|---|---|---|---|---|---|---|---|---|---|---|---|
| Caught in | 1.6 | 1.3 | 1.3 | 1.4 | 1.1 | 1.1 | 0.8 | 1.1 | 1.1 | 1.4 | 1.4 | 1.5 | 1.7 | 0.0 |
| Struck by or against | 38.8 | 39.5 | 38.8 | 40.2 | 44.2 | 41.9 | 36.9 | 28.0 | 31.9 | 28.9 | 27.4 | 28.9 | 26.9 | -1.3 |
| Rubbed or abraded/ Friction | 20.4 | 19.2 | 18.9 | 16.3 | 15.9 | 15.7 | 15.1 | 10.6 | 13.2 | 16.4 | 15.9 | 17.0 | 18.2 | -0.3 |
| Fall form high level/ Fall from same level | 19.7 | 19.3 | 19.8 | 21.0 | 20.5 | 22.6 | 26.2 | 25.8 | 26.5 | 28.0 | 28.7 | 28.7 | 27.1 | 0.9 |
| Vehicle accidents | 5.1 | 5.7 | 5.3 | 5.8 | 4.8 | 4.0 | 3.0 | 3.6 | 3.5 | 3.8 | 6.0 | 4.7 | 6.6 | 0.0 |
| Body reaction | 14.1 | 14.7 | 15.4 | 14.8 | 13.3 | 11.2 | 2.7 | 4.7 | 5.3 | 5.7 | 5.3 | 5.4 | 5.1 | -1.0 |
| Stress | - | - | - | - | - | - | 5.8 | 2.7 | 2.2 | 1.6 | 1.6 | 1.4 | 1.5 | -0.6 |
| Contact with cold or heat | - | - | - | - | - | - | 1.2 | 1.7 | 2.1 | 1.9 | 2.0 | 1.8 | 1.8 | 0.1 |
| Contact with radiation or caustics | - | - | - | - | - | - | 1.0 | 0.8 | 0.9 | 0.8 | 0.8 | 0.8 | 0.8 | 0.0 |
| Others | 0.4 | 0.4 | 0.5 | 0.5 | 0.3 | 3.5 | 7.3 | 21.2 | 13.4 | 11.5 | 10.8 | 9.8 | 10.4 | 1.2 |
| Total | 100 | 100 | 100 | 100 | 100 | 100 | 100 | 100 | 100 | 100 | 100 | 100 | 100 |
Annual distribution of occupational injuries and injuries per worker (injury-to-worker ratio) by economic sectors in Saudi Arabia
| Number of occupational injuries | |||||||||||||
|---|---|---|---|---|---|---|---|---|---|---|---|---|---|
| Economic sector | 2004 | 2005 | 2006 | 2007 | 2008 | 2009 | 2010 | 2011 | 2012 | 2013 | 2014 | 2015 | 2016 |
| Construction | 39299 (42.0) | 42326 (41.4) | 37427 (41.2) | 38929 (42.4) | 44430 (47.6) | 43308 (50.2) | 37527 (49.7) | 36367 (48.0) | 31048 (47.3) | 26700 (50.9) | 35552 (51.3) | 35587 (53.0) | 24760 (46.4) |
| Trade | 24680 (26.4) | 28315 (27.7) | 25946 (28.6) | 25042 (27.3) | 20766 (22.3) | 16939 (19.6) | 16028 (21.2) | 19385 (25.6) | 17275 (26.3) | 10312 (19.7) | 12948 (18.7) | 12480 (18.6) | 11471 (21.5) |
| Manufacturing | 19303 (20.6) | 20283 (19.8) | 17892 (19.7) | 17570 (19.1) | 17741 (19.3) | 15454 (17.9) | 12714 (16.8) | 11921 (15.7) | 10103 (15.4) | 9148 (17.4) | 11400 (16.5) | 9963 (14.9) | 8589 (16.1) |
| Social services | 4302 (4.6) | 4686 (4.6) | 3223 (3.5) | 2927 (3.2) | 2960 (3.2) | 2885 (3.3) | 2033 (2.7) | 1789 (2.4) | 1677 (2.6) | 1511 (2.9) | 1860 (2.7) | 1661 (2.5) | 1651 (3.1) |
| Post & communications | 2202 (2.4) | 2510 (2.5) | 2150 (2.4) | 2499 (2.7) | 2014 (2.2) | 1757 (2.0) | 1502 (2.0) | 1517 (2.0) | 1243 (1.9) | 1117 (2.1) | 1673 (2.4) | 1526 (2.3) | 1365 (2.6) |
| Financing & real estate | 449 (0.5) | 527 (0.5) | 698 (0.8) | 1381 (1.5) | 1662 (1.8) | 2066 (2.4) | 2661 (3.5) | 2179 (2.9) | 2034 (3.1) | 1704 (3.2) | 3112 (4.5) | 3547 (5.3) | 3376 (6.3) |
| Electricity & water | 1392 (1.5) | 1436 (1.4) | 1460 (1.6) | 1274 (1.4) | 1454 (1.6) | 1607 (1.9) | 1147 (1.5) | 1074 (1.4) | 835 (1.3) | 651 (1.2) | 811 (1.2) | 578 (0.9) | 613 (1.1) |
| Mining & quarry | 1077 (1.2) | 1223 (1.2) | 1190 (1.3) | 1354 (1.5) | 1410 (1.5) | 1367 (1.6) | 1129 (1.5) | 985 (1.3) | 941 (1.4) | 906 (1.7) | 1346 (1.9) | 1301 (1.9) | 1157 (2.2) |
| Agriculture & fishing | 817 (0.9) | 953 (0.9) | 867 (1.0) | 846 (0.9) | 848 (0.9) | 828 (1.0) | 746 (1.0) | 608 (0.8) | 500 (0.8) | 418 (0.8) | 539 (0.8) | 444 (0.7) | 422 (0.8) |
Distribution of occupational injuries by day of the week in Saudi Arabia between 2004 and 2011, expressed in percentages
| Day | 2004 | 2005 | 2006 | 2007 | 2008 | 2009 | 2010 | 2011 | Slope |
|---|---|---|---|---|---|---|---|---|---|
| Saturday | 18.6 | 16.3 | 8.0 | 8.4 | 4.0 | 3.7 | 3.9 | 5.6 | -2.0 |
| Sunday | 16.5 | 16.8 | 17.8 | 17.6 | 18.5 | 18.0 | 18.6 | 18.0 | 0.2 |
| Monday | 16.4 | 16.6 | 16.3 | 16.6 | 16.8 | 16.5 | 16.7 | 16.6 | 0.0 |
| Tuesday | 16.1 | 15.8 | 16.0 | 16.3 | 16.2 | 16.6 | 16.4 | 16.6 | 0.1 |
| Wednesday | 15.5 | 15.4 | 16.1 | 15.8 | 16.0 | 16.2 | 16.5 | 16.2 | 0.1 |
| Thursday | 13.4 | 13.8 | 14.8 | 14.8 | 15.1 | 15.4 | 14.9 | 15.3 | 0.2 |
| Friday | 3.6 | 5.3 | 10.8 | 10.5 | 13.5 | 13.6 | 13.1 | 11.7 | 1.3 |
| Total | 100.0 | 100.0 | 100.0 | 100.0 | 100.0 | 100.0 | 100.0 | 100.0 |
Distribution of occupational injuries by type in Saudi Arabia between 2004 and 2011, expressed in percentages
| Type injuries of occupational | 2004 | 2005 | 2006 | 2007 | 2008 | 2009 | 2010 | 2011 | Slope |
|---|---|---|---|---|---|---|---|---|---|
| Secondary contusions | 29.1 | 25.9 | 35.5 | 35.1 | 38.3 | 37.3 | 31.3 | 34.0 | 0.8 |
| Cut & puncture | 21.3 | 19.0 | 23.3 | 24.9 | 26.3 | 27.7 | 23.5 | 22.9 | 0.6 |
| Twist & stretch | 9.3 | 9.4 | 14.3 | 13.6 | 10.5 | 12.1 | 9.5 | 7.6 | -0.2 |
| Fracture & crush | 6.0 | 5.7 | 6.8 | 8.3 | 8.3 | 9.6 | 8.6 | 10.6 | 0.7 |
| Infections | 2.6 | 1.8 | 1.8 | 3.3 | 4.1 | 2.7 | 9.9 | 10.0 | 1.1 |
| Burns | 1.8 | 1.5 | 1.8 | 2.0 | 2.1 | 2.4 | 2.1 | 2.1 | 0.1 |
| Hernia & rupture | 1.5 | 0.8 | 2.3 | 1.4 | 1.0 | 2.3 | 3.8 | 2.5 | 0.3 |
| Dislocation | 0.2 | 0.2 | 0.4 | 0.4 | 0.6 | 0.7 | 1.2 | 0.4 | 0.1 |
| Unspecified | 28.2 | 35.7 | 13.9 | 10.8 | 8.7 | 5.2 | 10.1 | 9.9 | -3.4 |
| Total | 100.0 | 100.0 | 100.0 | 100.0 | 100.0 | 100.0 | 100.0 | 100.0 | 0.8 |
Distribution of occupational injuries by recovery in Saudi Arabia between 2004 and 2016, expressed in percentages
| Injury Status | 2004 | 2005 | 2006 | 2007 | 2008 | 2009 | 2010 | 2011 | 2012 | 2013 | 2014 | 2015 | 2016 | Slope |
|---|---|---|---|---|---|---|---|---|---|---|---|---|---|---|
| Recovers disability with | 3.1 | 4.8 | 3.5 | 3.9 | 4.0 | 3.7 | 3.8 | 4.9 | 3.7 | 3.3 | 9.3 | 4.4 | 5.9 | 0.2 |
| Recovery disability without | 34.1 | 42.0 | 42.2 | 73.4 | 63.7 | 74.9 | 79.7 | 81.9 | 68.4 | 53.4 | 74.7 | 59.3 | 67.6 | 2.1 |
| Under treatment | 62.8 | 53.2 | 54.2 | 22.8 | 32.4 | 21.3 | 16.5 | 13.2 | 28.0 | 43.2 | 16.1 | 36.3 | 26.5 | -2.3 |
| Total | 100.0 | 100.0 | 100.0 | 100.0 | 100.0 | 100.0 | 100.0 | 100.0 | 100.0 | 100.0 | 100.0 | 100.0 | 100.0 |