
Table 1.
The results of the ROC curves analysis of variables for the assessment of the likelihood of death caused by COVID-19 infection
| Variable (parameter) | Cut-off value | Sensitivity | Specificity | AUC (95% CI) | p value |
|---|---|---|---|---|---|
| Duration from the first COVID-19 symptom to CP administration (days) | <9 | 0.510 | 0.500 | 0.598 (0.388–0.807) | p = 0.797 |
| Plasma titers | <2000 | 0.625 | 0.400 | 0.536 (0.342–0.730) | p = 0.670 |
| Age (years old) | ≥68 | 0.750 | 0.840 | 0.842 (0.706–0.978) | p < 0.001 |
| BMI (kg/m2) | ≥30 | 0.500 | 0.760 | 0.577 (0.372–0.781) | p = 0.136 |
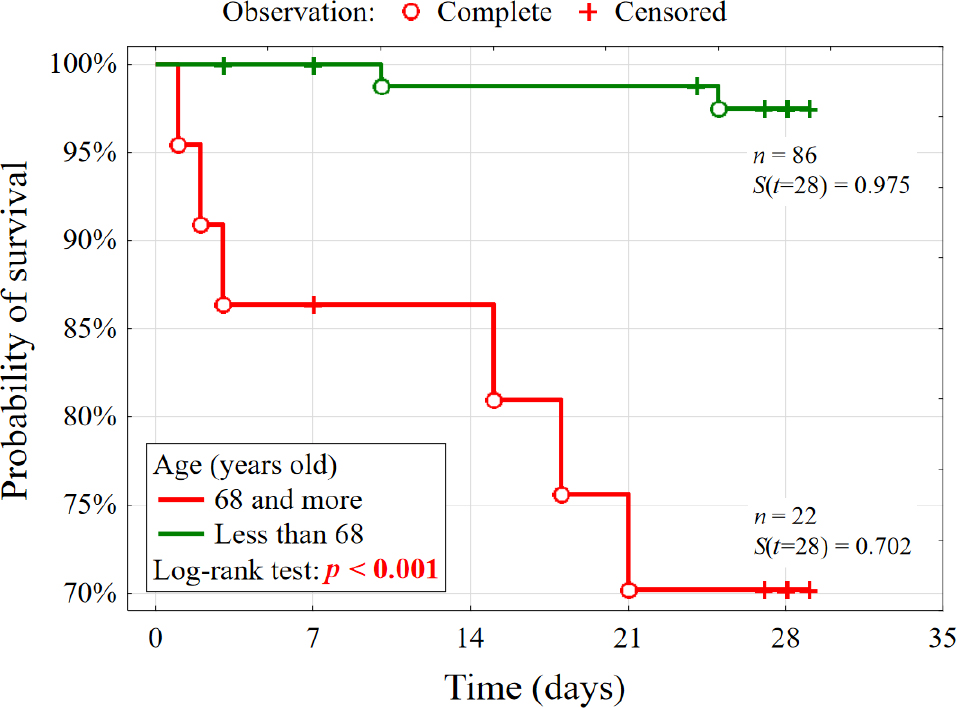
Figure 1.
Kaplan-Meier survival curve demonstrating the probability of survival at 28 days post-CP transfusion stratified by age groups (≥ 68 years vs. < 68 years). The log-rank test revealed a significant difference in survival rates (p < 0.001), with younger patients displaying a higher survival probability (97.5% vs. 70.2%)
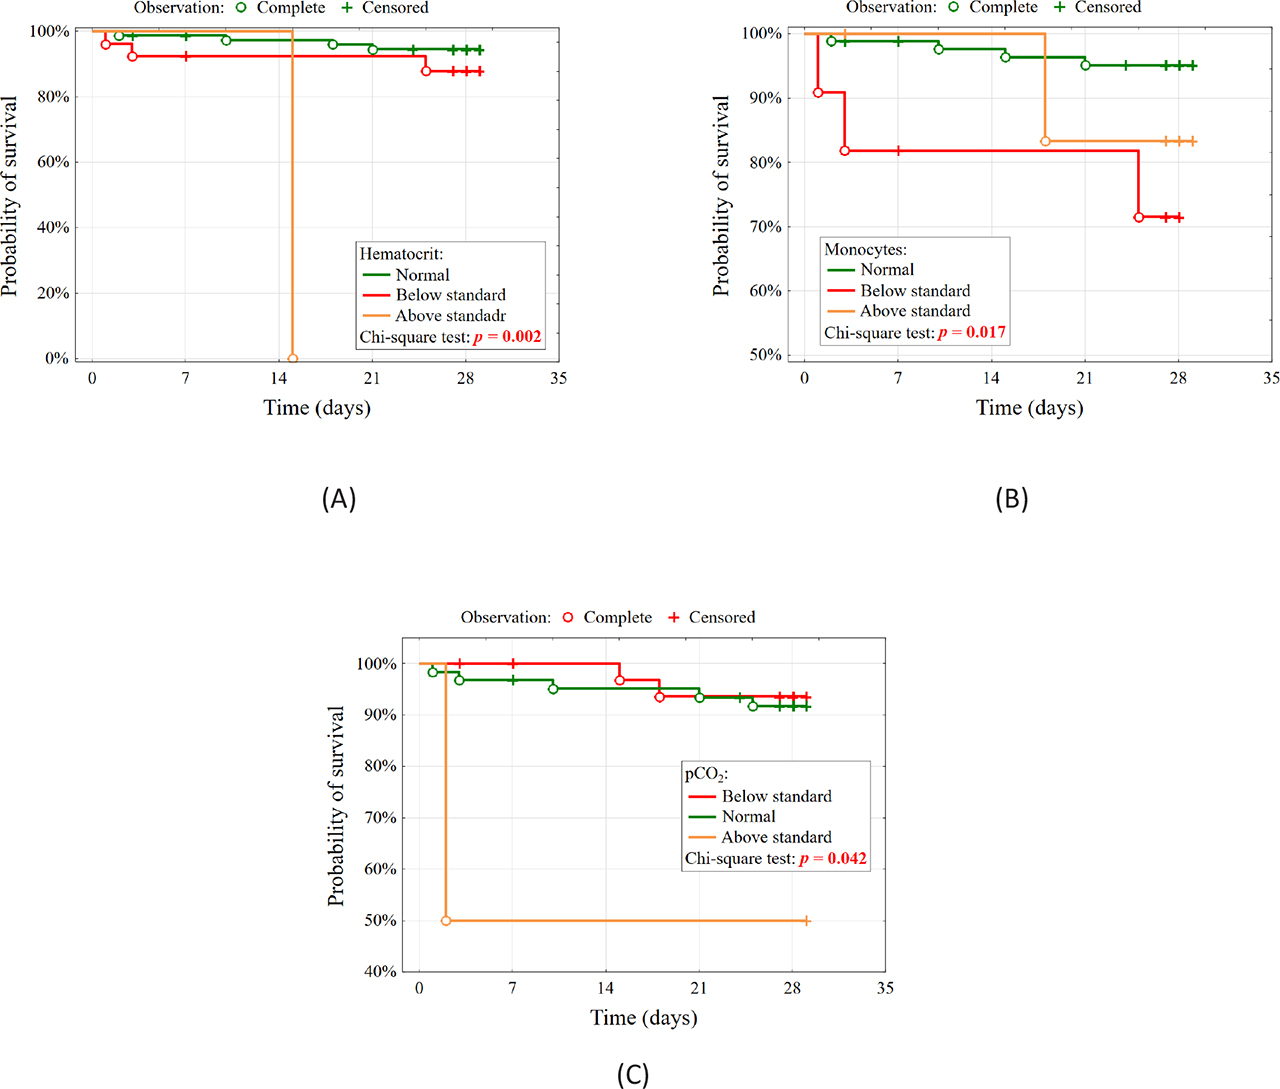
Figure 2.
Kaplan-Meier curves among COVID-19 patients differ by the assessment of the laboratory test results: A) hematocrit level (p = 0.002), B) monocytes level (p = 0.017), and C) pCO2 (p = 0.042) and their associations with survival probability, supported by log-rank tests for statistical significance. V0: baseline (pre-CP transfusion), V1: 3 days post-transfusion, V2: 7 days post-transfusion, V3: 28 days post-transfusion
Table 2.
Post-hoc pairwise comparisons of overall survival probability based on hematocrit, monocyte, and pCO2 levels after CP transfusion
| Subgroups | Hematocrit | Monocytes | pCO2 |
|---|---|---|---|
| Normal vs Below standard | p = 0.257 | p = 0.006 | p = 0.653 |
| Normal vs Above standard | p < 0.001 | p = 0.283 | p = 0.039 |
| Below vs Above standard | p = 0.019 | p = 0.512 | p = 0.021 |
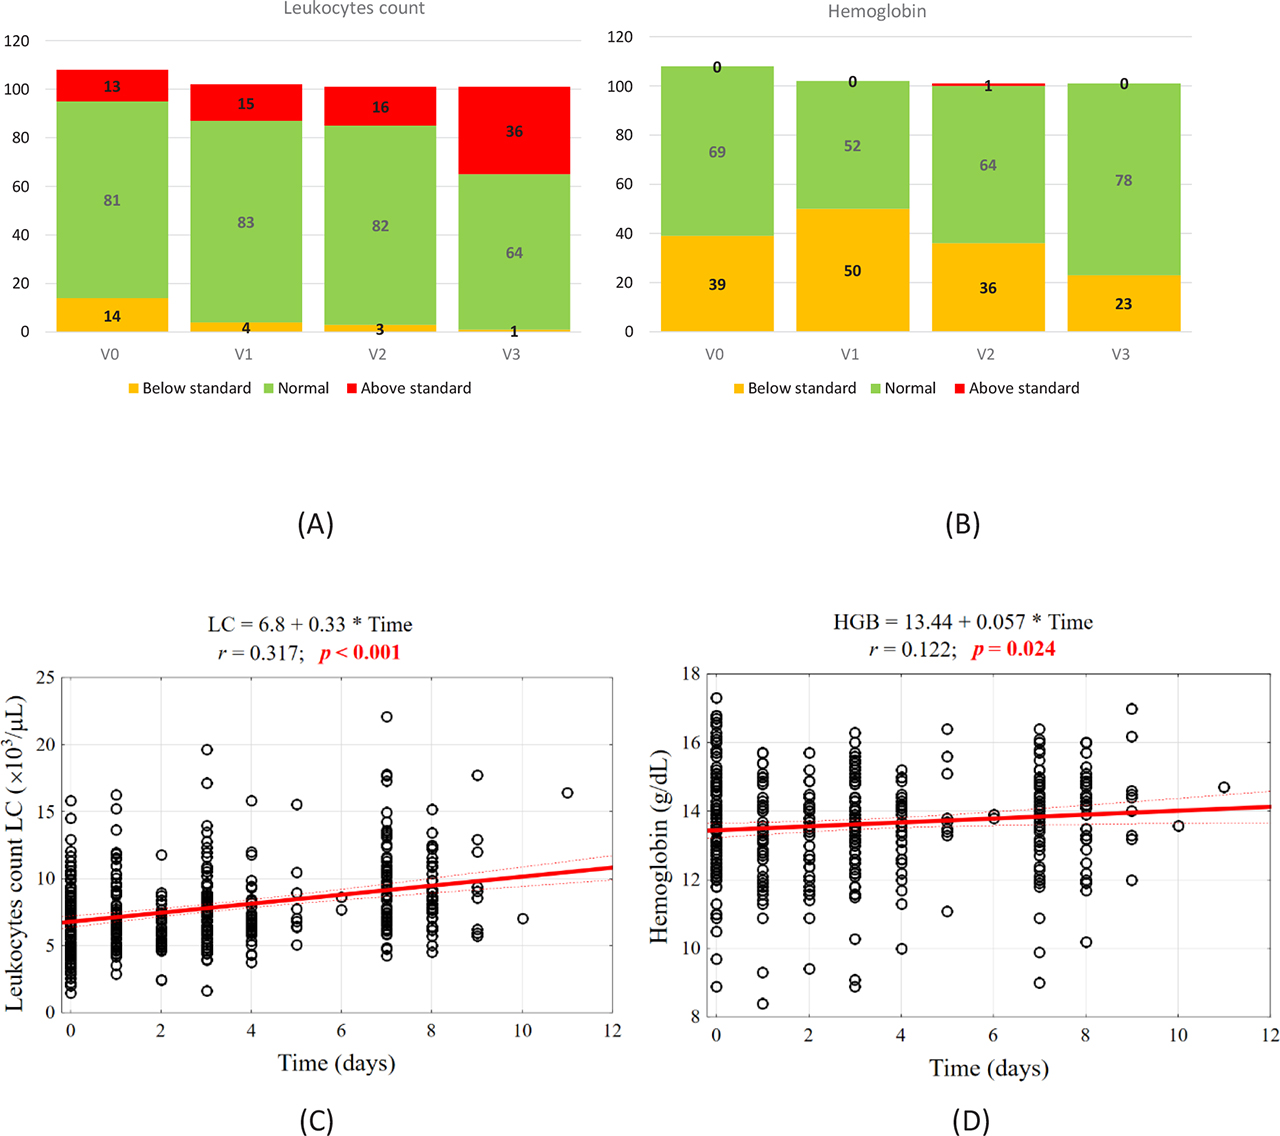
Figure 3.
The distribution of patients differed in leukocyte levels (A) across four visits (pre-CP and three post-CP follow-ups). A significant leukocyte increase is observed (Friedman ANOVA, χ2 = 145.1, p < 0.001). Panel B focuses on hemoglobin levels over the same period, showing progressive normalization (Friedman ANOVA, χ2 = 18.3, p = 0.006). Panels C and D present correlation analyses between leukocyte counts and time post-transfusion, with p-values of < 0.001 and 0.024, respectively. V0 – results directly before the CP administration; V1 – after three days; V2 – after seven days; V3 – after 28 days of CP administration
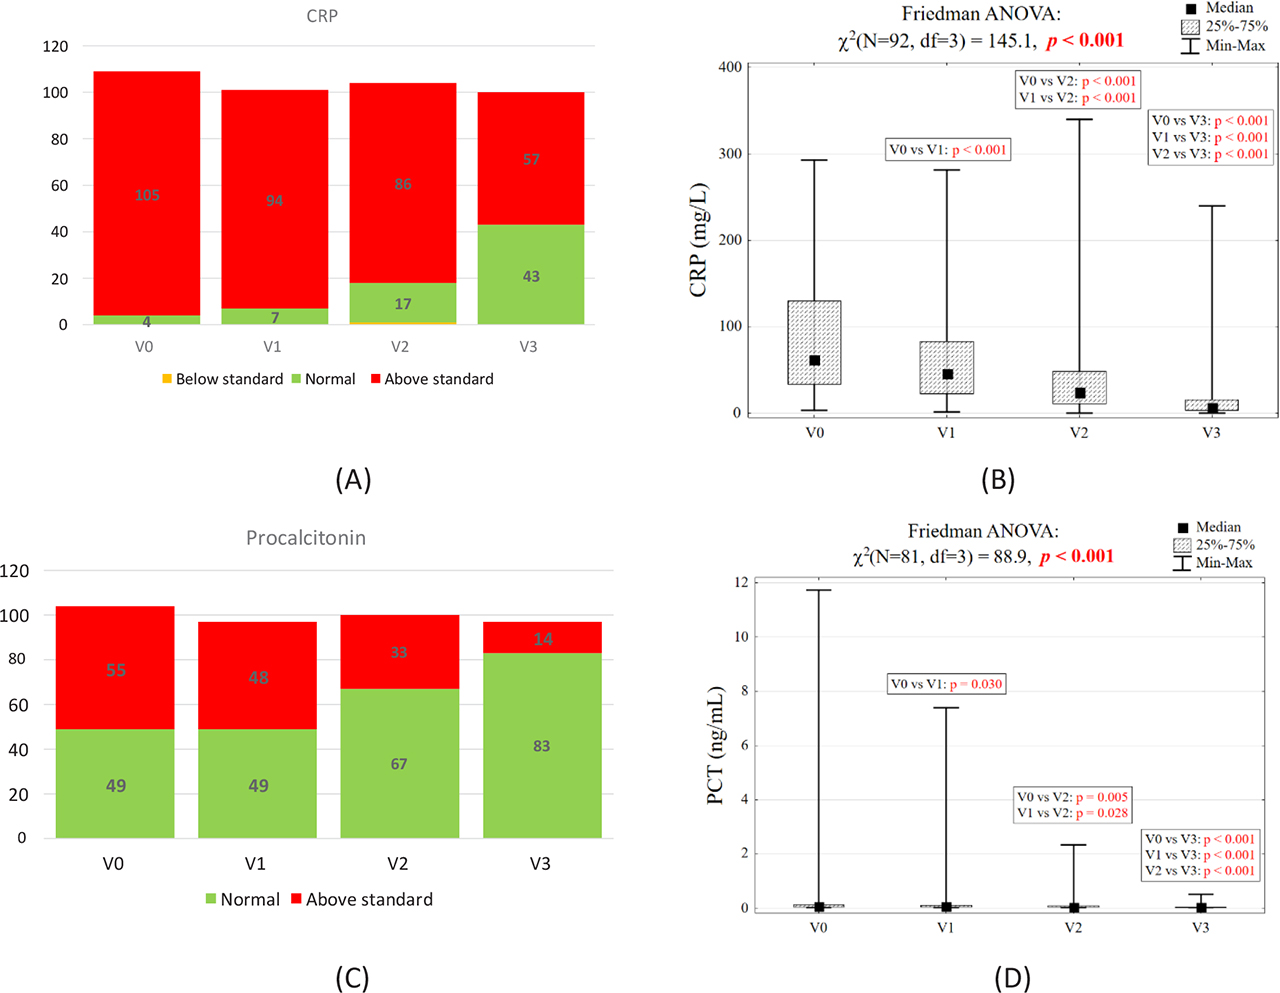
Figure 4.
Patients’ structure differs in assessing the level of inflammation indicators on consecutive days. Panels A and B illustrate CRP levels, with significant declines from baseline to post-CP follow-ups (Friedman ANOVA, χ2 = 145.1, p < 0.001). Panels C and D depict procalcitonin trends, similarly showing reductions (Friedman ANOVA, χ2 = 88.9, p < 0.001). Subpanels include bar graphs with standard deviations and group comparisons via post-hoc tests. Post hoc tests confirmed significant differences between V0 and all subsequent time points for both indicators. V0 – results directly prior the CP administration; V1 – after three days; V2 – after seven days; V3 – after 28 days of CP administration
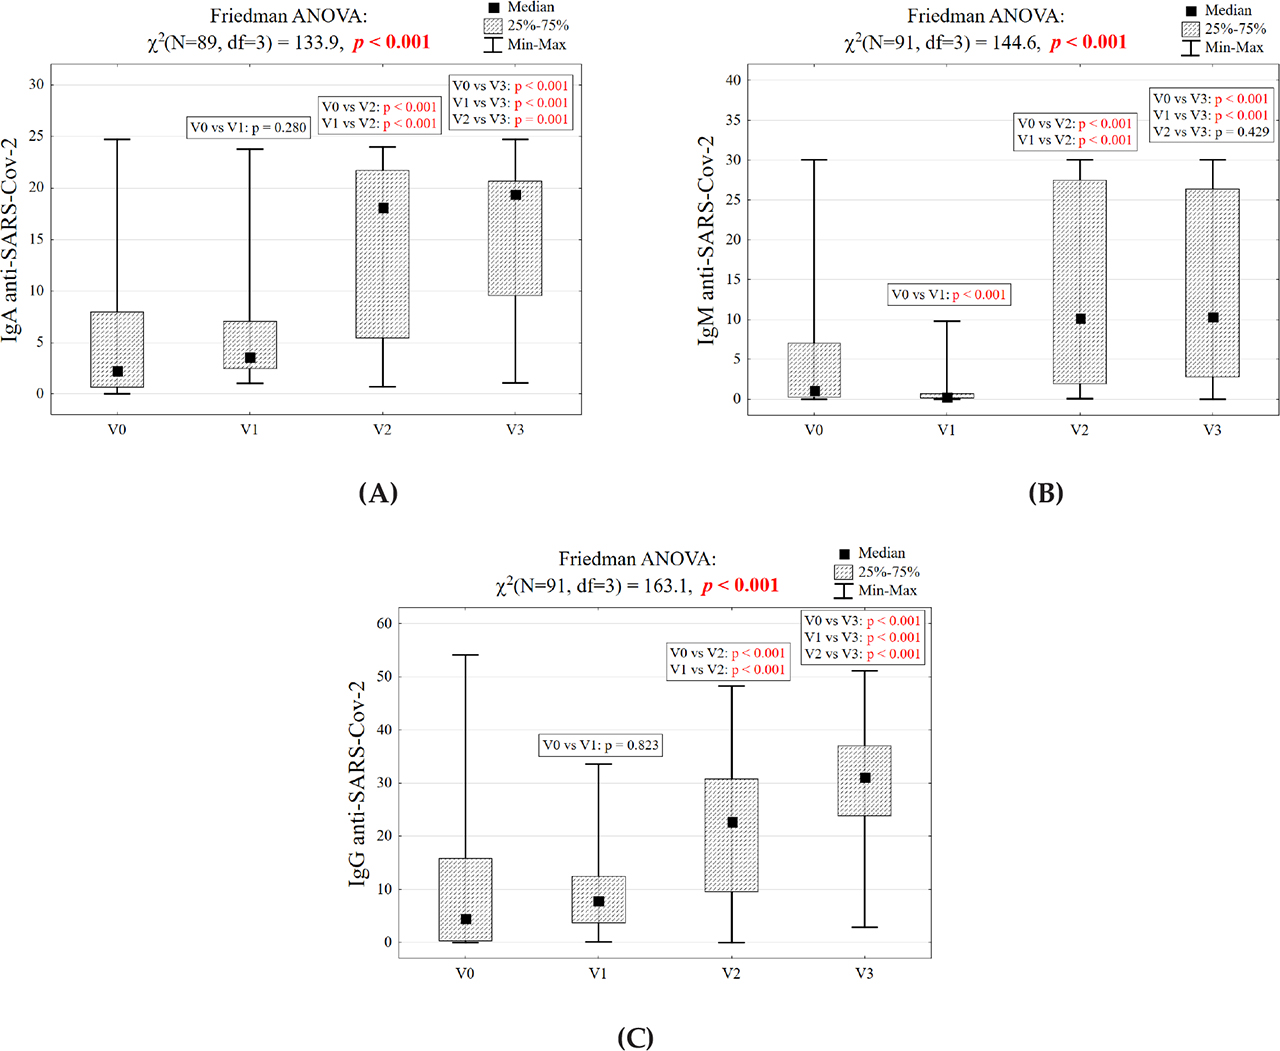
Figure 5.
The results of Friedman tests representing the level of antibodies against: A) IgA – anti - SARS-CoV-2, B) IgM – anti-SARS-CoV-2, and C) IgG – anti-SARS-CoV-2 in the following days of visits (Friedman ANOVA, p < 0.001 for all). Post hoc analysis revealed significant differences between baseline (V0) and 28 days post-CP transfusion (V3) for all antibody types. V0 – results directly prior the CP administration; V1 – after three days; V2 – after seven days; V3 – after 28 days of CP administration (Friedman ANOVA, p < 0.001 for all)
Table S1.
Analysis of hospitalization duration across various patient subgroups stratified by key clinical and demographic parameters, including time between symptom onset and CP administration, donor plasma titer levels, age, BMI, and presence of dyspnea at hospital admission
| Patients subgroups | Me (Q1 – Q3) | Min – Max | p |
|---|---|---|---|
| Time between symptoms and CP administration <9 days | 11 (9 – 14) | 2 – 67 | 0.057 |
| Time between symptoms and CP administration □9 days | 10 (8 – 12) | 3 – 31 | |
| Donor plasma titer = 2000 | 10 (8 – 14) | 2 – 67 | 0.907 |
| Donor plasma titer < 2000 | 10 (8 – 13) | 3 – 52 | |
| Age < 68 years old | 10 (8 – 13) | 2 – 52 | 0.510 |
| Age □ 68 years old | 12 (8 – 16) | 2 – 67 | |
| BMI □ 30 kg/m2 | 10 (8 – 14) | 2 – 67 | 0.684 |
| BMI > 30 kg/m2 | 10 (9 – 13) | 2 – 27 | |
| Hospitalization time (days): Dyspnea during the admission to the hospital | 10 (9 – 14) | 2 – 67 | 0.047 |
| Lack of dyspnea | 9 (6 – 10) | 4 – 18 |
Table S2.
The number (percentage) of plasma recipients differed in categories depending on the results of biochemical, serological parameters in the subsequent visit days (V0 - before CP administration, V1 - after 3 days, V2 – 7 days, V3 – after 28 days of CP administration)
| V0 Before | V1 After 3 days | V2 After 7 days | V3 After 28 days | Chi-squared test | |
|---|---|---|---|---|---|
| Leukocytes count | N = 108 | N = 102 | N= 101 | N = 101 | |
| Below standard | 14 (13.0%) | 4 (3.9%) | 3 (3.0%) | 1 (1.0%) | χ2 = 38.2 |
| Standard | 81 (75.0%) | 83 (81.4%) | 82 (81.2%) | 64 (63.4%) | df = 6 |
| Above standard | 13 (12.0%) | 15 (14.7%) | 16 (15.8%) | 36 (35.6%) | p < 0.001 |
| Hemoglobin | N = 108 | N = 111 | N = 101 | N = 101 | |
| Below standard | 39 (36.1%) | 50 (49.0%) | 36 (35.6%) | 23 (22.8%) | χ2 = 18.3 |
| Standard | 69 (63.9%) | 52 (51.0%) | 64 (63.4%) | 78 (77.2%) | df = 6 |
| Above standard | 0 (0.0%) | 0 (0.0%) | 1 (1.0%) | 0 (0.0%) | p = 0.006 |
| Hematocrit | N = 108 | N = 102 | N = 101 | N = 101 | |
| Below standard | 27 (25.0%) | 37 (36.3%) | 25 (24.8%) | 14 (13.9%) | χ2 = 17.0 |
| Standard | 79 (73.1%) | 65 (63.7%) | 76 (75.2%) | 85 (84.2%) | df = 6 |
| Above standard | 2 (1.9%) | 0 (0.0%) | 0 (0.0%) | 2 (2.0%) | p = 0.009 |
| MCV | N = 108 | N = 102 | N = 101 | N = 101 | |
| Below standard | 3 (2.8%) | 2 (2.0%) | 2 (2.0%) | 1 (1.0%) | χ2 = 1.61 |
| Standard | 98 (90.7%) | 91 (89.2%) | 93 (92.1%) | 93 (92.1%) | df = 6 |
| Above standard | 7 (6.5%) | 9 (8.8%) | 6 (5.9%) | 7 (6.9%) | p = 0.952 |
| MCH | N = 108 | N = 102 | N = 101 | N = 101 | |
| Below standard | 3 (2.8%) | 2 (2.0%) | 2 (2.0%) | 1 (1.0%) | χ2 = 18.6 |
| Standard | 104 (96.3%) | 100 (98.0%) | 99 (98.0%) | 93 (92.1%) | df = 6 |
| Above standard | 1 (0.9%) | 0 (0.0%) | 0 (0.0%) | 7 (6.9%) | p = 0.005 |
| Platelets | N = 108 | N = 102 | N = 101 | N = 101 | |
| Below standard | 16 (14.8%) | 6 (5.9%) | 1 (1.0%) | 1 (1.0%) | χ2 = 69.8 |
| Standard | 88 (81.5%) | 88 (86.3%) | 80 (79.2%) | 62 (61.4%) | df = 6 |
| Above standard | 4 (3.7%) | 8 (7.8%) | 20 (19.8%) | 38 (37.6%) | p < 0.001 |
| Neutrophiles | N = 108 | N = 101 | N = 100 | N = 101 | |
| Below standard | 12 (11.1%) | 7 (6.9%) | 5 (5.0%) | 2 (2.0%) | χ2 = 13.8 |
| Standard | 49 (45.4%) | 57 (56.4%) | 64 (64.0%) | 54 (53.5%) | df = 6 |
| Above standard | 47 (43.5%) | 37 (36.6%) | 31 (31.0%) | 45 (44.6%) | p = 0.032 |
| Limphocytes | N = 108 | N = 101 | N = 100 | N = 101 | |
| Below standard | 85 (78.7%) | 71 (70.3%) | 59 (59.0%) | 31 (30.7%) | χ2 = 57.4 |
| Standard | 20 (18.5%) | 28 (27.7%) | 39 (39.0%) | 65 (64.4%) | df = 6 |
| Above standard | 3 (2.8%) | 2 (2.0%) | 2 (2.0%) | 5 (5.0%) | p < 0.001 |
| Monocytes | N = 108 | N = 101 | N = 100 | N = 101 | |
| Below standard | 11 (10.2%) | 9 (8.9%) | 4 (4.0%) | 3 (3.0%) | χ2 = 18.9 |
| Standard | 90 (83.3%) | 84 (83.2%) | 84 (84.0%) | 76 (75.2%) | df = 6 |
| Above standard | 7 (6.5%) | 8 (7.9%) | 12 (12.0%) | 22 (21.8%) | p = 0.004 |
| Eosynocytes | N = 108 | N = 101 | N = 100 | N = 101 | χ2 = 26.2 |
| Below standard | 42 (38.9%) | 28 (27.7%) | 22 (22.0%) | 9 (8.9%) | df = 3 |
| Standard | 66 (61.1%) | 73 (72.3%) | 78 (78.0%) | 92 (91.1%) | p < 0.001 |
| Basocytes | N = 108 | N = 101 | N = 100 | N = 101 | χ2 = 8.07 |
| Below standard | 4 (3.7%) | 0 (0.0%) | 1 (1.0%) | 0 (0.0%) | df = 3 |
| Standard | 104 (96.3%) | 101 (100.0%) | 99 (99.0%) | 101 (100.0%) | p = 0.045 |
| CRP | N = 109 | N = 101 | N = 104 | N = 100 | |
| Below standard | 0 (0,0%) | 0 (0,0%) | 1 (1,0%) | 0 (0,0%) | χ2 = 71,4 |
| Standard | 4 (3,7%) | 7 (6,3%) | 17 (16,3%) | 43 (43,0%) | df = 6 |
| Above standard | 105 (96,3&) | 94 (84,7%) | 86 (82,7%) | 57 (57,0%) | p < 0,001 |
| Prokalcytoniny | N = 104 | N = 97 | N = 100 | N = 97 | χ2 = 39,2 |
| Standard | 49 (47,1%) | 49 (50,5%) | 67 (67,0%) | 83 (85,6%) | df = 3 |
| Above standard | 55 (52,9%) | 48 (49,5%) | 33 (33,0%) | 14 (14,4%) | p < 0,001 |
| Ferrytyna | N = 102 | N = 96 | N = 97 | N = 96 | |
| Below standard | 0 (0,0%) | 0 (0,0%) | 1 (1,0%) | 0 (0,0%) | χ2 = 9,78 |
| Standard | 12 (11,8%) | 5 (5,2%) | 6 (6,2%) | 14 (14,6%) | df = 6 |
| Above standard | 90 (88,2%) | 91 (94,8%) | 90 (92,8%) | 82 (85,4%) | p = 0,134 |
| D-dimer | N = 106 | N = 101 | N = 97 | N = 95 | χ2 = 6,56 |
| Standard | 38 (35,8%) | 23 (22,8%) | 21 (21,6%) | 27 (28,4%) | df = 3 |
| Above standard | 68 (54,2%) | 78 (77,2%) | 76 (78,4%) | 68 (71,6%) | p = 0,087 |
| LDH | N = 106 | N = 98 | N = 99 | N = 97 | |
| Below standard | 1 (0,9%) | 0 (0,0%) | 1 (1,0%) | 1 (1,0%) | χ2 = 23,2 |
| Standard | 16 (15,1%) | 13 (13,3%) | 23 (23,2%) | 37 (38,2%) | df = 6 |
| Above standard | 89 (84,0%) | 85 (86,7%) | 75 (75,8%) | 59 (60,8%) | p < 0,001 |
| pH | N = 104 | N = 84 | N = 89 | N = 86 | |
| Below standard | 3 (2,9%) | 1 (1,2%) | 0 (0,0%) | 1 (1,2%) | χ2 = 7,24 |
| Standard | 32 (30,8%) | 37 (44,0%) | 29 (32,6%) | 28 (32,5%) | df = 6 |
| Above standard | 69 (66,3%) | 46 (54,8%) | 60 (67,4%) | 57 (66,3%) | p = 0,299 |
| PO2 | N = 104 | N = 84 | N = 89 | N = 85 | |
| Below standard | 64 (61,5%) | 56 (66,7%) | 63 (70,8%) | 55 (64,7%) | χ2 = 7,25 |
| Standard | 34 (32,7%) | 17 (20,2%) | 19 (21,3%) | 22 (25,9%) | df = 6 |
| Above standard | 6 (5,8%) | 11 (13,1%) | 7 (7,9%) | 8 (9,4%) | p = 0,298 |
| PCO2 | N = 104 | N = 84 | N = 89 | N = 86 | |
| Below standard | 38 (36,5%) | 17 (20,2%) | 20 (22,5%) | 20 (23,2%) | χ2 = 9,69 |
| Standard | 63 (60,6%) | 66 (78,6%) | 67 (75,3%) | 63 (73,3%) | df = 6 |
| Above standard | 3 (2,9%) | 1 (1,2%) | 2 (2,2%) | 3 (3,5%) | p = 0,138 |
| HCO3 | N = 104 | N = 84 | N = 89 | N = 86 | |
| Below standard | 7 (6,7%) | 1 (1,2%) | 0 (0,0%) | 1 (1,2%) | χ2 = 18,8 |
| Standard | 91 (87,5%) | 75 (89,3%) | 79 (88,8%) | 69 (80,2%) | df = 6 |
| Above standard | 6 (5,8%) | 8 (9,5%) | 10 (11,2%) | 16 (18,6%) | p = 0,005 |
| BE | N = 102 | N = 84 | N = 89 | N = 86 | |
| Below standard | 6 (5,9%) | 1 (1,2%) | 0 (0,0%) | 0 (0,0%) | χ2 = 17,8 |
| Standard | 70 (68,6%) | 49 (58,3%) | 52 (58,4%) | 58 (67,4%) | df = 6 |
| Above standard | 26 (25,5%) | 34 (40,5%) | 37 (41,6%) | 28 (32,6%) | p = 0,007 |
| O2 | N = 104 | N = 84 | N = 88 | N = 85 | |
| Below standard | 76 (73,1%) | 70 (83,3%) | 73 (83,0%) | 62 (72,9%) | χ2 = 6,47 |
| Standard | 27 (26,0%) | 14 (16,7%) | 15 (17,0%) | 22 (25,9%) | df = 6 |
| Above standard | 1 (1,0%) | 0 (0,0%) | 0 (0,0%) | 1 (1,2%) | p = 0,372 |
Table S3.
Number (percentage) of plasma recipients differing by the categories depending on the SARS-CoV-2 antibodies levels during a subsequent visits (V0 - test before CP administration, V2 - after 7 days, V3 - after 28 days of CP administration)
| V0 Before | V2 After 7 days | V3 After 28 days | Chi-square test | |
|---|---|---|---|---|
| IgA anty-SARS-CoV-2 | N = 108 | N = 97 | N = 96 | |
| Negative | 34 (30.9%) | 5 (5.2%) | 0 (0.0%) | χ2 = 52.8 |
| Inconsistent | 3 (2.7%) | 2 (2.0%) | 1 (1.0%) | df = 4 |
| Positive | 73 (66.4%) | 90 (92.8%) | 95 (99.0%) | p < 0.001a |
| IgA anty-SARS-CoV-2 | N = 108 | N = 97 | N = 96 | χ2 = 73.3 |
| Me [Q1; Q3] | 2.3 [1; 8] | 18.1 [5; 22] | 19.4 [10–21] | df = 2 |
| Min – Max | 0 – 25 | 1 – 24 | 1 – 25 | p < 0.001b |
| IgM anty-SARS-CoV-2 | N = 108 | N = 98 | N = 96 | χ2 = 32.5 |
| Negative | 52 (47.3%) | 19 (19.4%) | 14 (14.6%) | df = 2 |
| Positive | 58 (52.7%) | 79 (80.6%) | 82 (85.4%) | p < 0.001a |
| IgM anty-SARS-CoV-2 | N = 108 | N = 97 | N = 96 | χ2 = 83.3 |
| Me [Q1; Q3] | 1.1 [0; 7] | 10.2 [2; 27] | 10.3 [3; 26] | df = 2 |
| Min – Max | 0 – 30 | 0 – 30 | 0 – 30 | p < 0.001b |
| IgG anty-SARS-CoV-2 | N = 108 | N = 98 | N = 96 | χ2 = 53.5 |
| Negative | 38 (34.2%) | 6 (6.1%) | 1 (1.0%) | df = 2 |
| Positive | 73 (65.8%) | 92 (93.9%) | 95 (99.0%) | p < 0.001a |
| IgG anty-SARS-CoV-2 | N = 108 | N = 97 | N = 96 | χ2 = 125.8 |
| Me [Q1; Q3] | 4.5 [0.3; 16] | 22.7 [10; 31] | 31.2 [24; 37] | df = 2 |
| Min – Max | 0 – 54.1 | 0 – 48.3 | 2.9 – 51.2 | p < 0.001b |
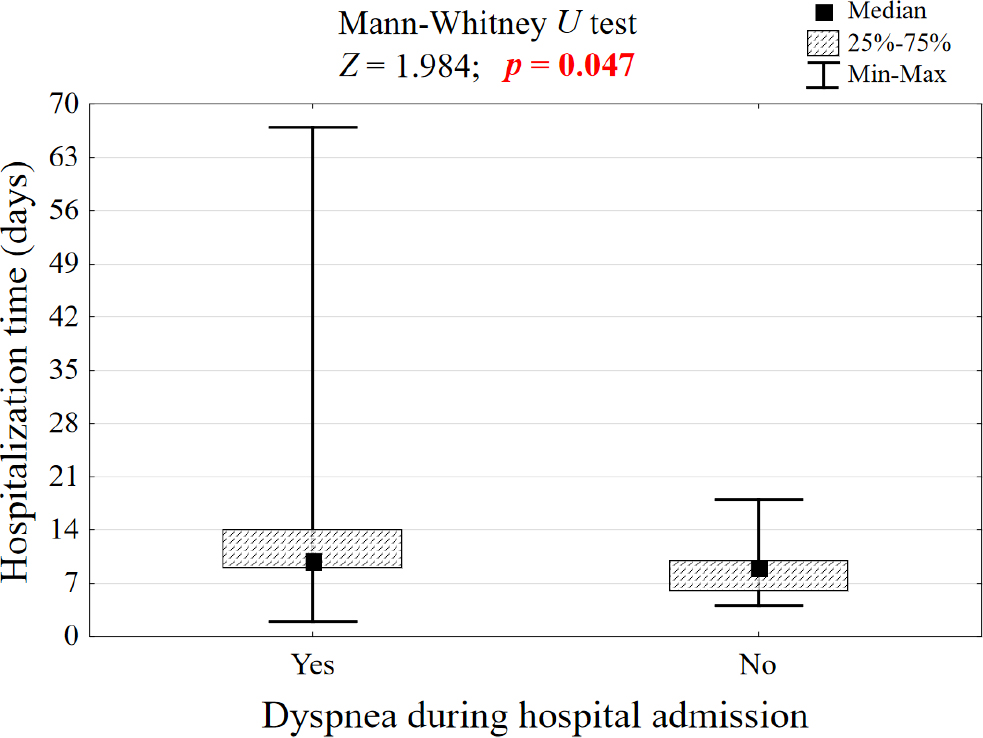
Figure S1.
Duration of hospitalization among patients admitted due to COVID-19-associated dyspnea compared to those admitted for other reasons. The boxplot demonstrates a significantly longer duration of hospitalization for patients with dyspnea (Mann-Whitney U test, p = 0.047)
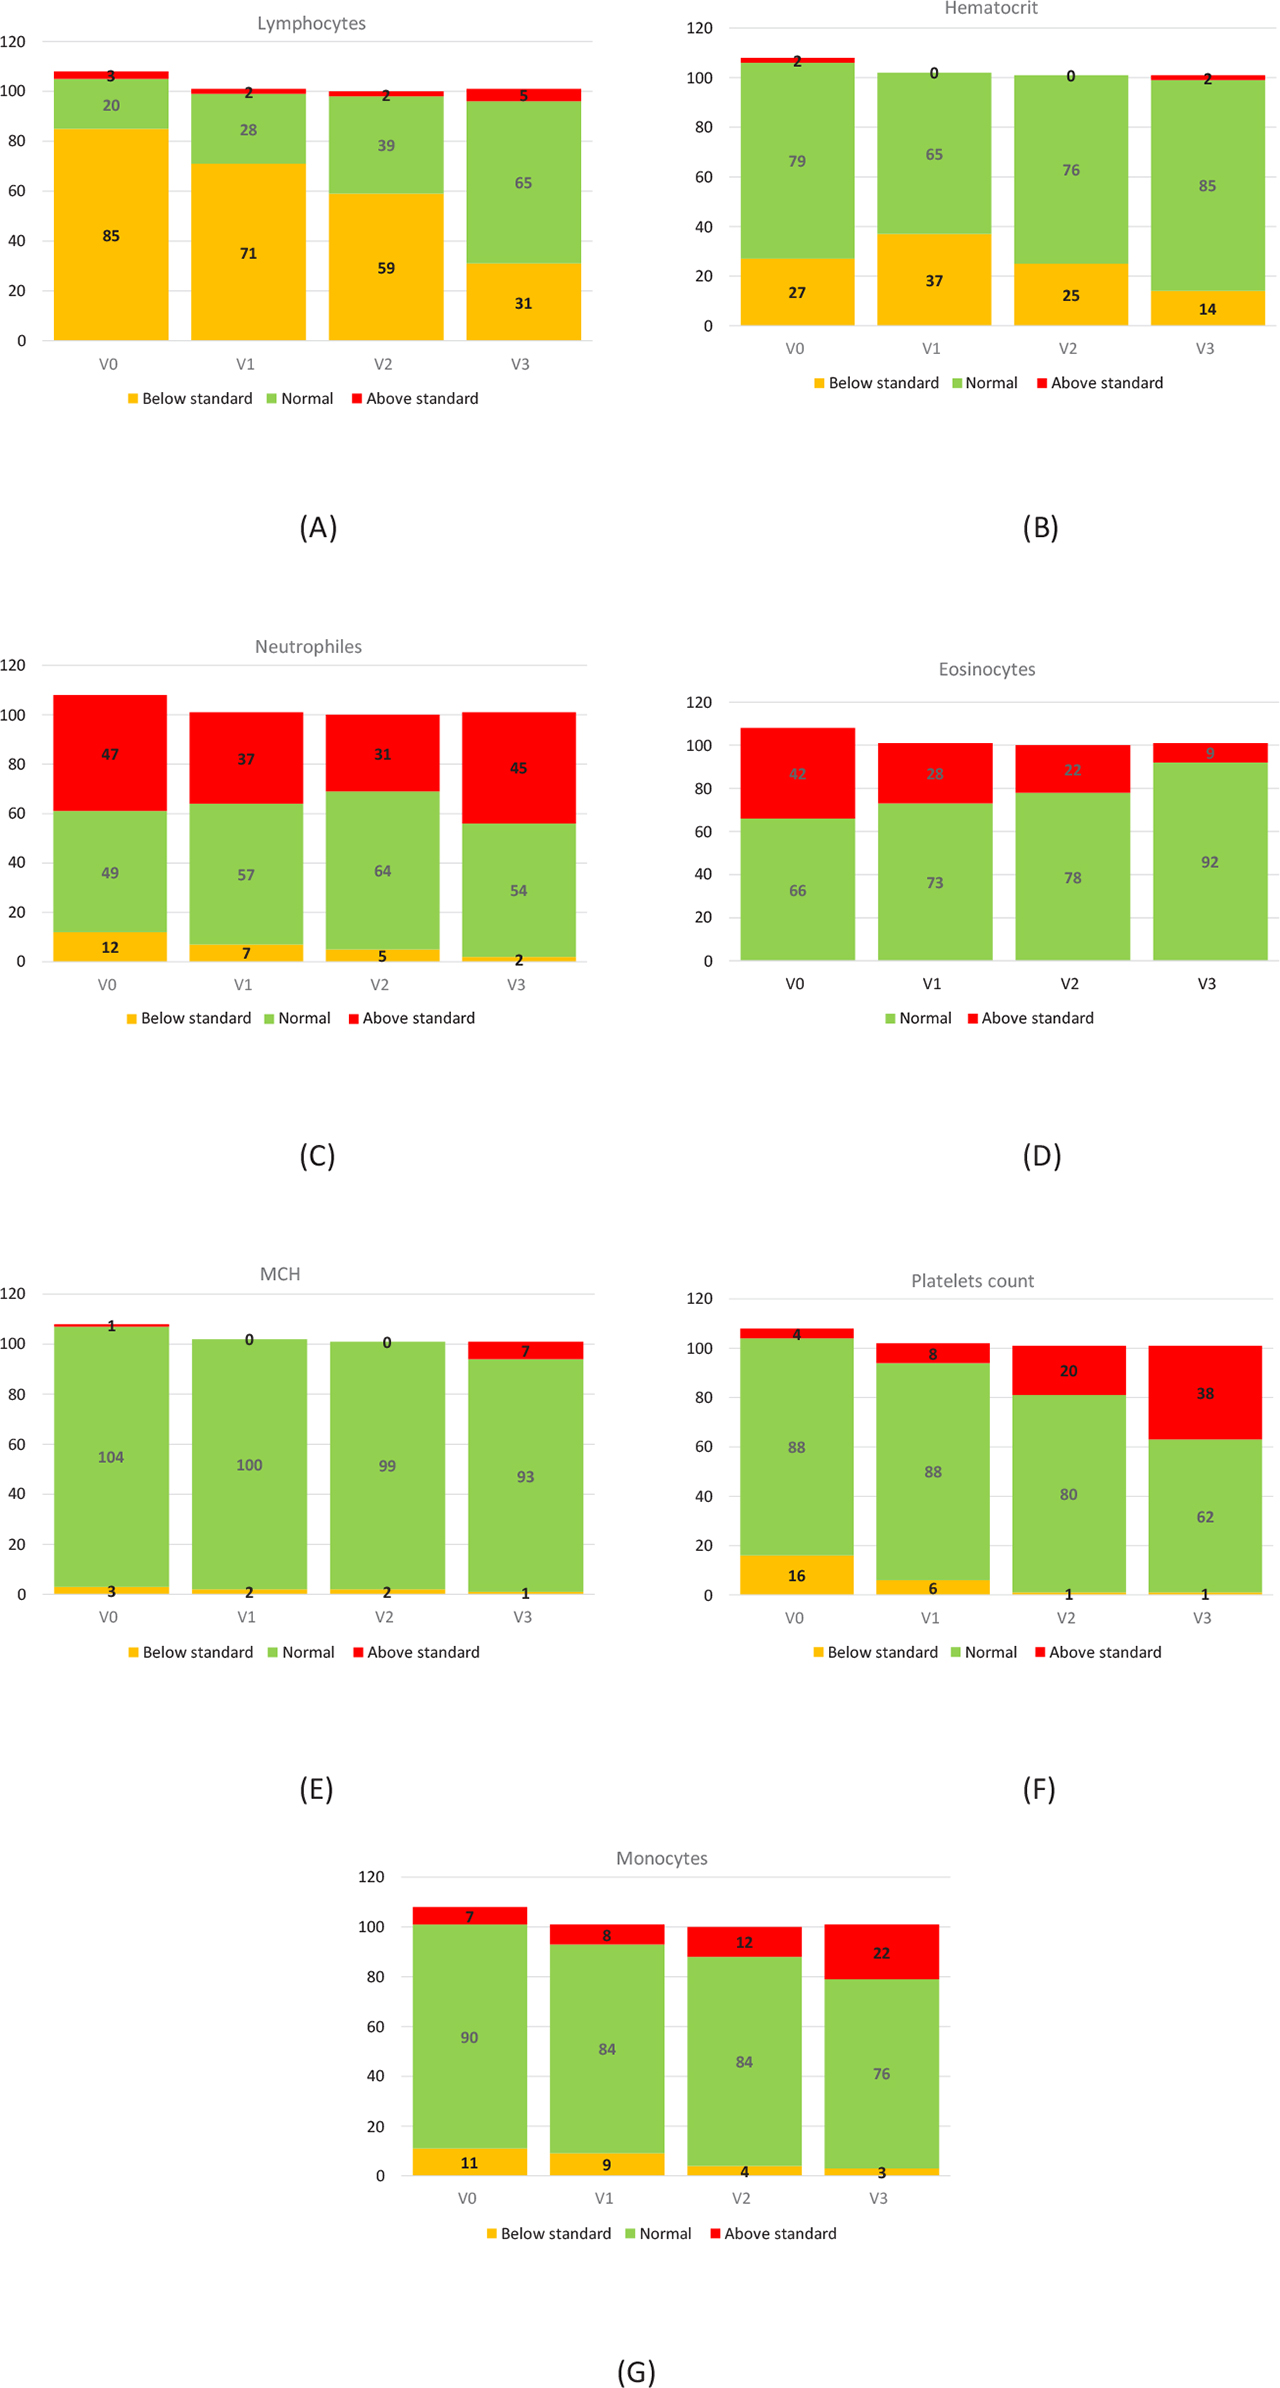
Figure S2.
The structure of number of patients differing in the assessment of the level of serological response in the consecutive days of the visits including A) hematocrit, B) lymphocytes, C) neutrophiles, D) eosinocytes, E) MCH (Mean corpuscular hemoglobin), F) platelets, G) monocytes levels. V0- first visit prior CP administration, V1 – subsequent visit after 3 days, V2 – subsequent visit after 7 days, V3 – subsequent visit after 28 days of CP administration