
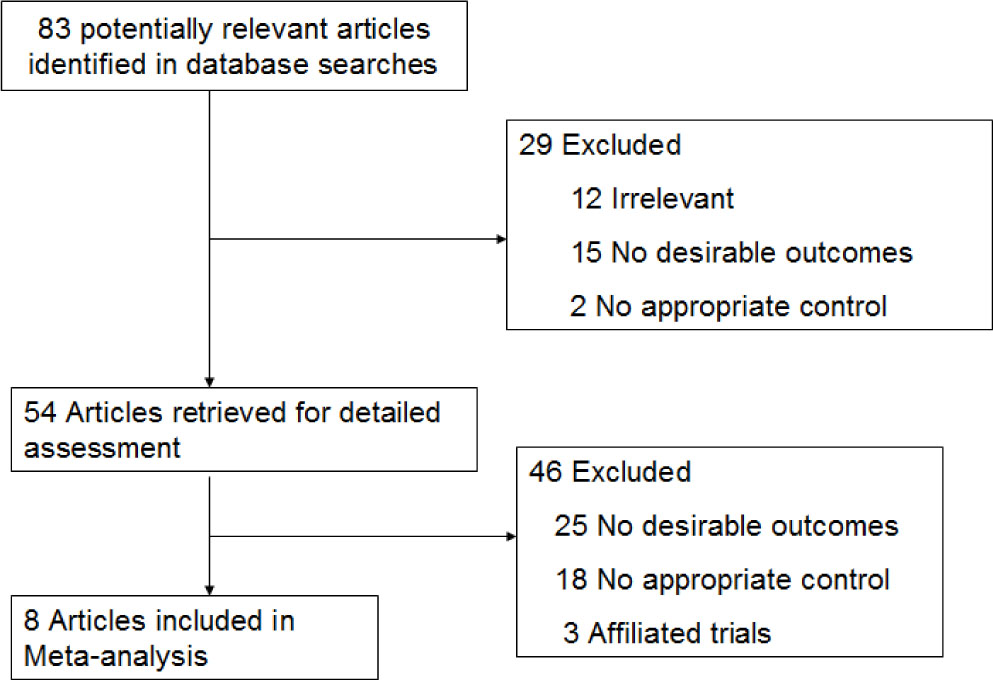
Figure 1.
Flow chart of literature selection process
Table 1.
Characteristics of studies included in meta-analysis of role of surgery for patients with recurrent or metastatic gastrointestinal stromal tumors
| Author, Year | Country | No. of patients | Sex(male/female) | Mean age (year) | Mean Tumor size (cm) | Classification of recurrent or metastatic GISTs | Type of TKIs | Timing of TKIs | Surgical management | Follow-up (median, range) | Study design |
|---|---|---|---|---|---|---|---|---|---|---|---|
| Chang SC 2015[18] | China | 182 | S:44/32 | S:55.89 | ---- | metastatic or recurrent GISTs | imatinib | Preop + Postop |
| ---- | Retrospective |
| NS:66/40 | NS:58.42 | ||||||||||
| Zaydfudim V 2015[9] | USA | 87 | S:31/23 | S:61 |
| metastatic or recurrent GISTs | Imatinib or sunitinib | Preop + Postop |
| ---- | Retrospective |
| NS:17/16 | NS:60 | ||||||||||
| Sato S 2016 [19] | Japan | 93 | S:28/22 | S:60 | S:7.5 | metastatic or recurrent GISTs | Imatinib | Postop only |
| 75.2 | Retrospective |
| NS:28/15 | NS:69.7 | NS:8 | |||||||||
| Shi YN 2017 [20] | China | 130 | 90/54 | 56 | ---- | metastatic GISTs | Imatinib then sunitinib | Postop only |
| 48.2 | Retrospective |
| Xiao B 2018 [21] | China | 102 | S:11/10 | 52 | 4.4 | metastatic GISTs | Imatinib then sunitinib | Postop only |
| ---- | Retrospective |
| NS:60/21 | |||||||||||
| Xia L 2010 [22] | China | 39 | S:10/9 | 53 | S: 8.9 | metastatic GISTs | Imatinib | Preop + Postop | ---- | 36 | Retrospective |
| NS:11/9 | 55 | N:9.3 | |||||||||
| Bauer S 2005[8] | USA | 90 | S:6/6 | S:57 | ----- | Metastatic GISTs | Imatinib | Preop + Postop |
| ---- | Retrospective |
| NS:45/33 | NS:62 | ||||||||||
| Xue A 2022 [23] | China | 119 | S:34/28 | 56 | 4 | metastatic GISTs | imatinib | Preop + Postop |
| 56 | Retrospective |
| NS:37/20 |
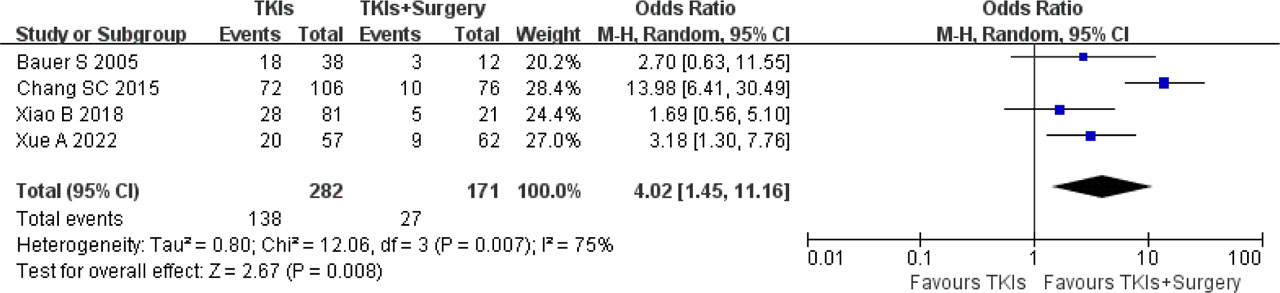
Figure 2A.
Meta-analysis of 3-year PFS between surgery plus TKIs group and TKIs alone group. A forest plot displays individual study results (squares) along with their confidence intervals (horizontal lines). The size of the square represents the weight of the study. The pooled odds ratio is represented by a diamond, with the diamond’s width indicating the 95% confidence interval for the pooled odds ratio
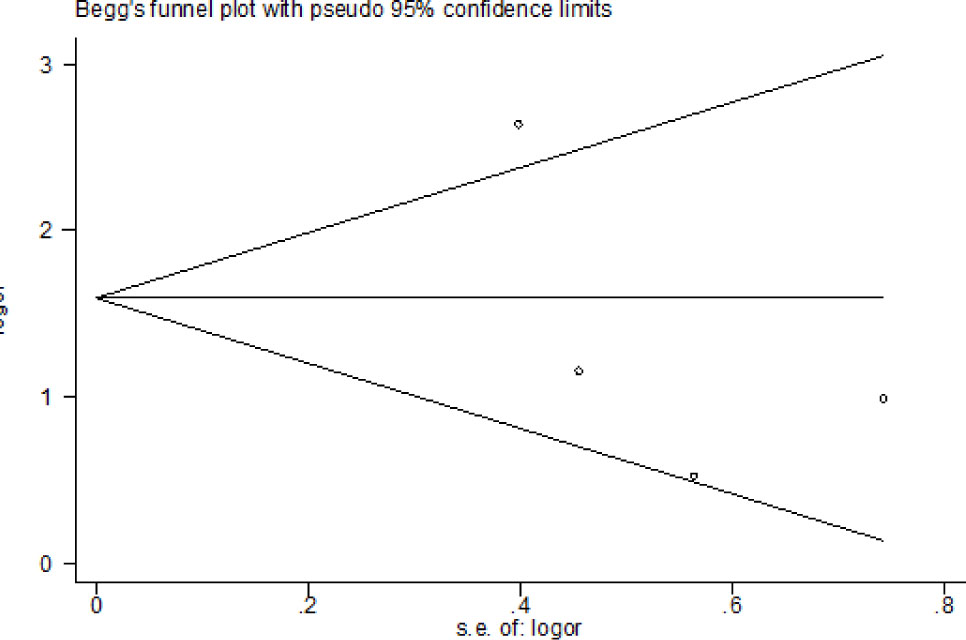
Figure 2B.
Begg’s funnel plot for visual assessment of no publication bias for 3-year PFS
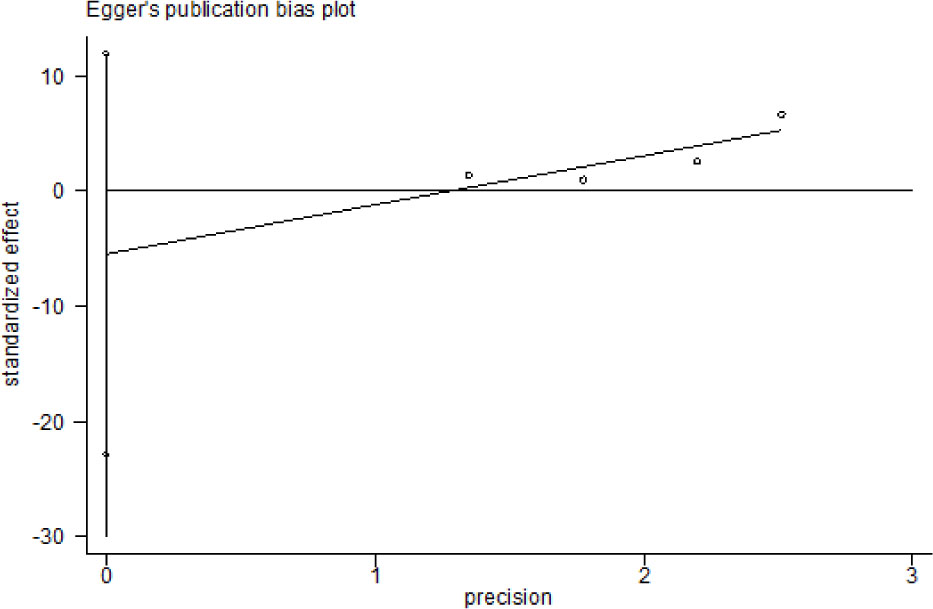
Figure 2C.
Egger’s publication bias plot showed no publication bias for 3-year PFS
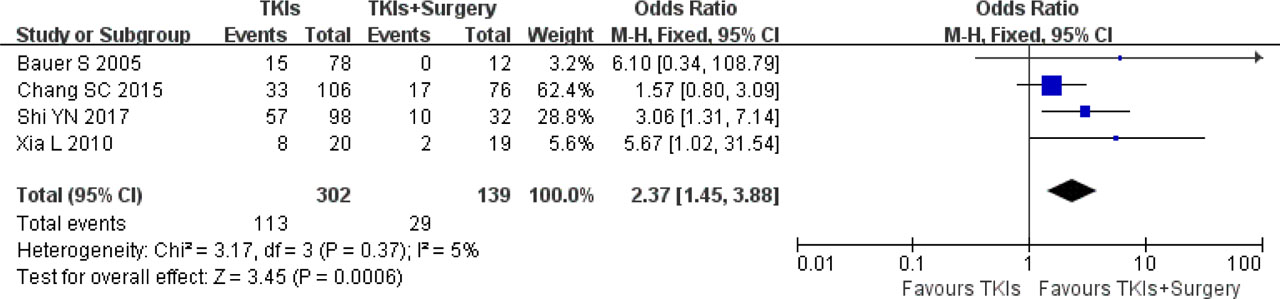
Figure 3.
Meta-analysis of 3-year OS between surgery plus TKIs group and TKIs alone group. A forest plot displays individual study results (squares) along with their confidence intervals (horizontal lines). The size of the square represents the weight of the study. The pooled odds ratio is represented by a diamond, with the diamond’s width indicating the 95% confidence interval for the pooled odds ratio
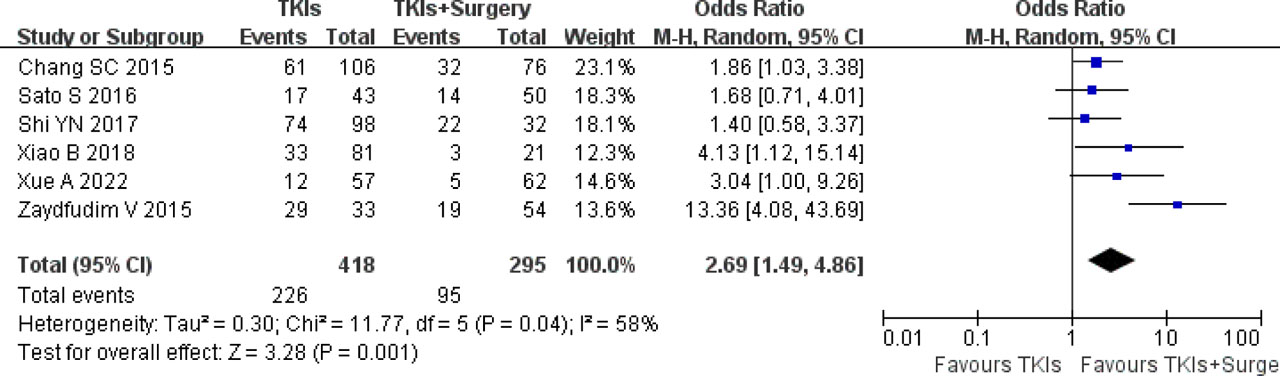
Figure 4.
Meta-analysis of 5-year OS between surgery plus TKIs group and TKIs alone group. A forest plot displays individual study results (squares) along with their confidence intervals (horizontal lines). The size of the square represents the weight of the study. The pooled odds ratio is represented by a diamond, with the diamond’s width indicating the 95% confidence interval for the pooled odds ratio
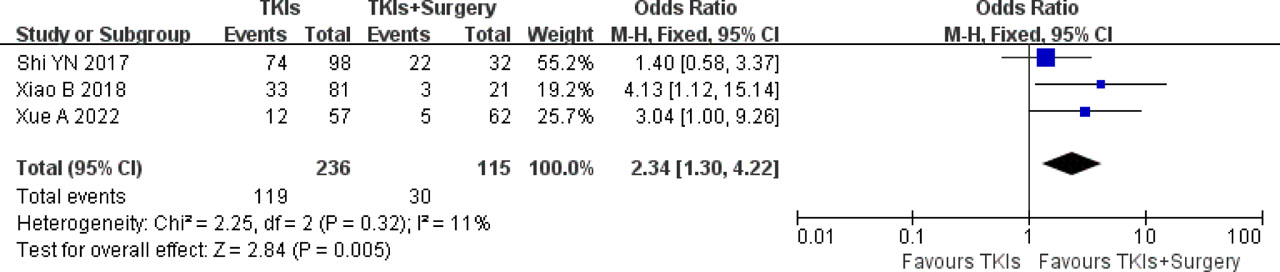
Figure 5.
Meta-analysis of 5-year OS between surgery plus TKIs group and TKIs alone group for GLM. A forest plot displays individual study results (squares) along with their confidence intervals (horizontal lines). The size of the square represents the weight of the study. The pooled odds ratio is represented by a diamond, with the diamond’s width indicating the 95% confidence interval for the pooled odds ratio