
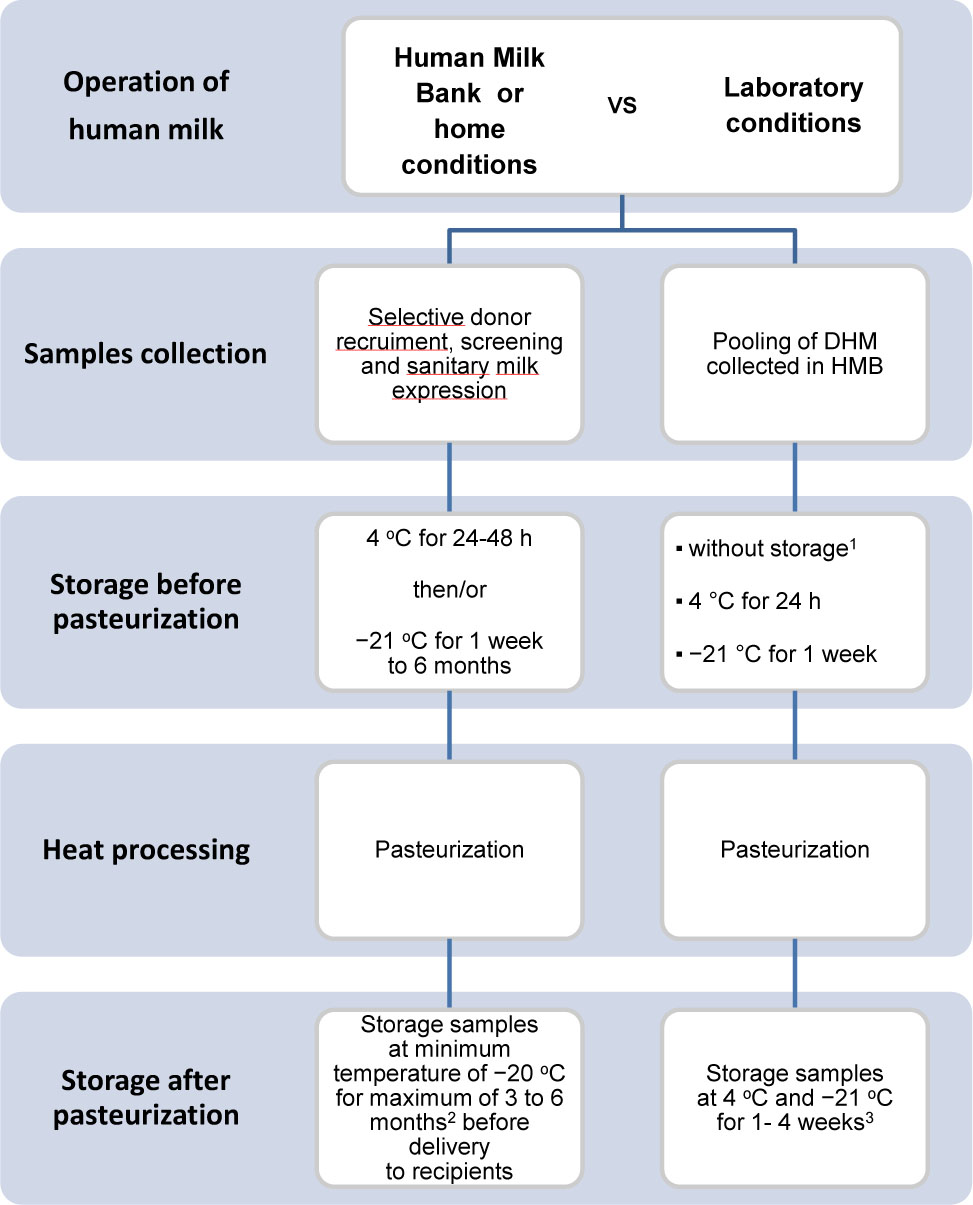
Figure 1.
Mapping of the HMBs’/home procedures under laboratory conditions 1In situations when sample was pasteurized immediately after collection of DHM; 2,3the most samples were used during first month of storing
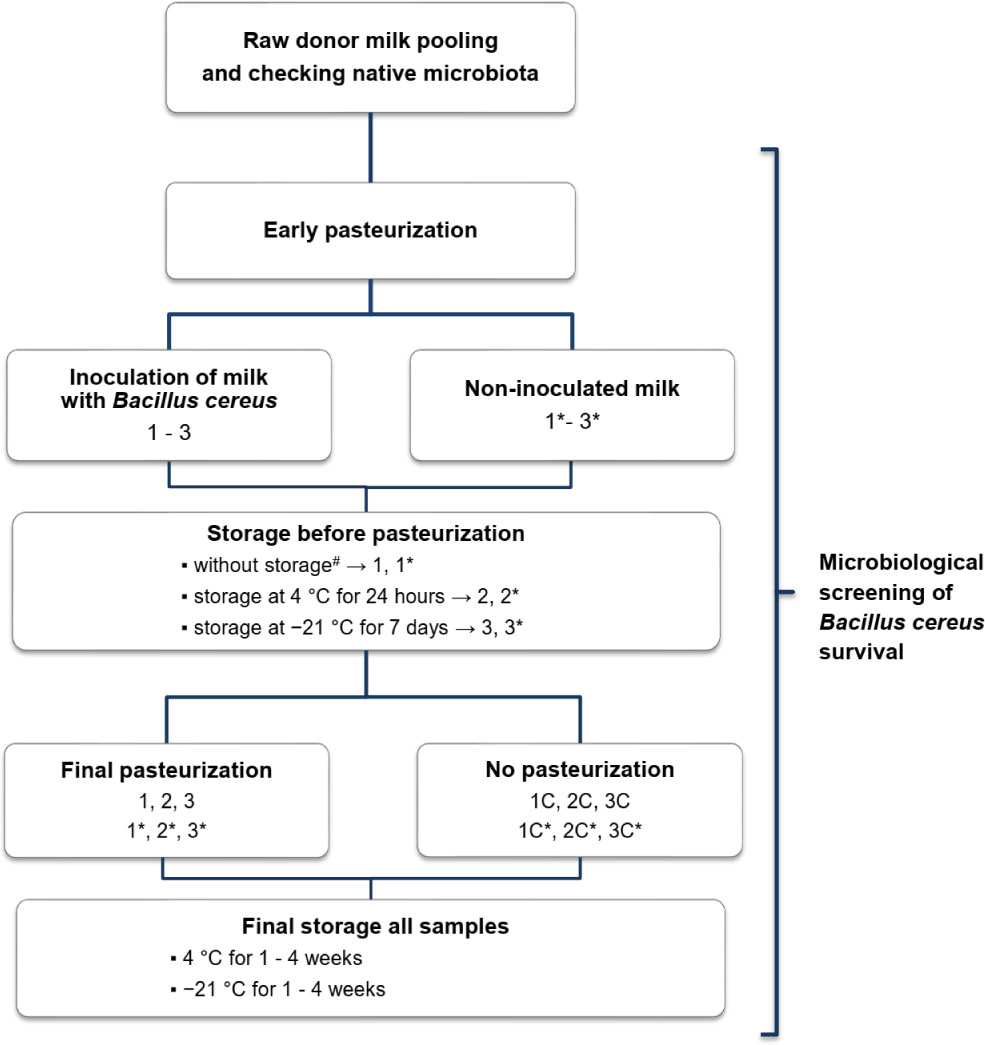
Figure 2.
Study design of Bacillus cereus survival
1, 2, 3—testing samples (inoculated, pasteurized); 1C, 2C, 3C—control of bacterial viability (inoculated, unpasteurized); 1*, 2*, 3*—pasteurization process control (non-inoculated, pasteurized); 1C*, 2C*, 3C*—(non-inoculated, unpasteurized). 1In situations when sample was pasteurized immediately after collection of DHM
Table 1.
Viability of Bacillus cereus after processes in the study
| Phase | Raw milk | Early pasterurization | Inoculated milk1 | Storage before final pasteurization | Final pasteurization | Final storage conditions | ||||||||
|---|---|---|---|---|---|---|---|---|---|---|---|---|---|---|
| −22 °C | 4 °C | |||||||||||||
| Sample | 1 wk | 2 wks | 3 wks | 4 wks | 1 wk | 2 wks | 3 wks | 4 wks | ||||||
| 1 | 0.00 | 0.00 | 5.81±0.19 | Processed immediately after inoculation2 | 5.81±0.19 | 0.00 | 0.00 | 0.00 | 0.00 | 0.00 | 0.00 | 0.00 | 0.00 | 0.00 |
| 1* | 0.00 | 0.00 | 0.00 | 0.00 | 0.00 | 0.00 | 0.00 | 0.00 | 0.00 | 0.00 | 0.00 | |||
| 1C | 5.53±0.01 | 5.53±0.01 | x | 3.05±0.21 | 0.00 | 0.00 | 0.00 | 5.42±0.02 | 0.00 | 0.00 | 0.00 | |||
| 1C* | 0.00 | 0.00 | x | 0.00 | 0.00 | 0.00 | 0.00 | 0.00 | 0.00 | 0.00 | 0.00 | |||
| 2 | 5.81±0.08 | 24 h at 4 °C | 5.72±0.03 | 0.00 | 0.00 | 0.00 | 0.00 | 0.00 | 0.00 | 0.00 | 0.00 | 0.00 | ||
| 2* | 0.00 | 0.00 | 0.00 | 0.00 | 0.00 | 0.00 | 0.00 | 0.00 | 0.00 | 0.00 | 0.00 | |||
| 2C | 5.58±0.02 | 5.54±0.11 | x | 3.14±0.21 | 0.00 | 0.00 | 0.00 | 5.25±0.05 | 0.00 | 0.00 | 0.00 | |||
| 2C* | 0.00 | 0.00 | x | 0.00 | 0.00 | 0.00 | 0.00 | 0.00 | 0.00 | 0.00 | 0.00 | |||
| 3 | 5.74±0.47 | 7 days at −21 °C | 2.82±0.13 | 0.00 | 0.00 | 0.00 | 0.00 | 0.00 | 0.00 | 0.00 | 0.00 | 0.00 | ||
| 3* | 0.00 | 0.00 | 0.00 | 0.00 | 0.00 | 0.00 | 0.00 | 0.00 | 0.00 | 0.00 | 0.00 | |||
| 3C | 5.54±0.12 | 2.39±0.39 | x | 0.00 | 0.00 | 0.00 | 0.00 | 0.00 | 0.00 | 0.00 | 0.00 | |||
| 3C* | 0.00 | 0.00 | x | 0.00 | 0.00 | 0.00 | 0.00 | 0.00 | 0.00 | 0.00 | 0.00 | |||
At each stage, microbiological analyses were performed. 1, 2, 3—testing samples (inoculated, pasteurized); 1C, 2C, 3C—control of bacterial viability (inoculated, unpasteurized); 1*, 2*, 3*—pasteurization process control (non-inoculated, pasteurized); 1C*, 2C*, 3C*—evaluation of the viability of the native microbiota (non-inoculated, unpasteurized). The data (log CFU ml−1) are presented as mean values with the standard error of the mean. Statistically significant differences are marked in color, depending on the degree of significance: green: p < 0.001, violet: p < 0.05. Non-significant differences (p > 0.05) are not marked. XSamples not-processed.
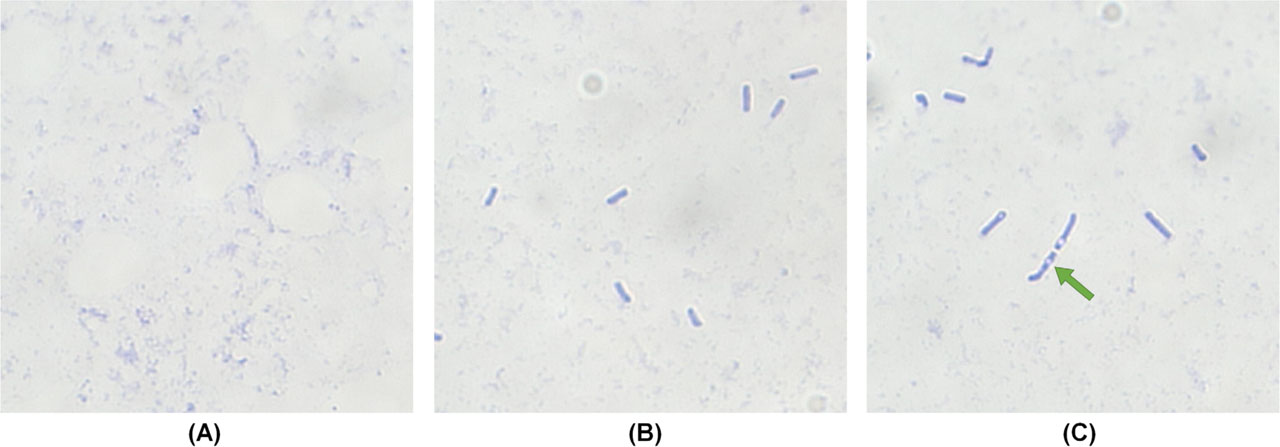
Figure 3.
Gram stain of Bacillus cereus viewed by light microscopy
Microscopic images of human milk before inoculation of Bacillus cereus (A), vegetative cells in Bacillus cereus culture (B), and pasteurized milk inoculated with Bacillus cereus (C); ×1.000 magnification, oil immersion
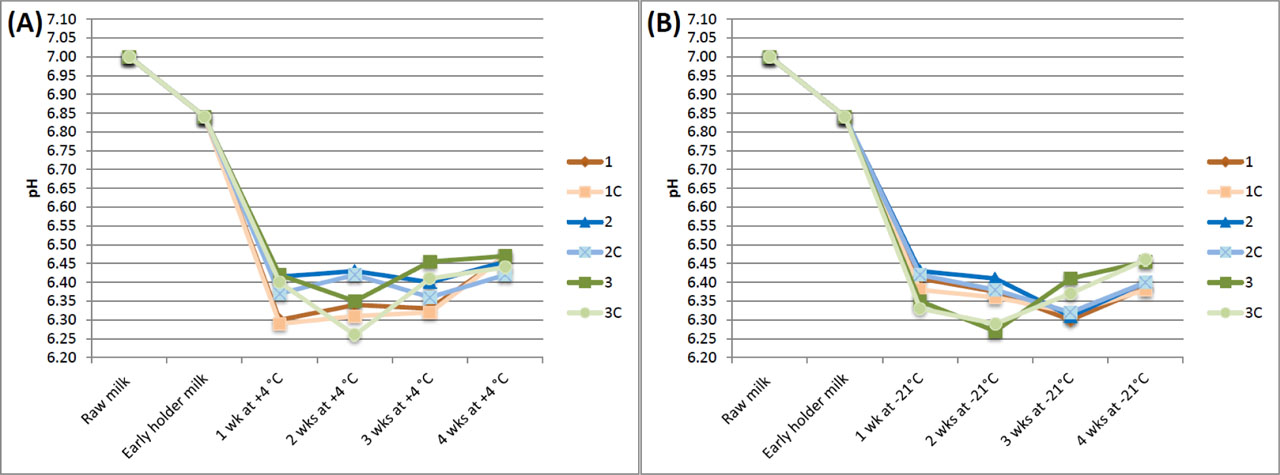
Figure 4.
The pH level analysis of the inoculated human milk
Milk storage at 4 °C after final holder (A), Milk storage at −21 °C after final holder (B). Mean values of 3 readings. 1, 2, 3—testing samples (inoculated, pasteurized samples); 1C, 2C, 3C—control of bacterial viability (inoculated, unpasteurized samples)
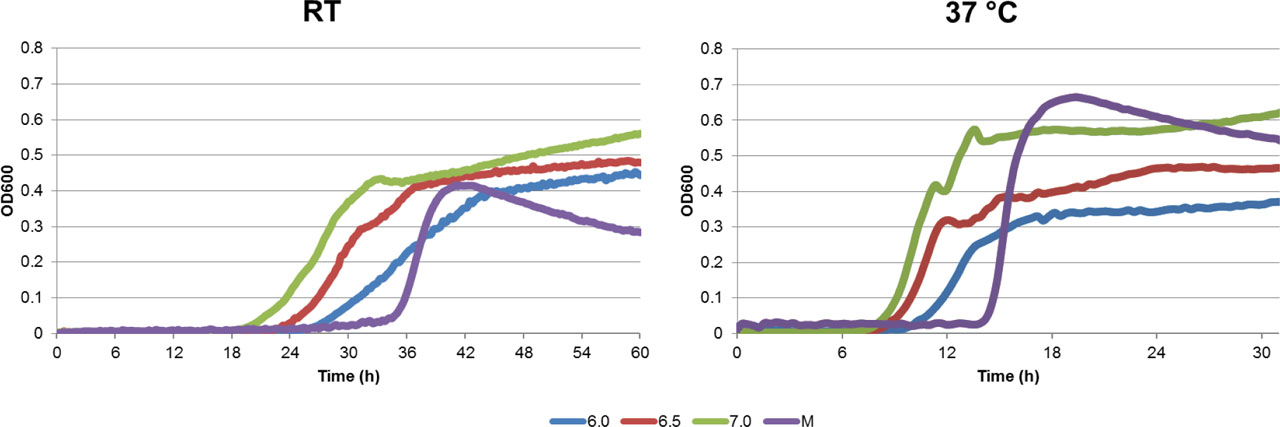
Figure 5.
Bacillus cereus growth curves on BHI broth cultures and in donor milk samples
Mean values of 3 analyses. BHI—brain heart infusion medium; RT—room temperature; 6.0—BHI 6.0 pH, inoculated; 6.5—BHI pH 6.5, inoculated; 7.0—BHI pH 7.0, inoculated; M—inoculated human milk