
Table 1
Characteristics of the study group
| n Sex | 51 | ||
| female n (%) | 30 (58.8) | p = 0.08 | |
| male n (%) | 21 (41.2) | ||
| Age (years) | 52.6 ± 15.9 | ||
| female | 56.9 ± 14.2 | p = 0.02 | |
| male | 46.6 ± 16.5 | ||
| Severity of IBS n (%) | mild | 4 (7.8) | p = 0.55 |
| moderate | 25 (49.0) | ||
| severe | 22 (43.2) | ||
| Type of IBS n (%) | diarrhea | 35 (68.6) | p < 0.05 |
| constipation | 16 (31.4) |
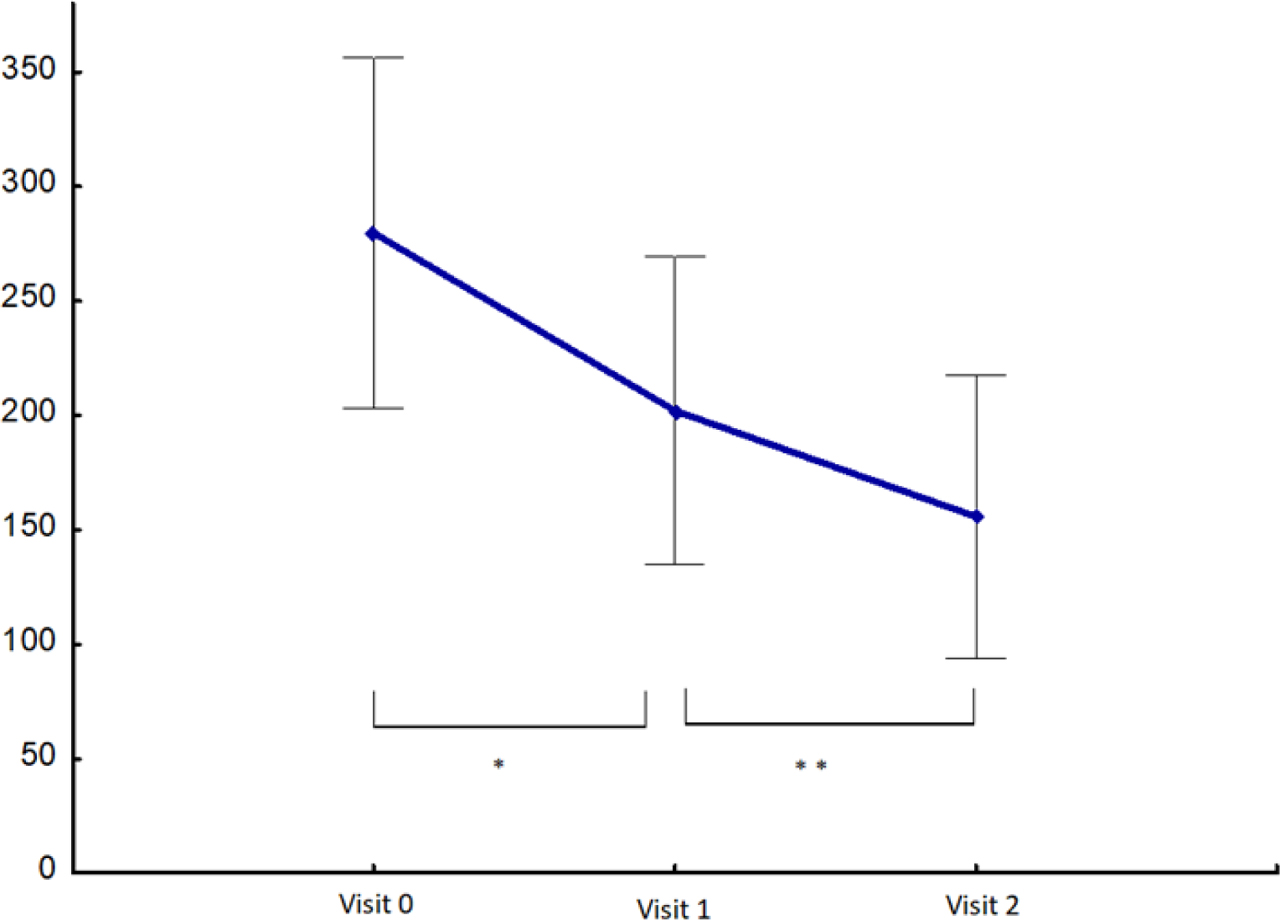
Fig. 1
Disease activity scores on the IBS-SSS scale at initiation of treatment (visit 0) and after 4 (visit 1) and 12 weeks (visit 2) of curcumin treatment (mean ± SD), * p < 0.05 compared to visit 0, ** p < 0.01 compared to visit 1
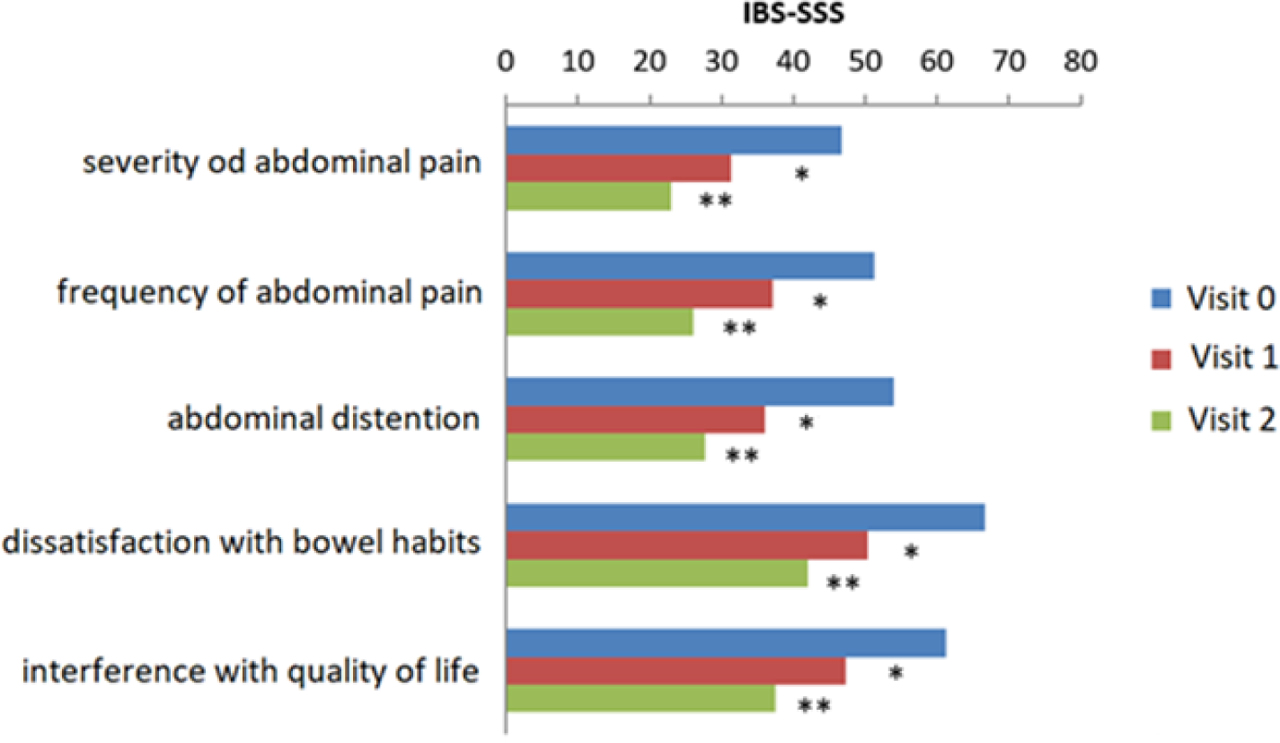
Fig. 2
Changes in individual categories of IBS-SSS from the start of treatment (visit 0), after 4 (visit 1), and 12 weeks (visit 2) of curcumin consumption * p < 0.05, compared to visit 0, ** p < 0,01, compared to visit 0
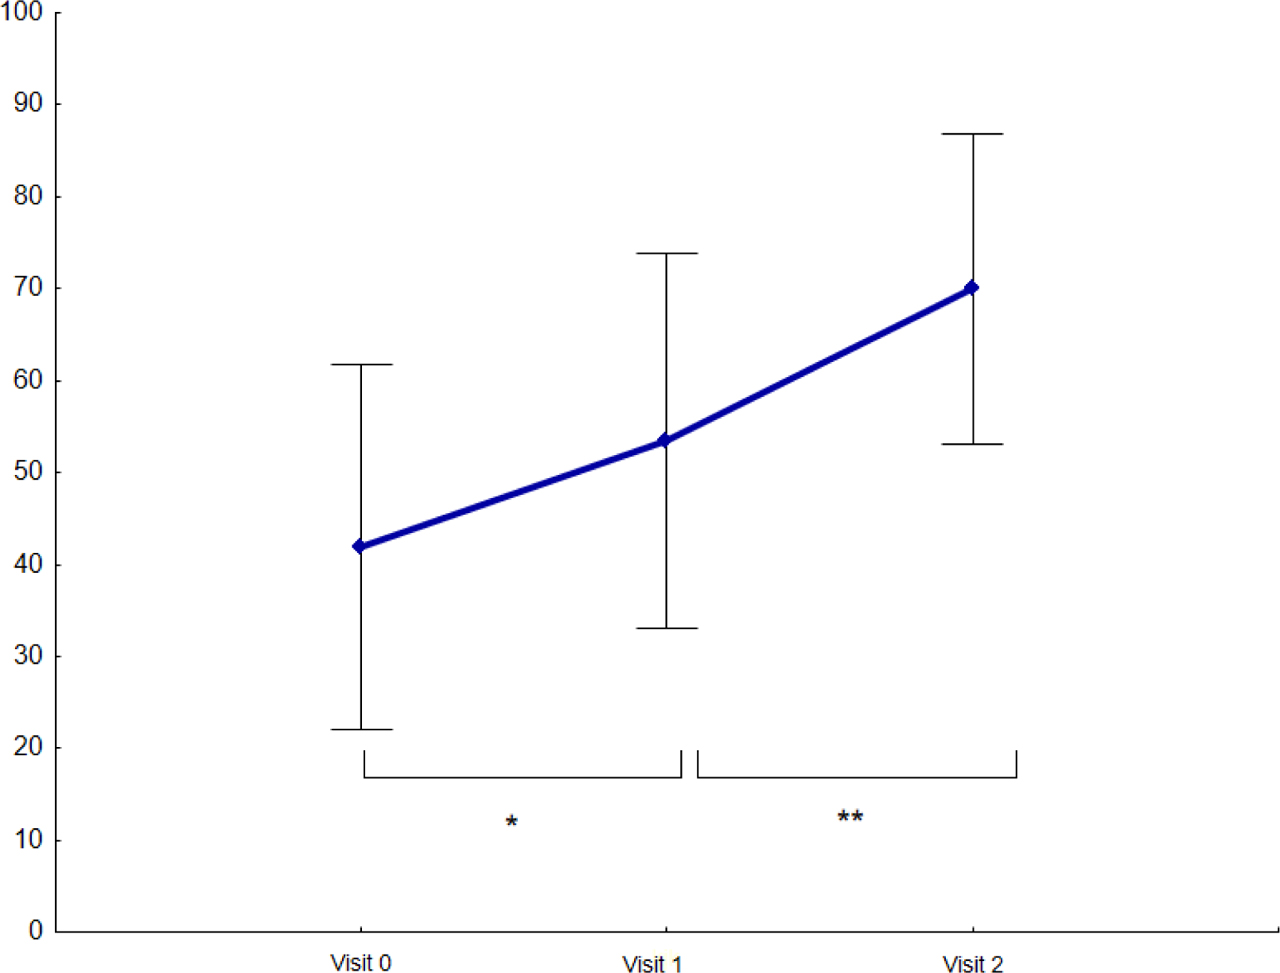
Fig. 3
Results of overall quality of life scale (IBS-QoL) at initiation of treatment (visit 0) and after 4 (visit 1) and 12 weeks (visit 2) of curcumin consumption (mean ± SD). * p < 0.05 compared to visit 0, ** p < 0.01 compared to visit 1
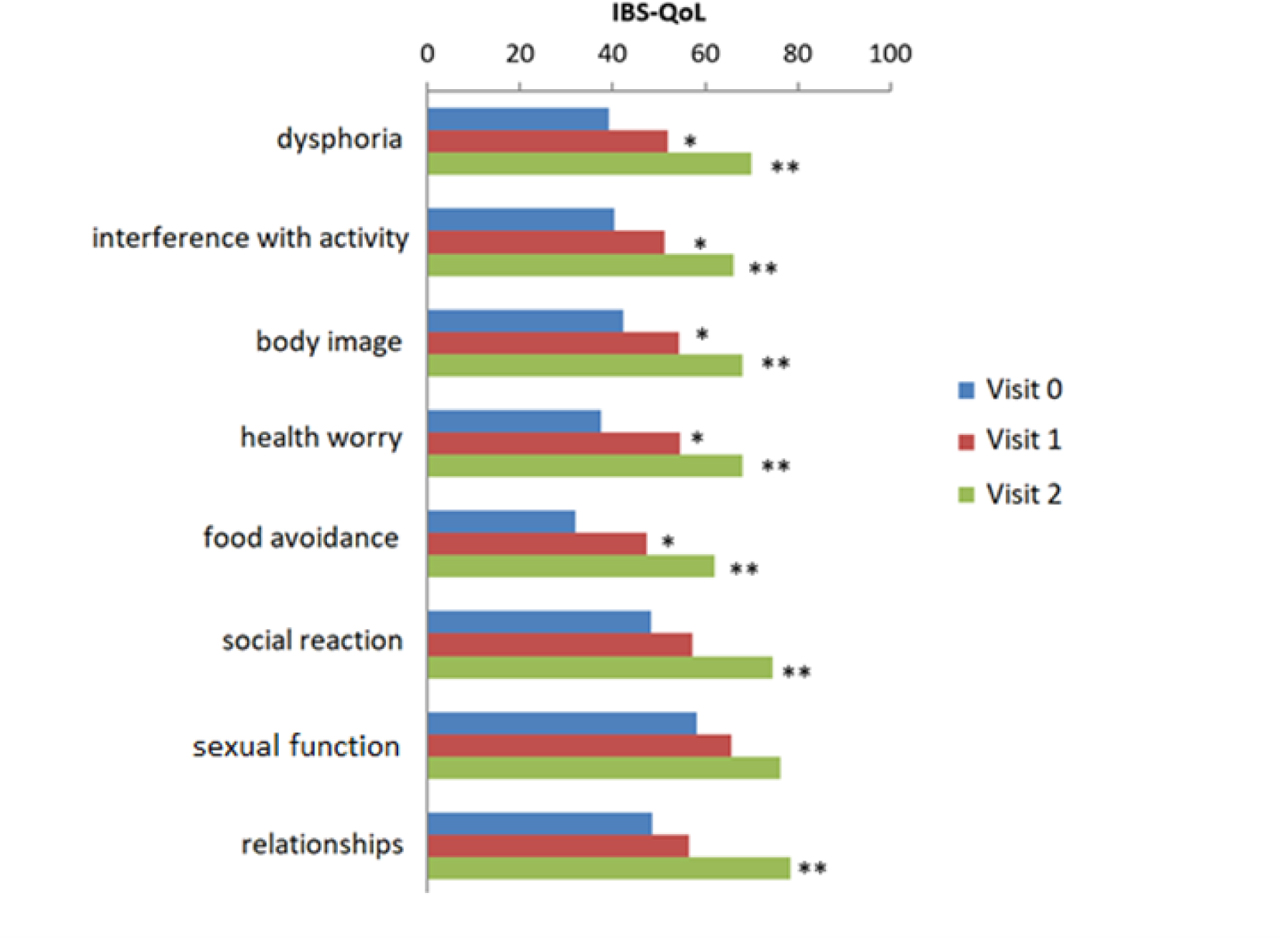
Fig. 4
Quality of life results in individual domains at the start of treatment (visit 0), after 4 (visit 1), and after 12 weeks (visit 2) of curcumin use. * p < 0.05, compared to visit 0, ** p < 0.05, compared to visit 0