
Table 1
Source of strains
| Source | Number of strains |
|---|---|
| Upper respiratory tract | 6 |
| Cervical canal | 4 |
| Vagina | 4 |
| Wound | 5 |
| Urine (> 106 cfu/mL) | 4 |
| Bedsore | 3 |
| Sperm | 1 |
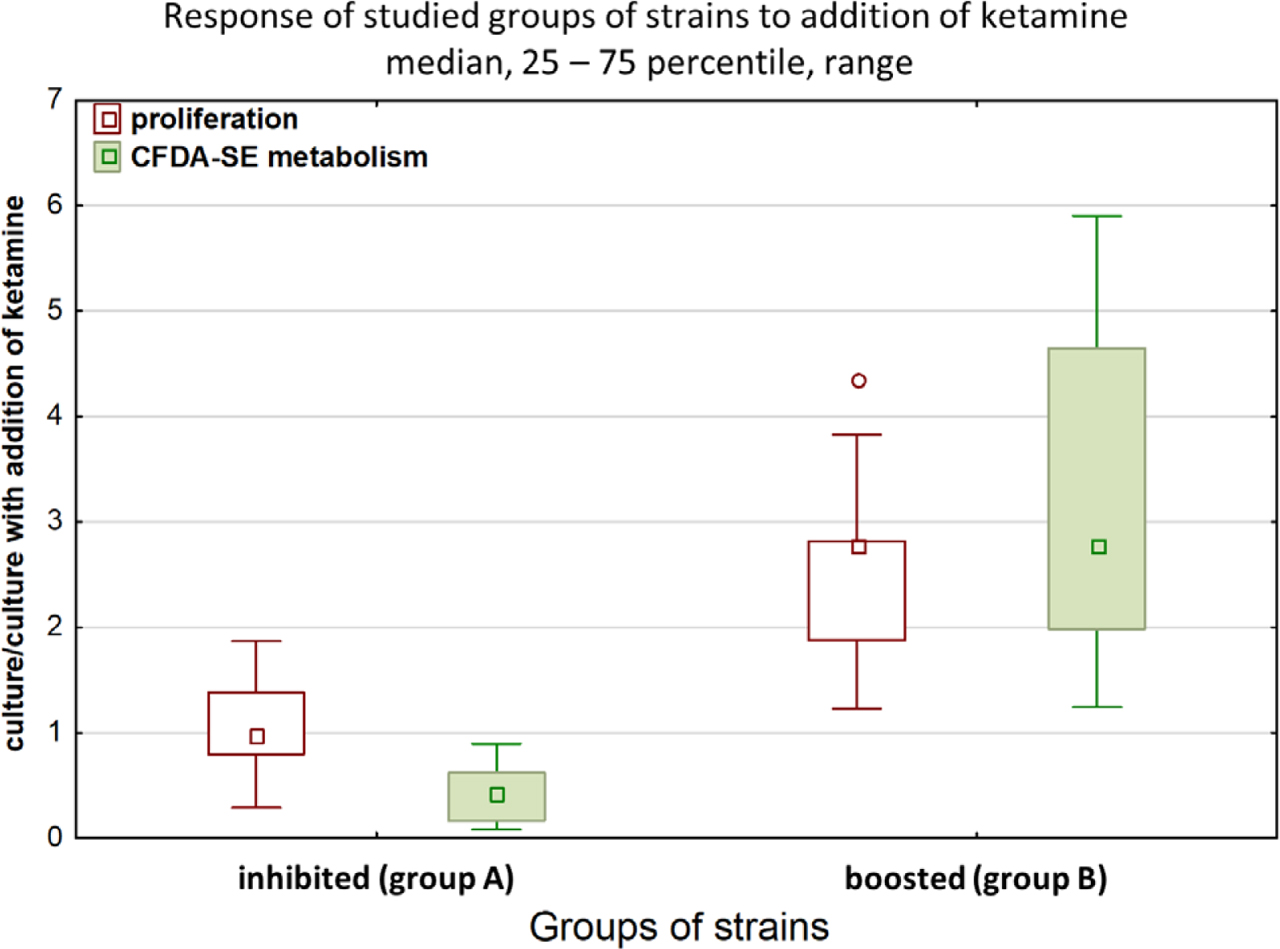
Fig. 1
Characteristics of two types of strains identified by response to ketamine
Table 2
Changes of relative values of protein peak after incubation of the enterococcal strains with ketamine. Group A+: strains increasing proliferation when cultured with ketamine; group B+ strains inhibited by ketamine; group A and B – strains cultured without ketamine. Grey bars: peaks typical for Enterococcus faecalis according to Stępień-Pyśniak D et al. [24]. Dark grey bars: the highest protein peak for all the measurements, considered as baseline for observed levels in other protein peaks (group A and B) and after the exposure to ketamine (group A+ and B+). Green color underlines the increase of peak value; the red color indicates decreased or missing peak when compared to strains not exposed to ketamine
| Reference | m/z | Group A | Group A + | Group B | Group B + |
|---|---|---|---|---|---|
| Stępień-Pyśniak D | 2211 | 67 | 88 | 0 | 25 |
| 2663 | 29 | 0 | 0 | 17 | |
| 3421 | 29 | 29 | 33 | 20 | |
| 3669 | 26 | 35 | 24 | 0 | |
| 4439 | 100 | 100 | 100 | 100 | |
| 4778 | 28 | 37 | 22 | 17 | |
| 5361 | 53 | 40 | 38 | 62 | |
| 6084 | 14 | 16 | 15 | 10 | |
| 6231 | 14 | 15 | 18 | 0 | |
| 6403 | 25 | 24 | 31 | 26 | |
| 6839 | 31 | 32 | 40 | 38 | |
| 7326 | 42 | 59 | 42 | 13 | |
| 7572 | 23 | 0 | 23 | 19 | |
| 8911 | 12 | 15 | 21 | 12 | |
| 9544 | 27 | 35 | 23 | 26 |
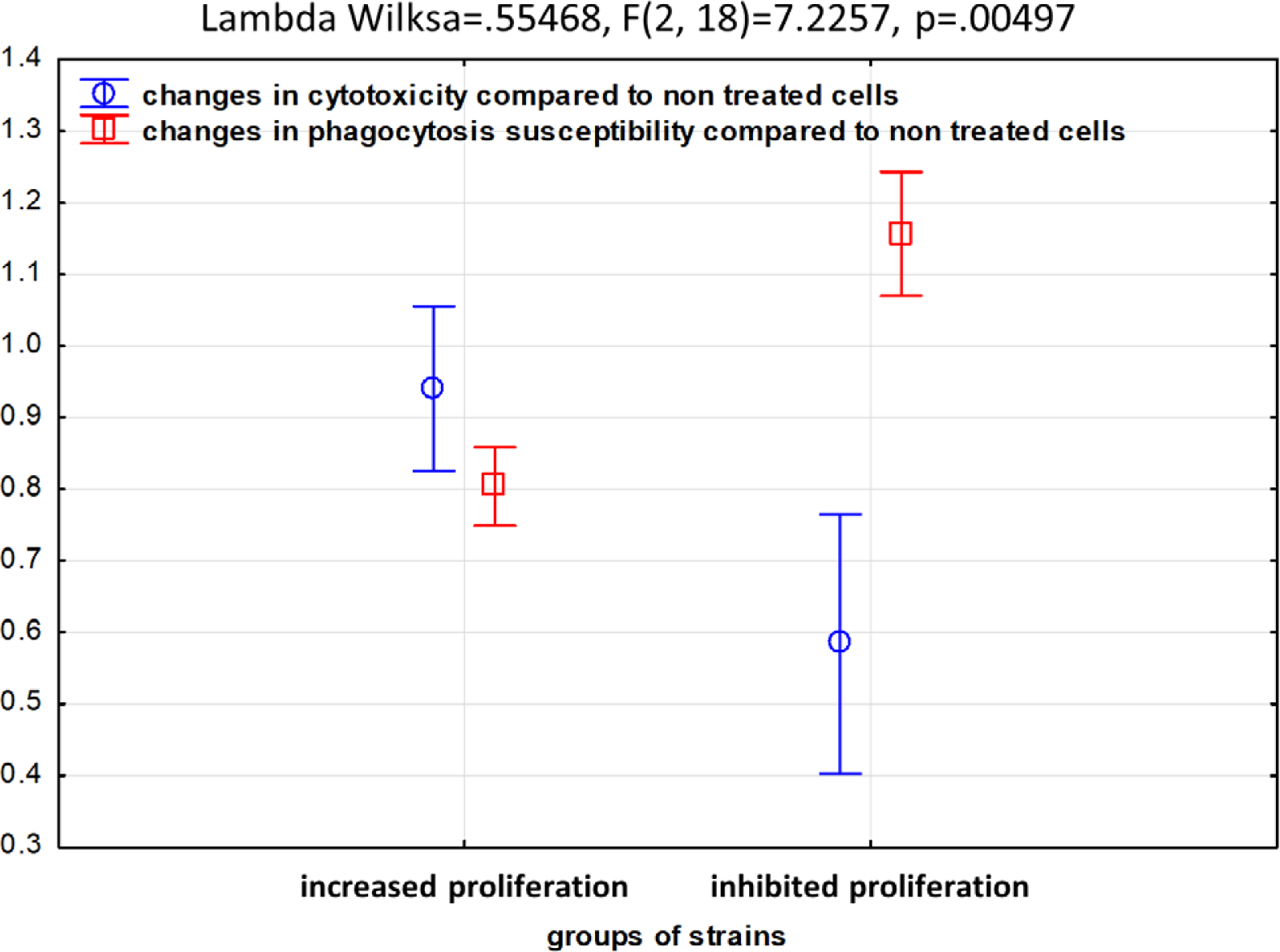
Fig. 2
Changes in cytotoxicity and phagocytosis in two groups of Enterococcus faecalis strains. The value 1.00 means no changes when compared with bacteria not treated with ketamine