
Fig. 1
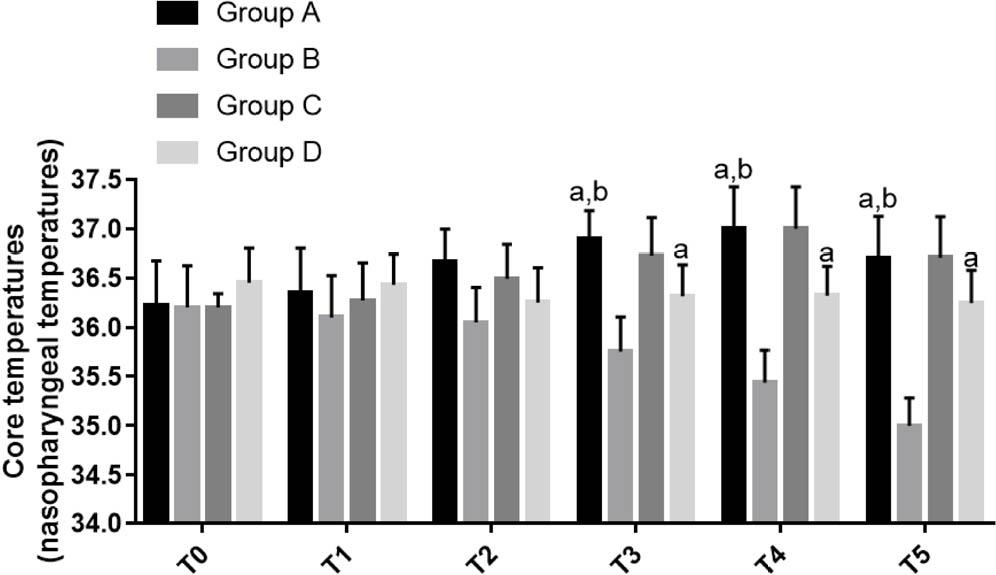
Fig. 2
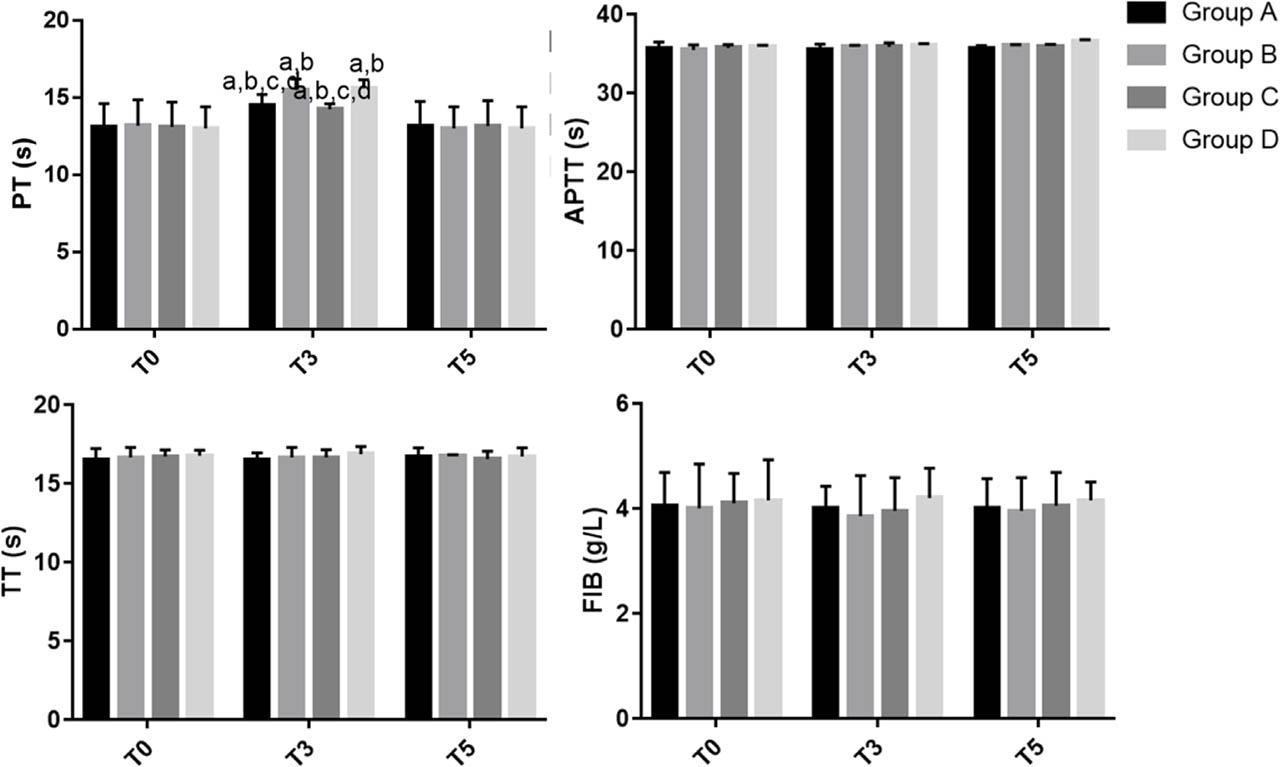
Fig. 3
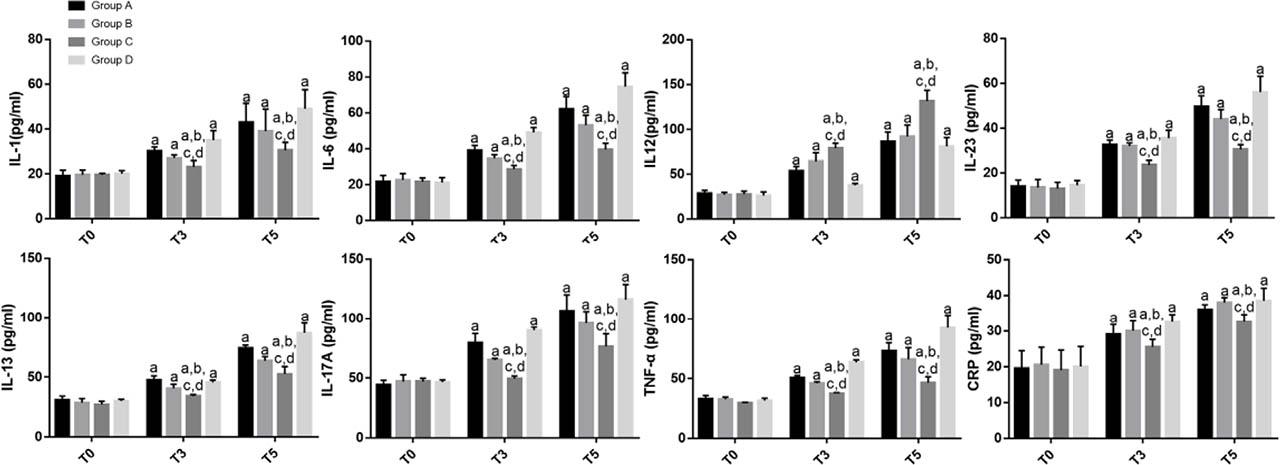
Fig. 4
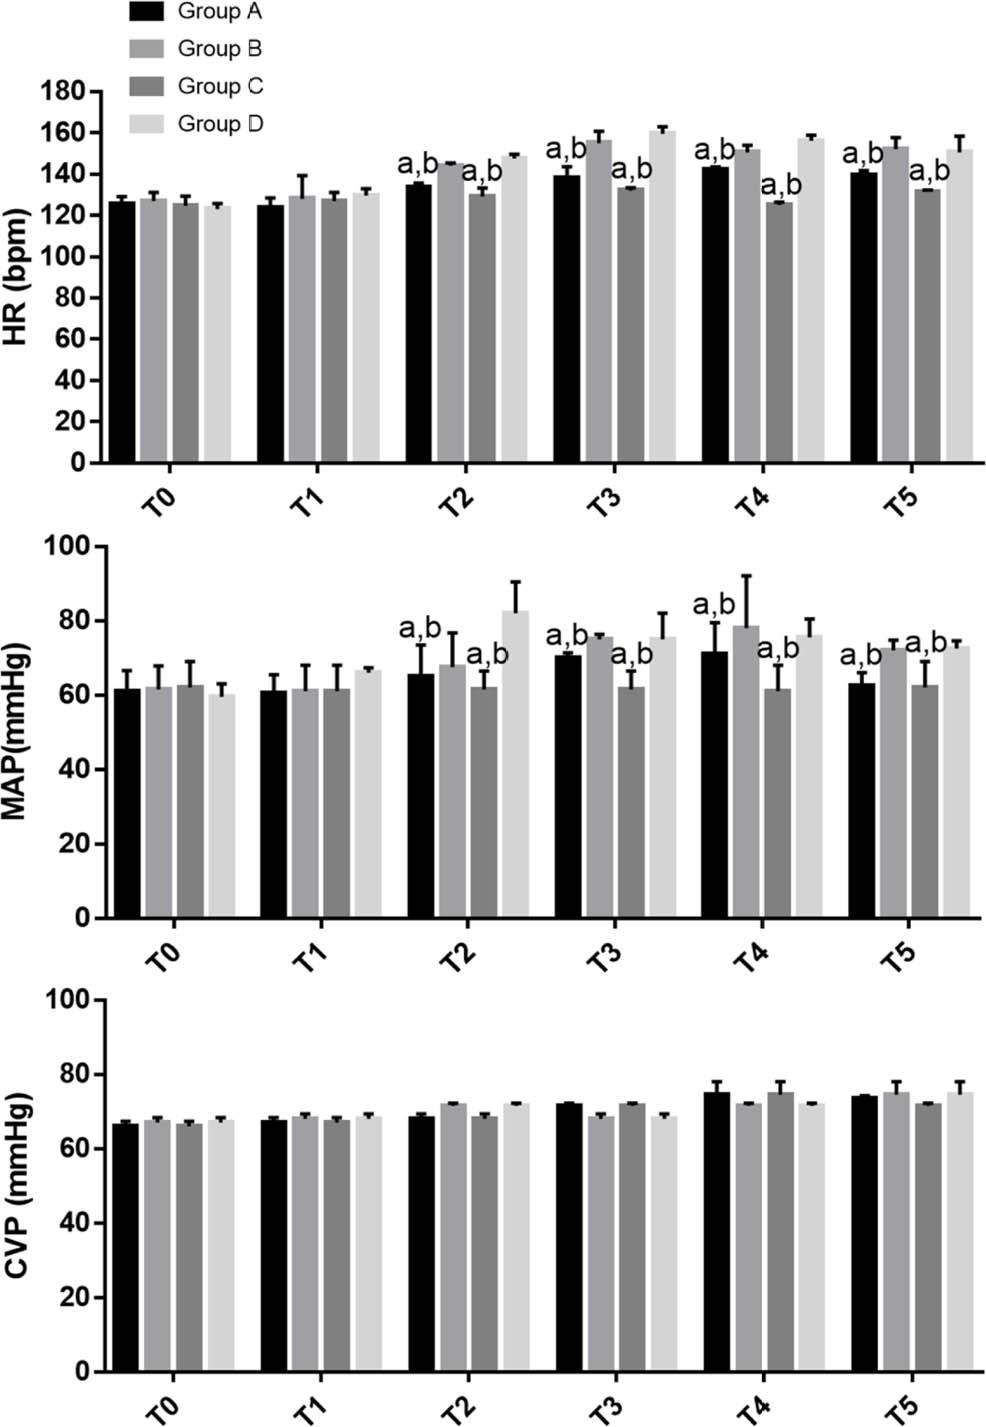
Fig. 5
Anesthesia waking time and extubation time
| Group | Anesthesia waking time (min) | Extubation time (min) |
|---|---|---|
| A (n=33) | 17.23±1.74ab | 22.41±1.97ab |
| B (n=33) | 22.67±2.23c | 28.63±2.29c |
| C (n=33) | 14.61±3.51b | 19.84±3.62c |
| D (n=33) | 28.07±2.57 | 33.32±3.02 |
General data of patients with colorectal cancer in the four groups
| Group | Age (Y) | Gender (M/F) | Basal body temperature (°C) | ASA grade (I/II) | TNM stage (II/III/IV) |
|---|---|---|---|---|---|
| A (n=33) | 59.61±3.23 | 18/15 | 36.21±0.36 | 14/19 | 8/16/9 |
| B (n=33) | 57.81±3.64 | 17/16 | 36.54±0.35 | 15/18 | 7/15/11 |
| C (n=33) | 60.07±3.21 | 17/16 | 36.37±0.34 | 16/17 | 8/17/8 |
| D (n=33) | 58.52±3.14 | 16/17 | 36.07±0.28 | 15/18 | 9/12/12 |
| t/χ2 | 0.215 | 0.204 | 0.224 | 0.227 | 0.218 |
| P | 0.121 | 0.132 | 0.116 | 0.112 | 0.119 |
Perioperative indicators in the four groups
| Group | Operation time (min) | Anesthesia duration (min) | Intraoperative blood loss (mL) | Intraoperative infusion volume (mL) | Urine volume (mL) | Abdominal flushing volume (mL) |
|---|---|---|---|---|---|---|
| A (n=33) | 180.3±54.5 | 203.4±41.3 | 51.23±14.35 | 205.6±31.4 | 755±289 | 1230±234 |
| B (n=33) | 183.8±50.8 | 205.6±42.5 | 53.80±13.89 | 209.8±35.6 | 734±211 | 1338±239 |
| C (n=33) | 182.6±46.7 | 202.9±48.9 | 52.77±15.00 | 203.4±28.9 | 769±234 | 1340±278 |
| D (n=33) | 181.9±53.2 | 204.8±48.7 | 52.09±14.35 | 205.4±23.1 | 750±287 | 1389±290 |
| t/x2 | 0.338 | 0.285 | 0.370 | 0.458 | 0.799 | 0.189 |
| P | 0.103 | 0.112 | 0.096 | 0.120 | 0.198 | 0.811 |
Intervention frequency
| Group | Intervention frequency (min) |
|---|---|
| A (n=33) | 2.69±0.21ab |
| B (n=33) | 2.15±0.19c |
| C (n=33) | 1.03±0.11b |
| D (n=33) | 3.27±0.26 |
Postoperative BIS values
| Group | BIS at propofol discontinuation | Time from propofol discontinuation to BIS ≥ 80 (min) | Propofol effect compartment concentration at BIS ≥ 80 (mg/L) |
|---|---|---|---|
| A (n=33) | 55.39±5.17 | 26.23±2.16ab | 1.03±0.23ab |
| B (n=33) | 54.76±5.12 | 22.16±2.11c | 0.81±0.21c |
| C (n=33) | 53.87±5.21 | 15.97±1.47c | 1.32±0.29c |
| D (n=33) | 54.26±5.23 | 30.51±3.01 | 0.69±0.07 |