
Fig. 1
Fig. 2
Fig. 3
Fig. 4
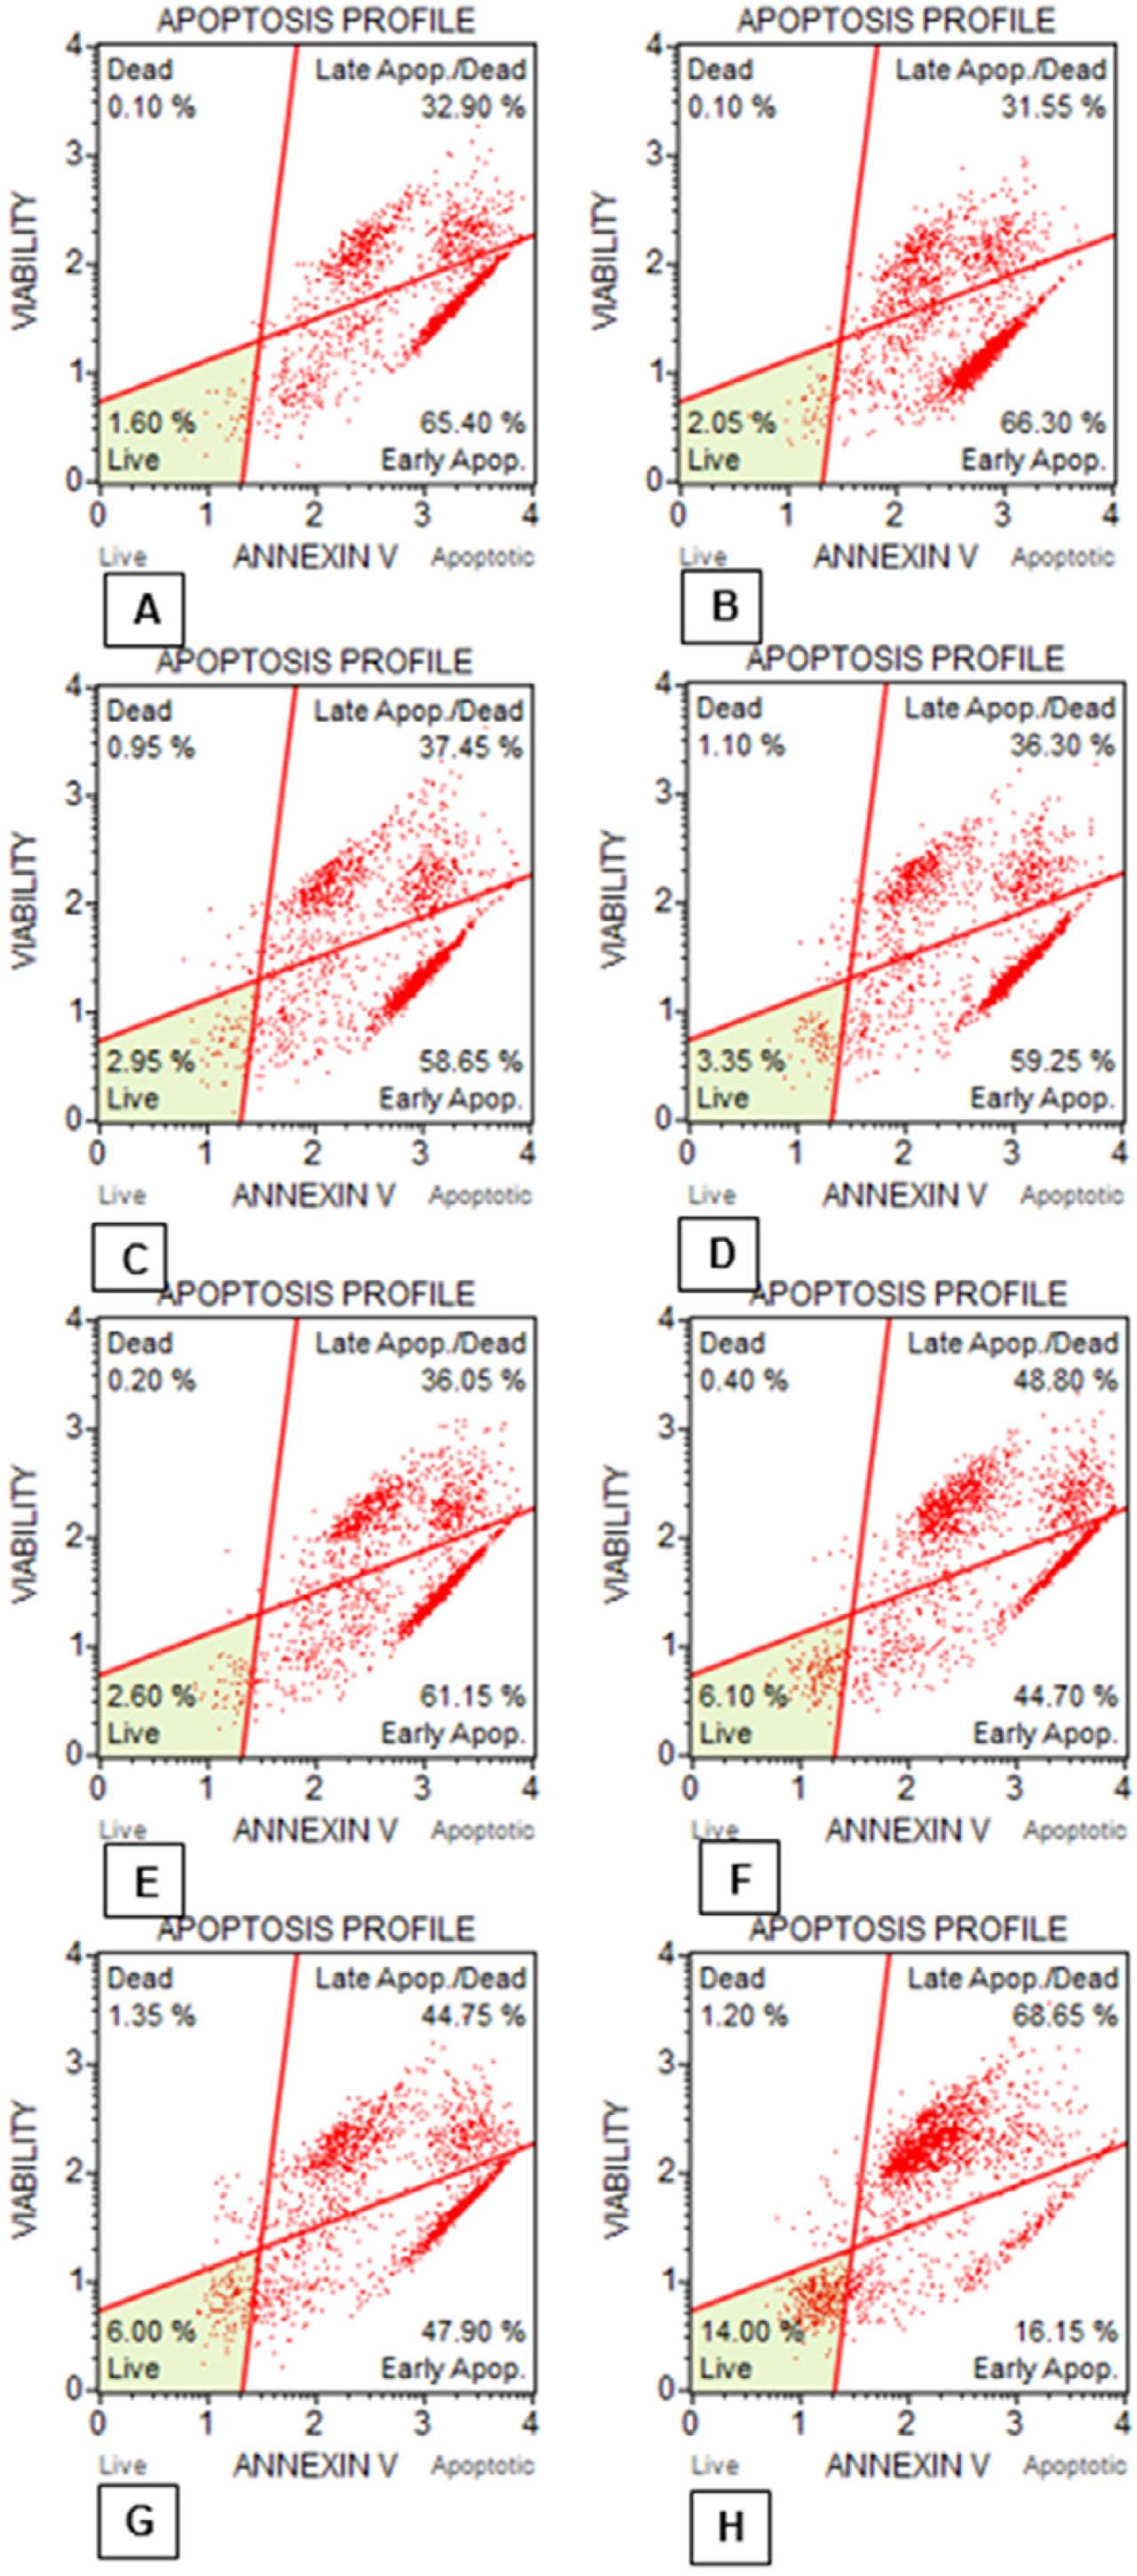
Fig. 5
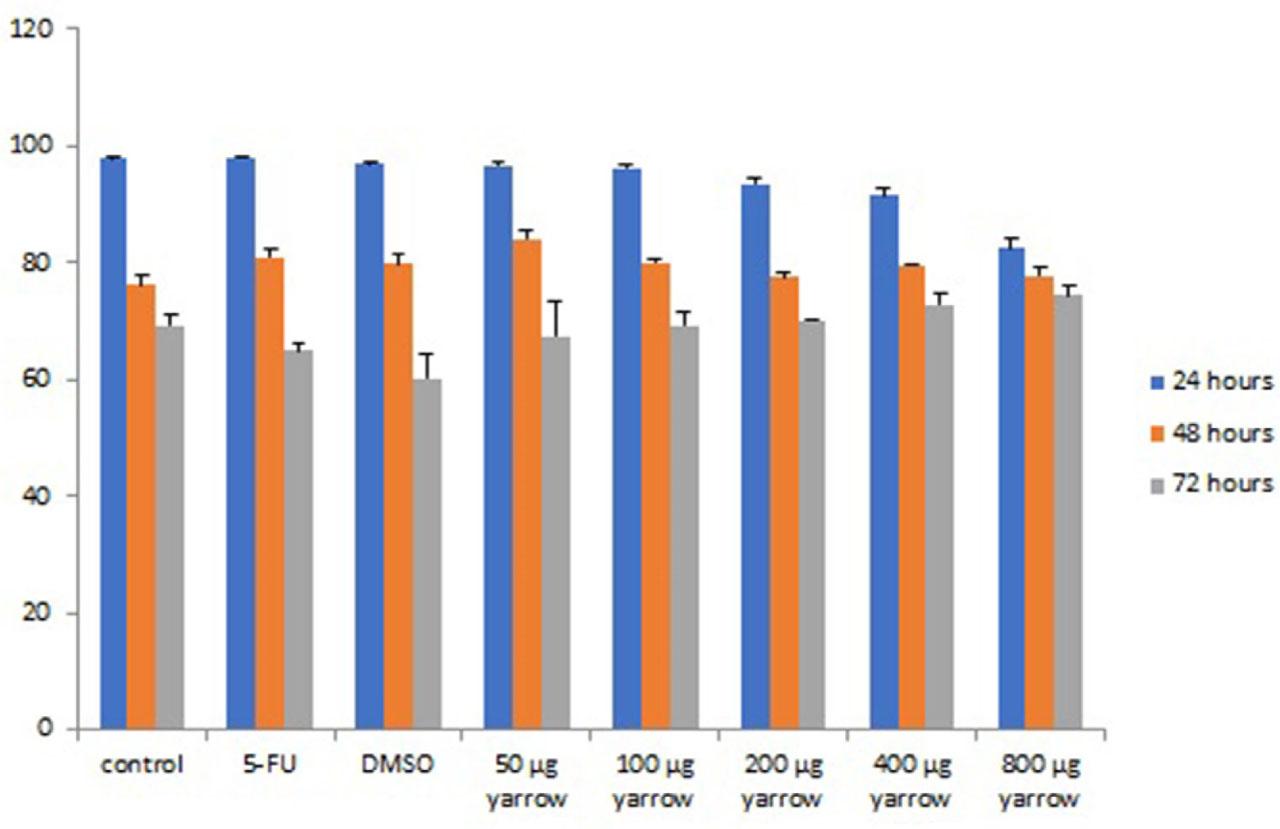
Fig. 6
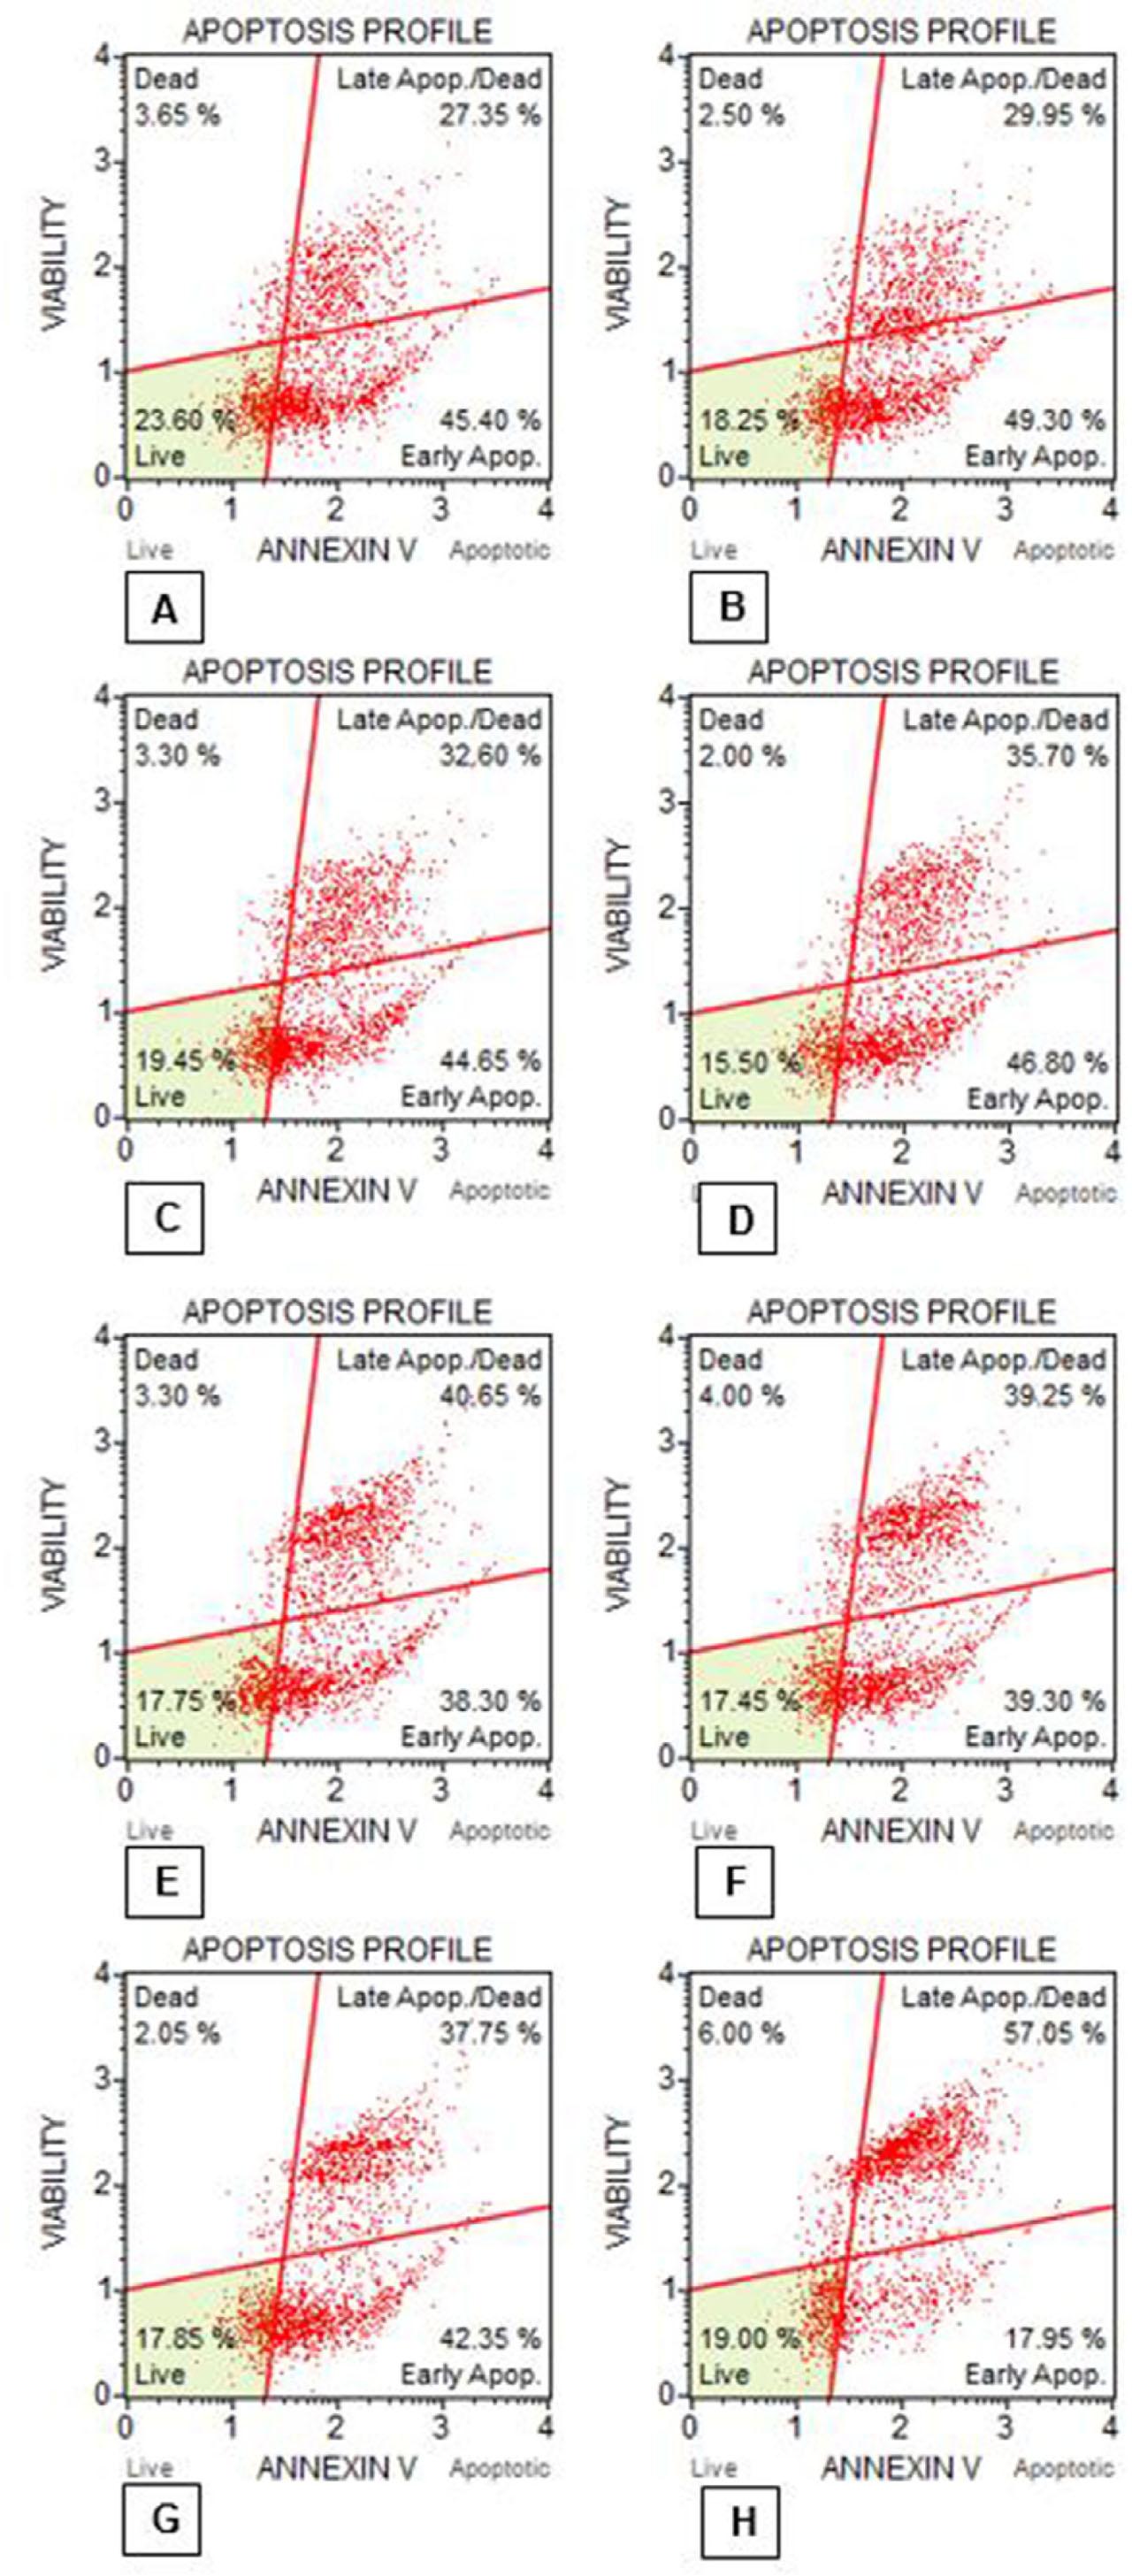
Fig. 7
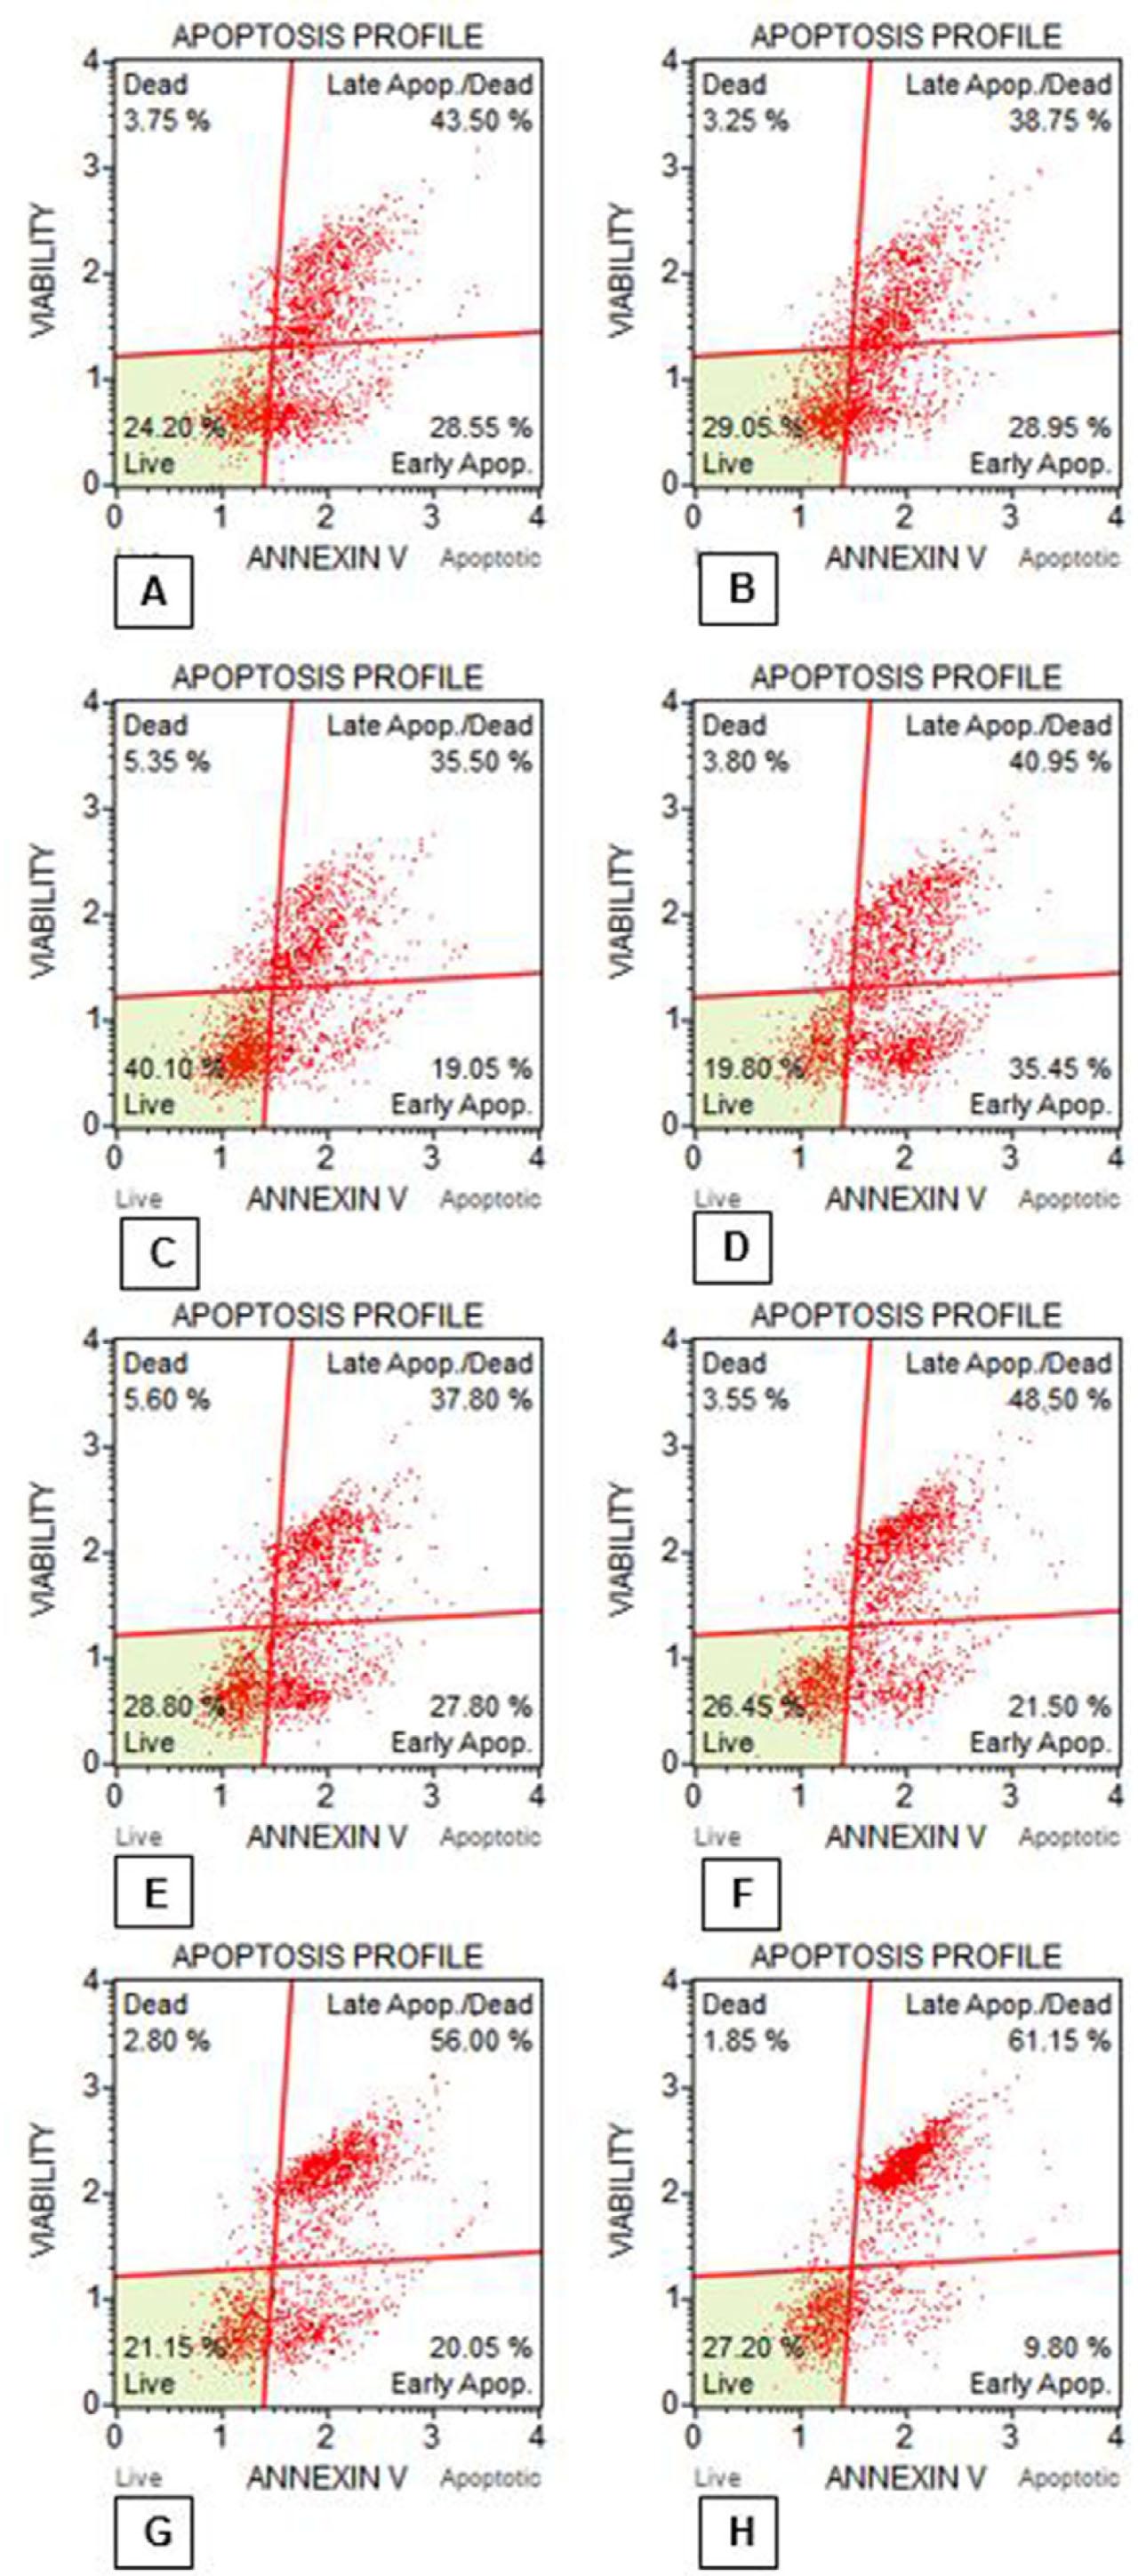
Fig. 8
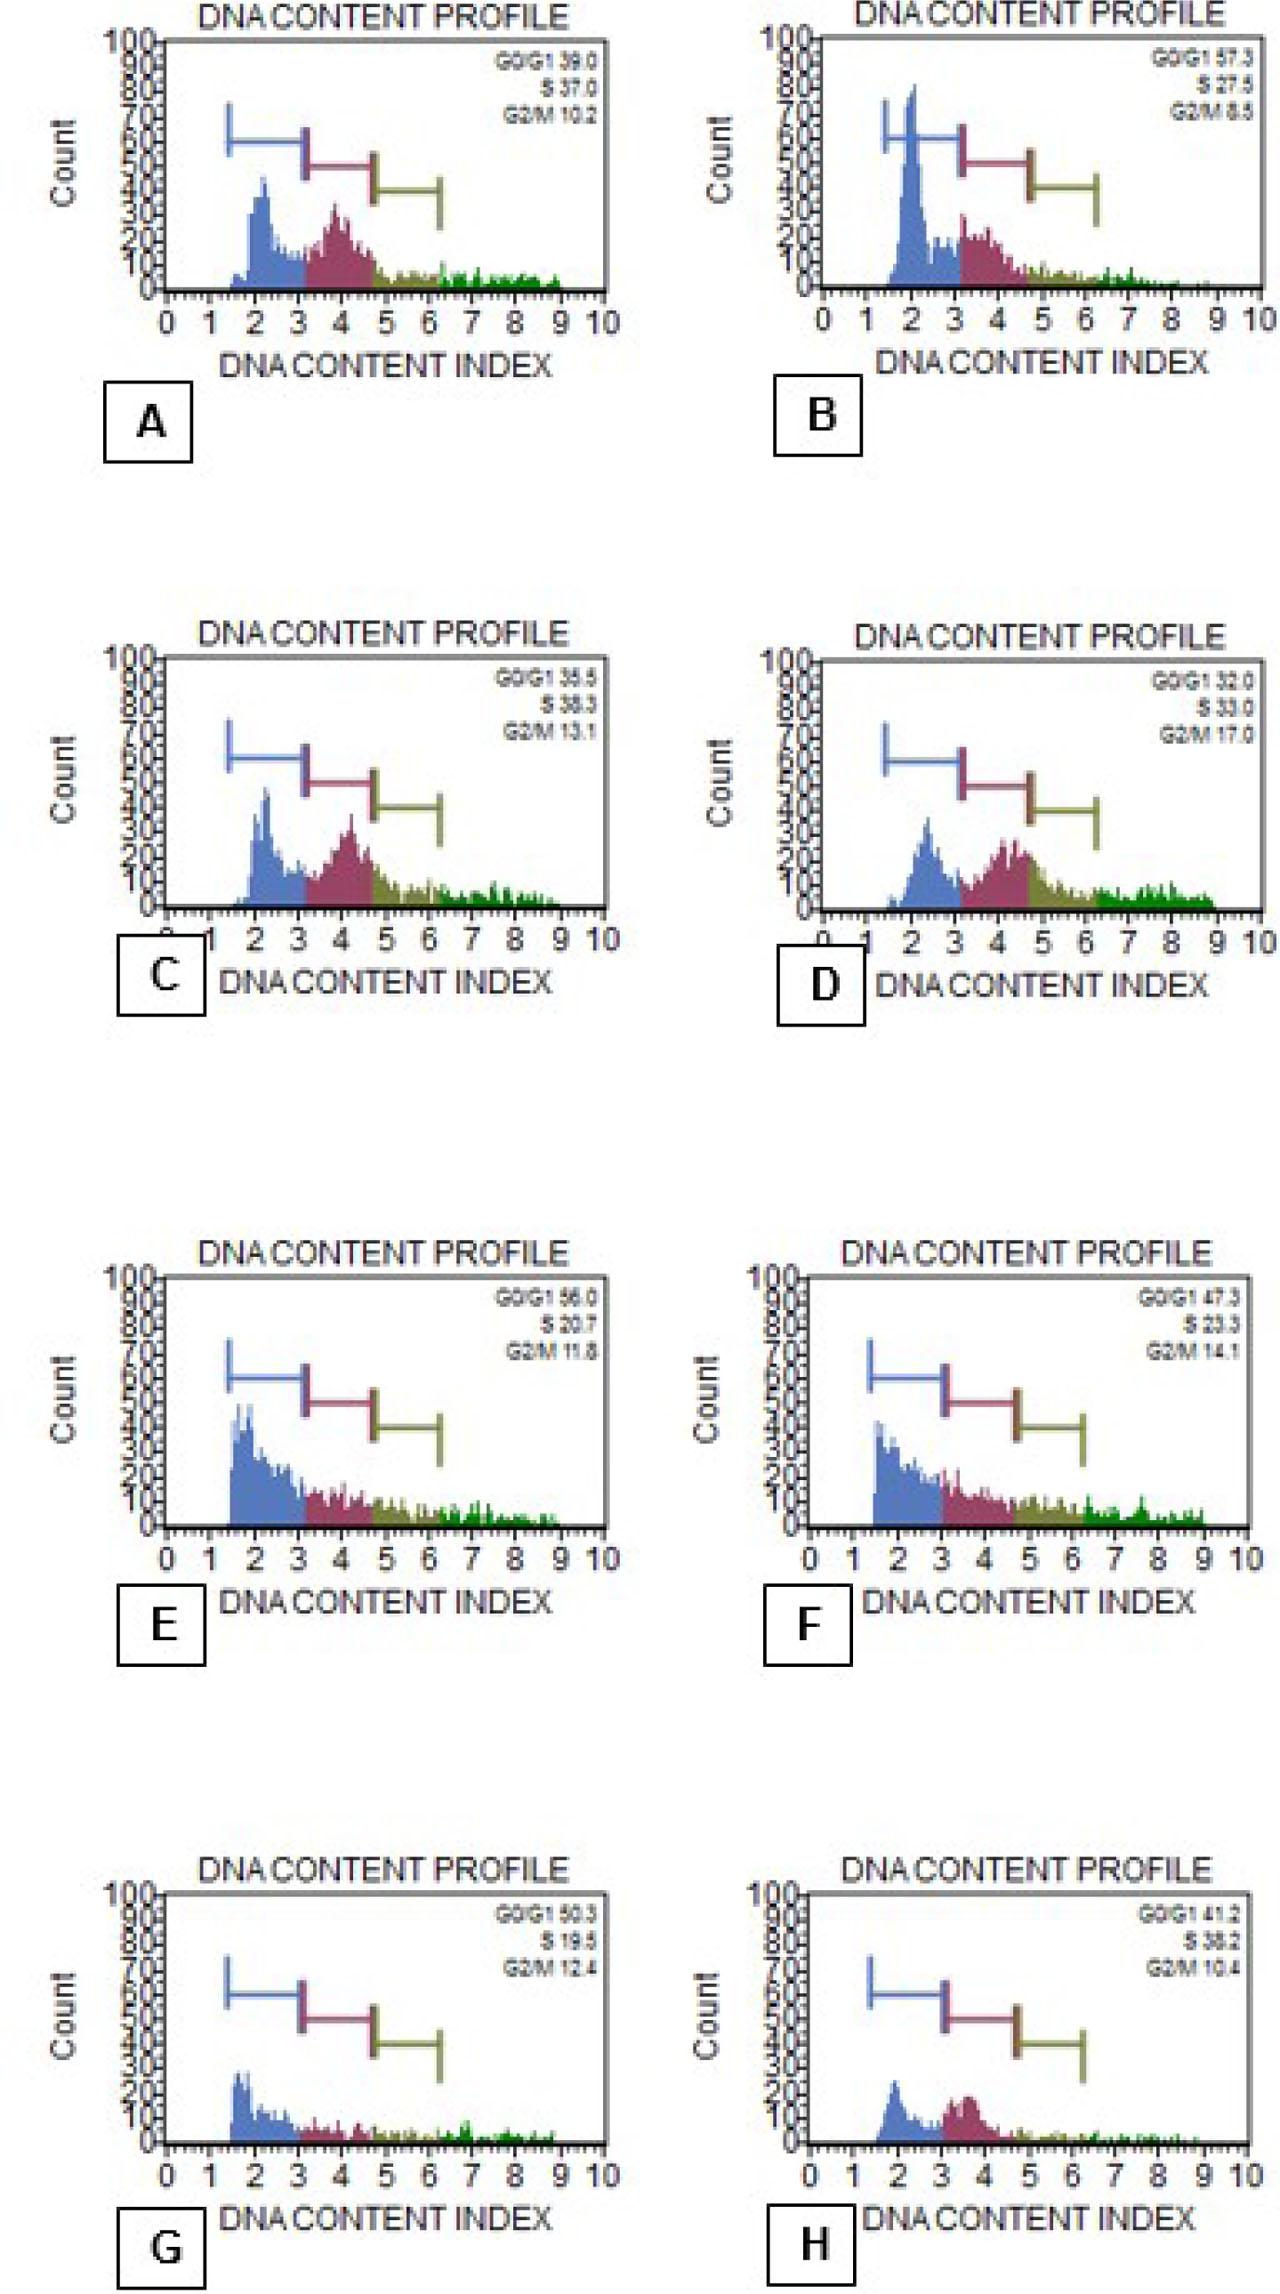
Fig. 9
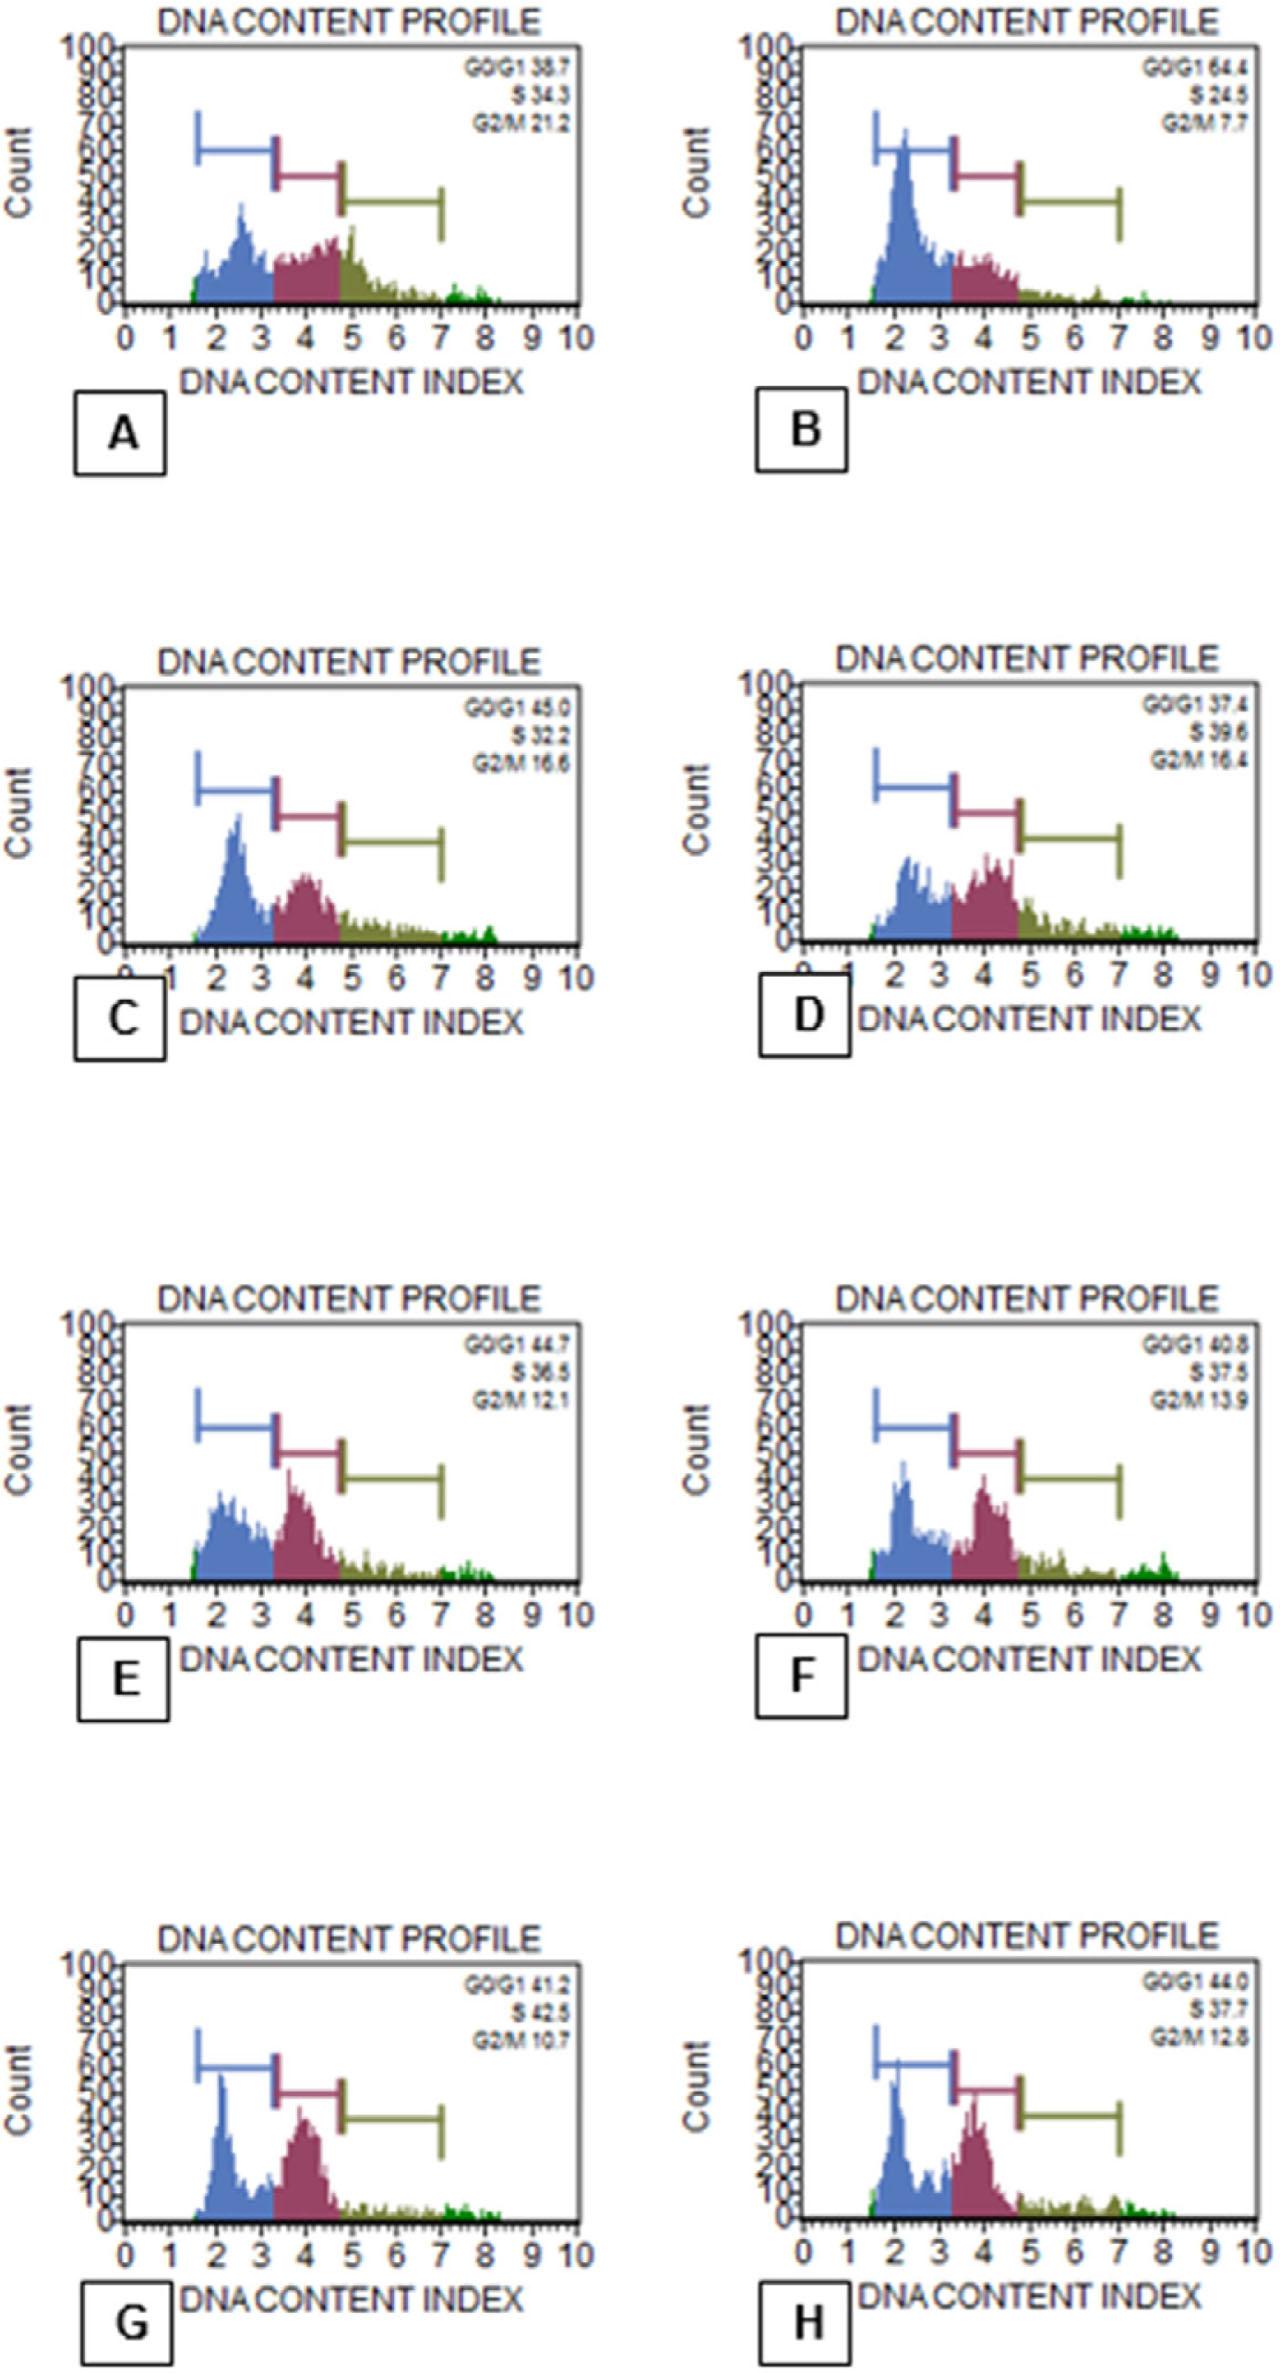
Fig. 10
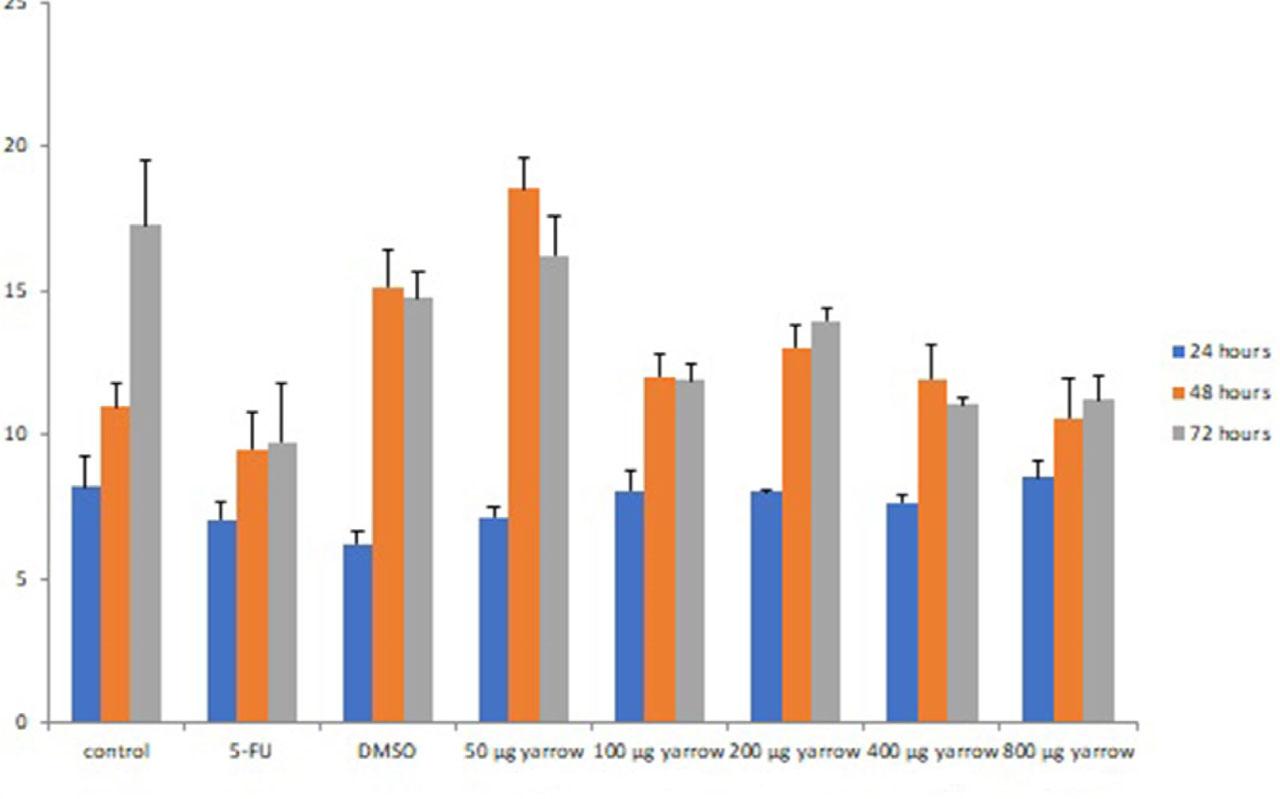
Fig. 11
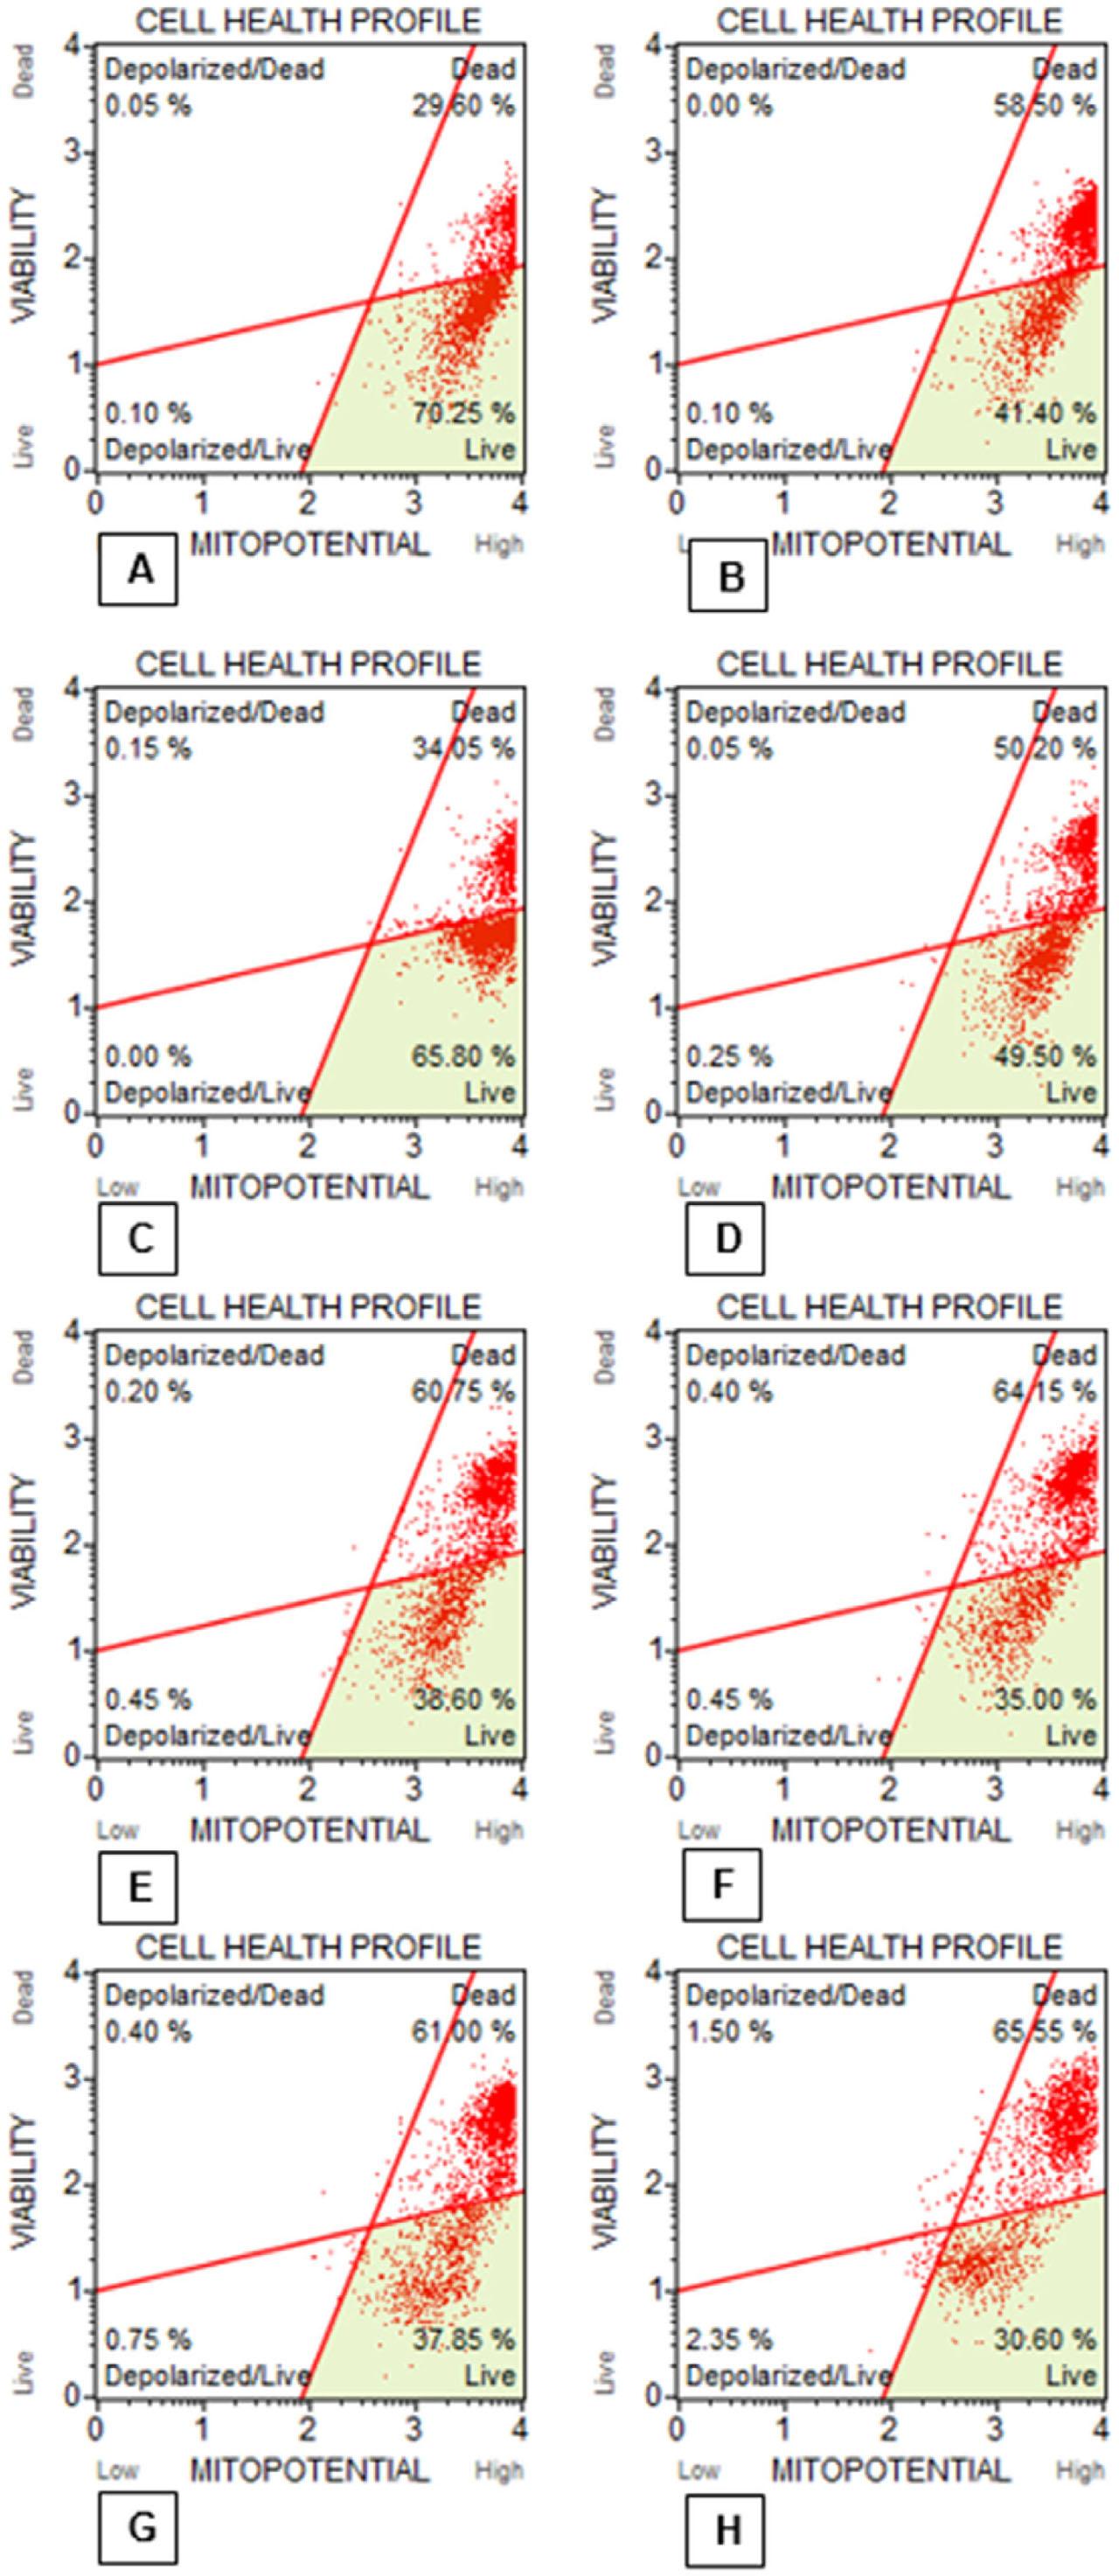
Fig. 12
Expression of late apoptosis values according to groups and time
| Late apoptosis | Incubation times | ||
|---|---|---|---|
| Groups | 24 hours | 48 hours | 72 hours |
| Control | 32.40±0.44ab | 30.46±2.71ab | 36.41±6.22a |
| 5 FU | 30.46±1.50a | 27.5±2.32a | 37.13±1.53a |
| DMSO | 33.48±2.17ab | 38.61±6.46abc | 37.48±1.72a |
| 50 μg/mL | 35.76±1.54ab | 35.00±2.08ab | 37.86±5.73a |
| 100 μg/mL | 35.80±0.66ab | 35.86±4.75ab | 40.95±2.95a |
| 200 μg/mL | 44.50±4.18b | 42.26±2.78bc | 52.66±3.90b |
| 400 μg/mL | 42.40±2.06ab | 38.91±1.25abc | 55.33±3.44b |
| 800 μg/mL | 60.76±11.27c | 50.20±7.34c | 59.88±1.58b |
| p value between groups | <0.001 | <0.001 | <0.001 |
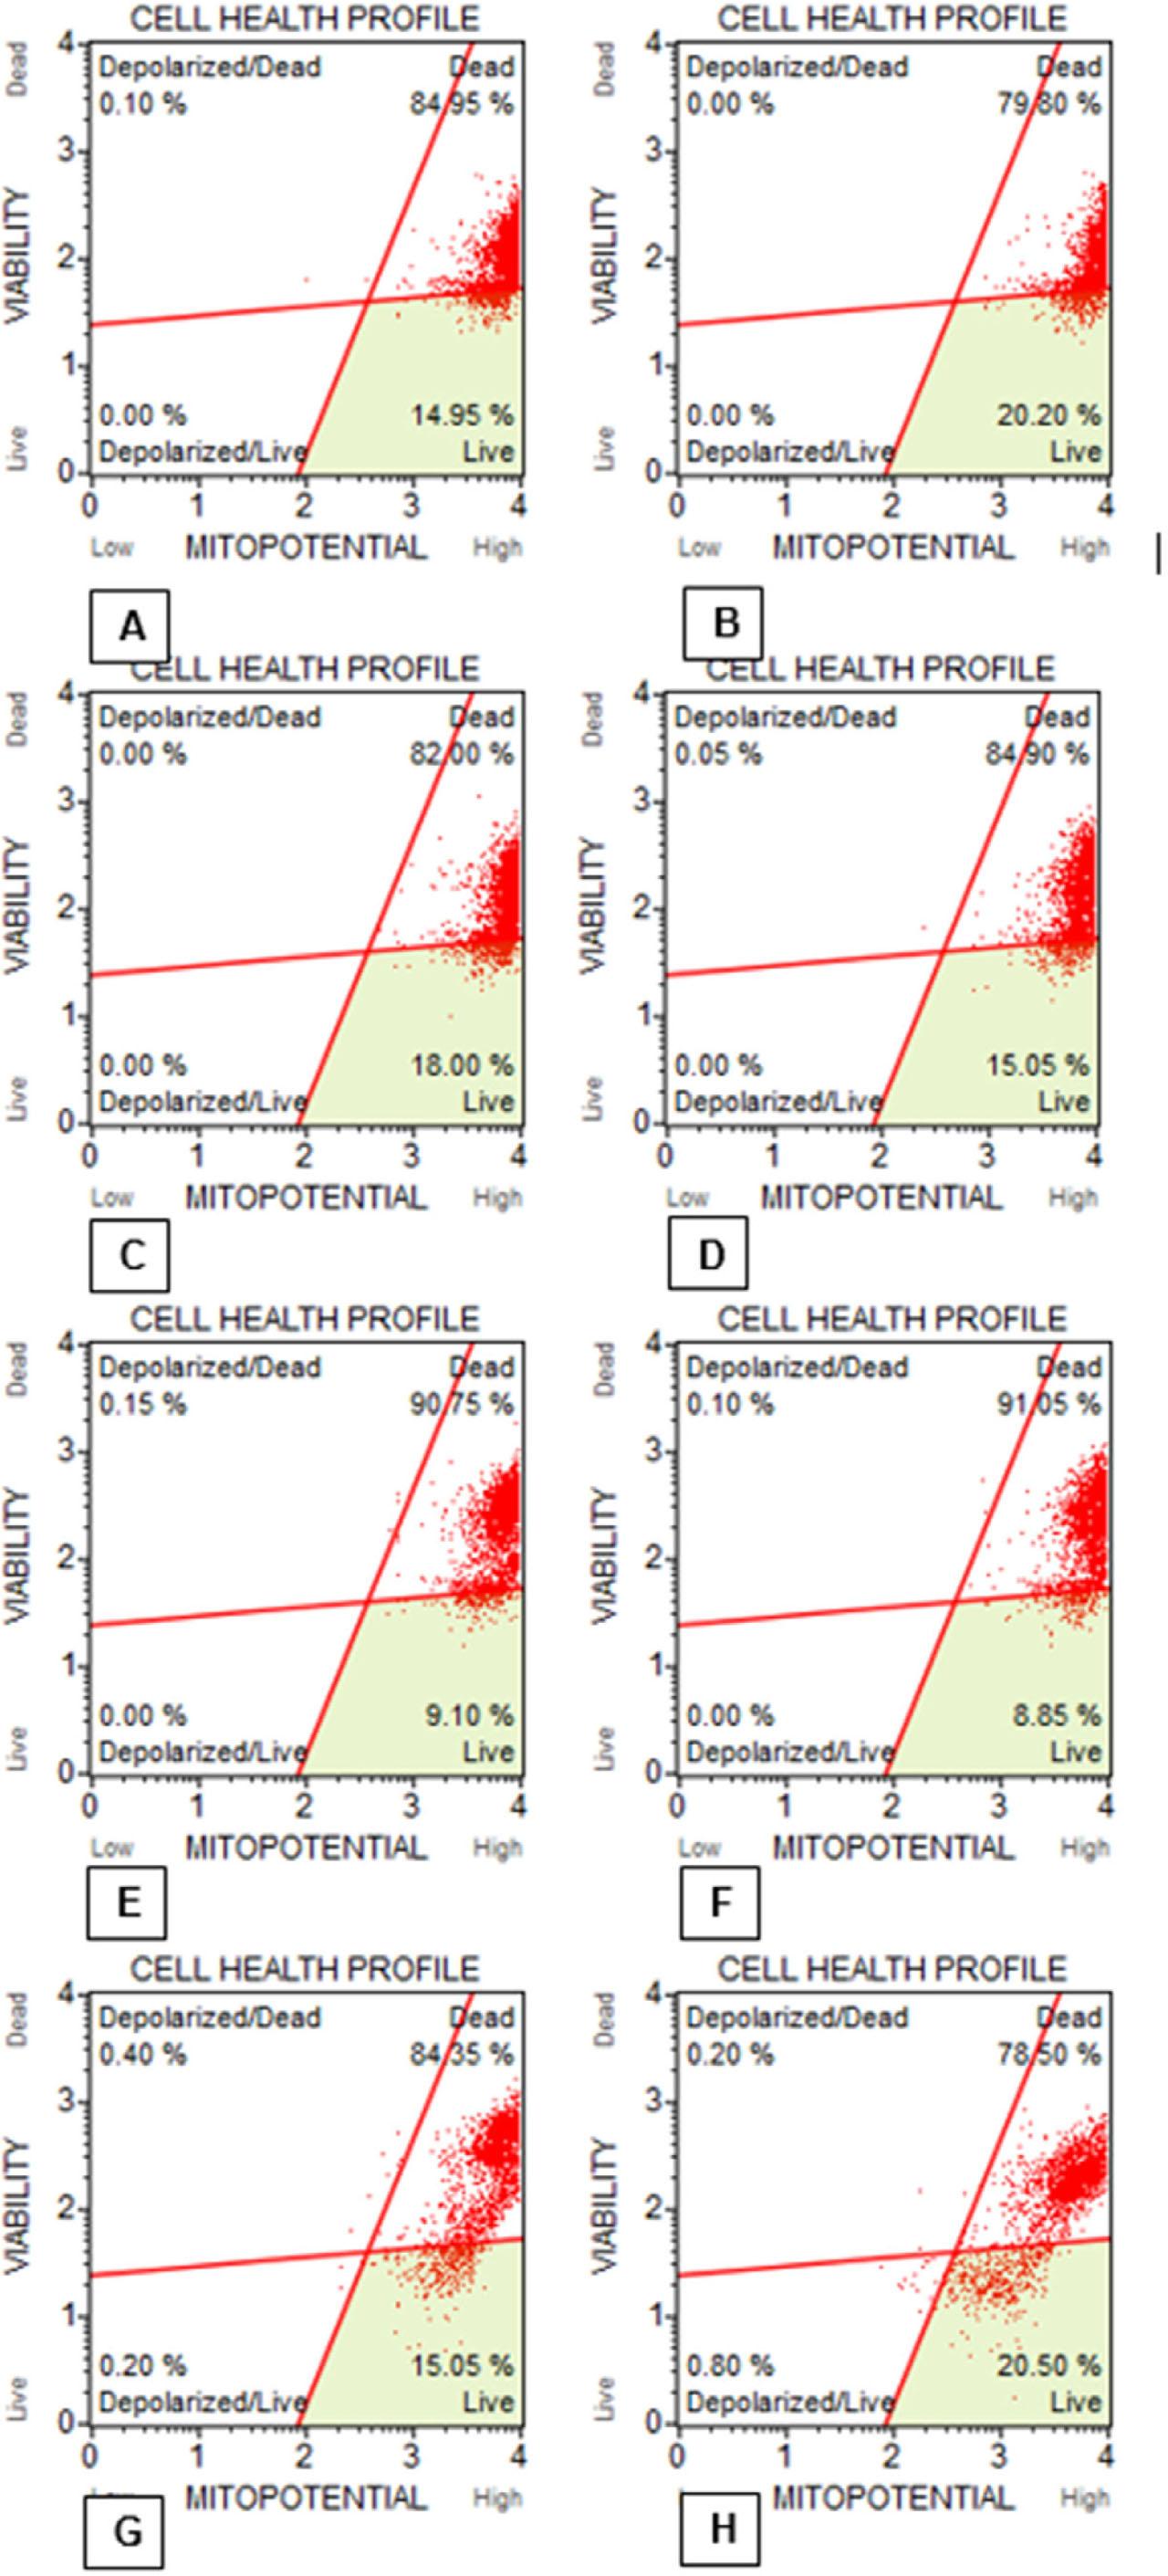
Expressing the proportional values of total depolarized cells by groups and time
| Total Amount of Depolarized | Incubation times | ||
|---|---|---|---|
| Groups | 24 hour | 48 hour | 72 hour |
| Control | 0.11±0.10a | 0.05±0.05ab | 0.25±0.10a |
| 5 FU | 0.10±0.00a | 0.00±0.00a | 0.36±0.10a |
| DMSO | 0.28±0.12a | 0.03±0.05a | 0.25±0.31a |
| 50 μg/mL Y | 0.46±0.33ab | 0.06±0.02ab | 0.28±0.40a |
| 100 μg/mL Y | 0.61±0.05ab | 0.13±0.02ab | 0.40±0.22a |
| 200 μg/mL Y | 0.91±0.05ab | 0.08±0.02ab | 0.33±0.25a |
| 400 μg/mL Y | 1.78±0.96bc | 0.41±0.23b | 0.50±0.44a |
| 800 μg/mL Y | 2.96±0.83c | 0.86±0.27c | 4.80±4.56a |
| p value between groups | <0.001 | <0.001 | <0.042 |
Expression of G2/M phase proportional values according to groups and time
| G2/M | Incubation times | ||
|---|---|---|---|
| Groups | 24 hours | 48 hours | 72 hours |
| Control | 8.20±1.77a | 10.96±1.41ab | 17.26±3.90a |
| 5 FU | 7.06±1.02a | 9.50±2.27b | 9.75±2.89c |
| DMSO | 6.20±0.72a | 15.13±2.15ac | 14.73±1.62ac |
| 50 μg/mL | 7.13±0.58a | 18.53±1.92c | 16.23±2.35ac |
| 100 μg/mL | 8.06±1.19a | 12.03±1.26ab | 11.90±0.91ac |
| 200 μg/mL | 8.03±0.11a | 13.03±1.28ab | 13.96±0.70ac |
| 400 μg/mL | 7.63±0.45a | 11.93±2.04ab | 11.06±0.35bc |
| 800 μg/mL | 8.50±1.01a | 10.60±2.30ab | 11.20±1.40bc |
| p value between groups | 0.158 | <0.001 | <0.005 |
Expression of early apoptosis values by groups and time
| Early apoptosis | Incubation times | ||
|---|---|---|---|
| Groups | 24 hours | 48 hours | 72 hours |
| Control | 65.40±0.20a | 45.83±0.42ab | 32.75±33.80a |
| 5 FU | 67.50±1.37a | 53.50±4.47a | 27.78±1.02ab |
| DMSO | 63.35±2.55a | 41.31±3.54ab | 22.83±6.29abc |
| 50 μg/mL Y | 61.01±2.10ab | 49.15±2.05ad | 29.63±5.17a |
| 100 μg/mL Y | 60.43±1.03ab | 44.13±5.41ae | 28.40±1.40ab |
| 200 μg/mL Y | 49.05±5.36b | 35.41±3.67bce | 17.55±3.74bc |
| 400 μg/mL Y | 49.13±2.22b | 40.76±1.71bde | 17.60±3.03bc |
| 800 μg/mL Y | 21.80±11.87c | 27.55±8.80c | 14,60±4,32c |
| p value between groups | <0.001 | <0.001 | <0,001 |
Expression of total apoptosis values according to groups and time
| Total Apoptosis | Incubation times | ||
|---|---|---|---|
| Groups | 24 hours | 48 hours | 72 hours |
| Control | 97.80±0.52a | 76.30±3.11a | 69.16±3.31a |
| 5 FU | 97.96±0.29a | 81.05±2.19ab | 64.91±2.44a |
| DMSO | 96.83±1.15ac | 79.93±2.92ab | 60.31±7.24a |
| 50 μg/mL | 96,78±0.59ac | 84.15±2.23b | 67.50±9.92a |
| 100 μg/mL | 96.23±0.86ac | 80.00±0.98ab | 69.35±4.05a |
| 200 μg/mL | 93.55±1.2bc | 77.68±0.90a | 70.21±0.18a |
| 400 μg/mL | 91.53±1.84b | 79.68±0.45ab | 72.93±0.96a |
| 800 μg/mL | 82.56±2.67d | 77.75±2.77a | 74.48±3.06a |
| p value between groups | <0.001 | <0.014 | 0.072 |