
Table 1
Cytological evaluation of laryngeal smear
| Type of cytological preparation | Conventional Made using a different method |
|---|---|
| Overall quality of the smear | Suitable for cytological evaluation Suitable for cytological evaluation, dried Not suitable for cytological evaluation (technical procedure was not performed, or technical procedure was performed but material is too dry, incorrectly preserved, cell concentration is low, material is not legible due to numerous inflammatory cells, erythrocytes) |
| Number of cells in the smear | High cell concentration K1 Moderate number of cells K2 Low cell concentration K3 |
| Erythrocyte count in the smear | High erythrocyte count E1 Low/moderate erythrocyte count E2 Erythrocytes absent E3 |
| Severity of inflammation | Minor inflammation INF1 Moderate inflammation INF2 Severe inflammation INF3 |
| Type of inflammatory cells | Lymphocytes L Granulocytes G Lymphocytes and granulocytes L and G |
| General characteristics of the smear | No intraepithelial neoplasia or cancer, only normal stratified squamous epithelial cells are present Abnormal cytology Cells other than stratified squamous epithelial cells are present in the smear, glandular epithelium cells are present |
| Abnormal epithelial cells | Atypical squamous cells of undetermined significance ASC-US Low-grade intraepithelial lesion LSIL High-grade squamous intraepithelial lesion HISL High-grade squamous intraepithelial lesion with features that raise suspicion of invasion (keratin pearl, keratin bundles, pathological mitoses) |
Table 2
General characteristics of patients
| Feature (variable) | Group B | Group K | Total | B vs K p | |||
|---|---|---|---|---|---|---|---|
| N = 67 | N = 25 | N = 92 | |||||
| n | (%) | n | (%) | n | (%) | ||
| Sex: | <0.001 | ||||||
| Female | 16 | 23.9% | 18 | 72.0% | 34 | 37,0% | |
| Male | 51 | 76.1% | 7 | 28.0% | 58 | 63,0% | |
| Age: | 0.011 | ||||||
| M ± SD | 64.1 ± 8.6 | 56.3 ± 14.4 | 62.0 ± 11.0 | ||||
| Me [Q1; Q3] | 66 [60; 70] | 59 [42; 67] | 64 [57; 69] | ||||
| Min – Max | 26 - 79 | 34 - 85 | 26 - 85 | ||||
[i] n - group size; % - proportion; M - mean; SD - standard deviation; Me - median (50. percentile); Q1 - lower quartile (25. percentile); Q3 - upper quartile (75. percentile); Min - lowest value; Max - highest value; p - test significance level
Table 3
Clinical characteristics of patients
| Feature (variable) | Group B | Group K | Total | B vs K p | |||
|---|---|---|---|---|---|---|---|
| N = 67 | N = 25 | N = 92 | |||||
| n | (%) | n | (%) | n | (%) | ||
| Diagnosis: | <0.001 | ||||||
| Laryngeal cancer | 57 | 85.1 | 0 | 0.0 | 57 | 62.0 | |
| Leukoplakia | 10 | 14.9 | 0 | 0.0 | 10 | 10.9 | |
| Polyp | 0 | 0.0 | 10 | 40.0 | 10 | 10.9 | |
| Reinke’s edema | 0 | 0.0 | 10 | 40.0 | 10 | 10.9 | |
| Cyst | 0 | 0.0 | 5 | 20.0 | 5 | 5.3 | |
| Results of histopathological examination | <0.001 | ||||||
| FI - benign lesion | 21 | 31.3% | 25 | 100.0% | 46 | 50.0% | |
| LSIL | 7 | 10.4% | 0 | 0.0% | 7 | 7.6% | |
| HSIL | 6 | 9.0% | 0 | 0.0% | 6 | 6.5% | |
| Malignant lesion | 33 | 49.3% | 0 | 0.0% | 33 | 35.9% | |
| Results of cytological examination: | N = 67 | N = 23 | N = 90 | <0.001 | |||
| FI - benign lesion | 20 | 29.9% | 23 | 100.0% | 43 | 47.8% | |
| LSIL | 11 | 16.4% | 0 | 0.0% | 11 | 12.2% | |
| HSIL | 12 | 17.9% | 0 | 0.0% | 12 | 13.3% | |
| HISL* (with features of invasion) | 21 | 31.4% | 0 | 0.0% | 21 | 23.3% | |
| ASC-US | 3 | 4.5% | 0 | 0.0% | 3 | 3.3% | |
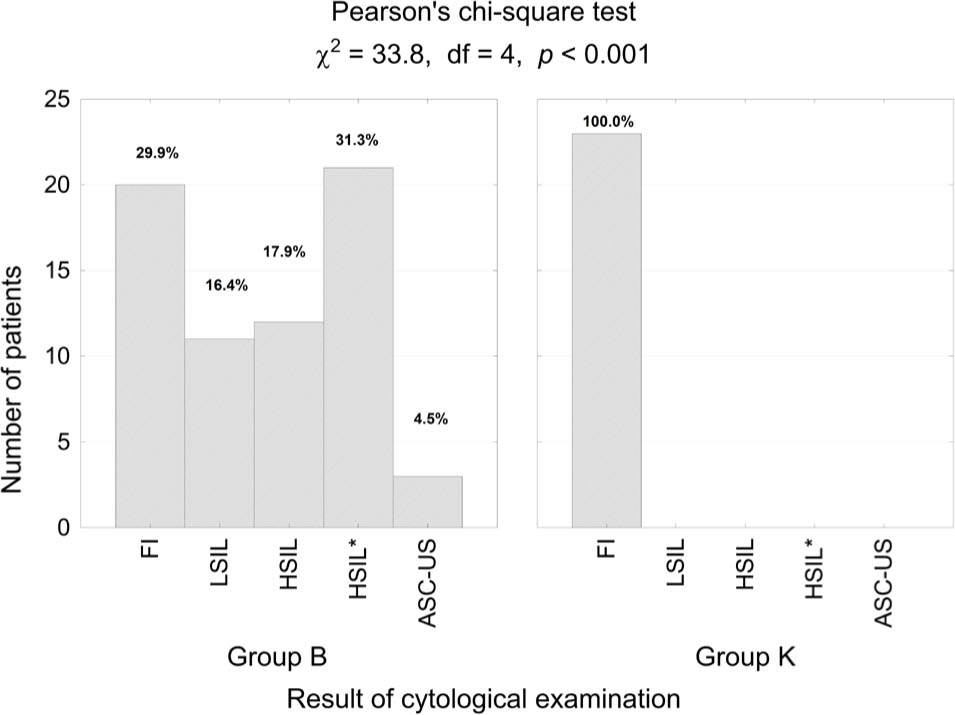
Fig. 1
Number (percentage) of patients in groups differing in terms of final and initial diagnosis on the basis of cytological examination results (FI – normal result, benign lesions; LSIL – low-grade lesion; HSIL – high-grade lesion; HSIL* – high-grade lesion with features of invasion; ASC-US – atypical cells of undetermined significance) and results of independence test
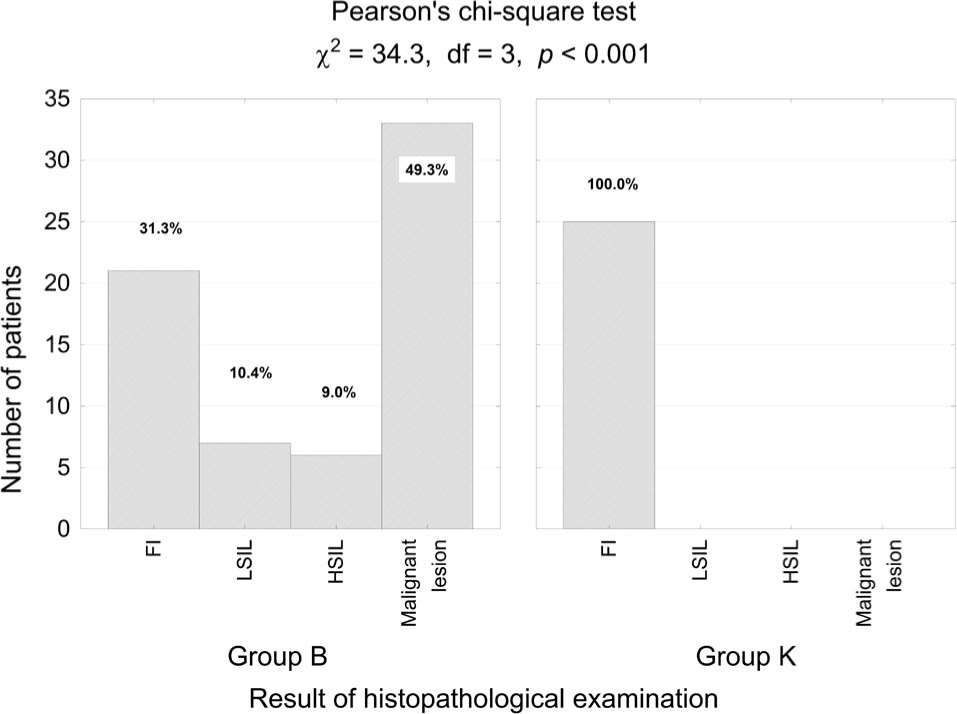
Fig. 2
Number (percentage) of patients in groups differing in terms of clinical diagnosis and result of histopathological examination as well as result of independence test
Table 4
Number (proportion) of diagnoses in 90 patients with laryngeal diseases made based on results of cytological and histopathological examinations
| Result of brush cytology | Result of histopathological examination | |||
|---|---|---|---|---|
| Benign lesion N = 44 | LSIL N = 7 | HSIL N = 6 | Malignant lesion N = 33 | |
| FI - benign lesion | 40 (44.4%) | 0 (0.0%) | 0 (0.0%) | 3 (3.3%) |
| LSIL | 4 (4.4%) | 7 (7.8%) | 0 (0.0%) | 0 (0.0%) |
| HSIL | 0 (0.0%) | 0 (0.0%) | 6 (6.7%) | 6 (6.7%) |
| HISL* - with features of invasion | 0 (0.0%) | 0 (0.0%) | 0 (0.0%) | 21 (23.3%) |
| ASC-US - abnormal result | 0 (0.0%) | 0 (0.0%) | 0 (0.0%) | 3 (3.3%) |
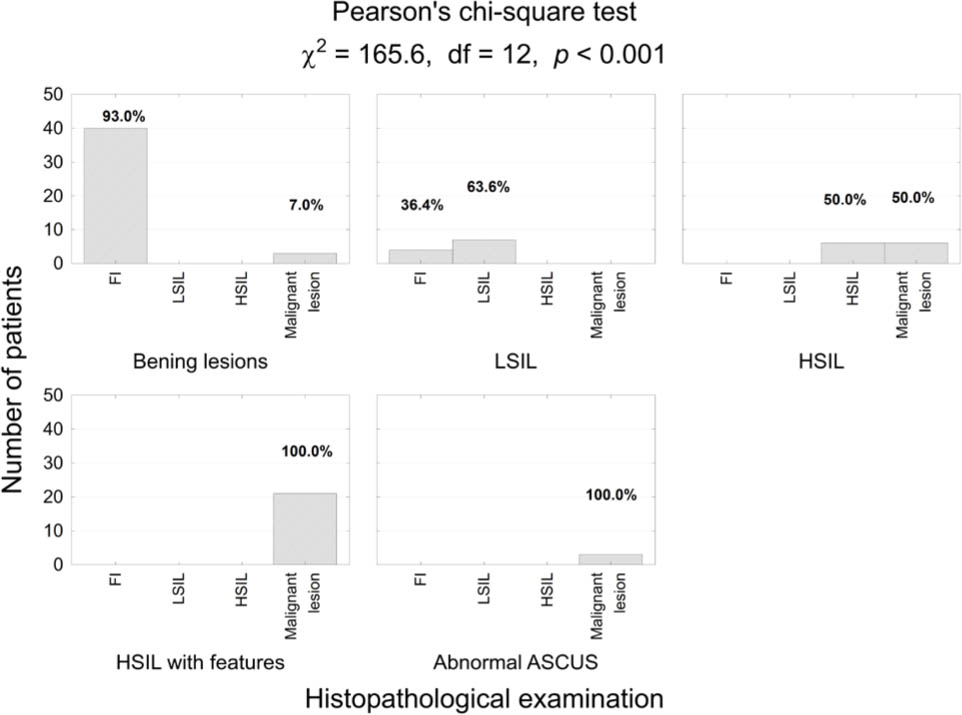
Fig. 3
Number (percentage) of patients in groups differing in terms of initial diagnosis and diagnosis made based on results of histopathological and cytological examination and results of independence test
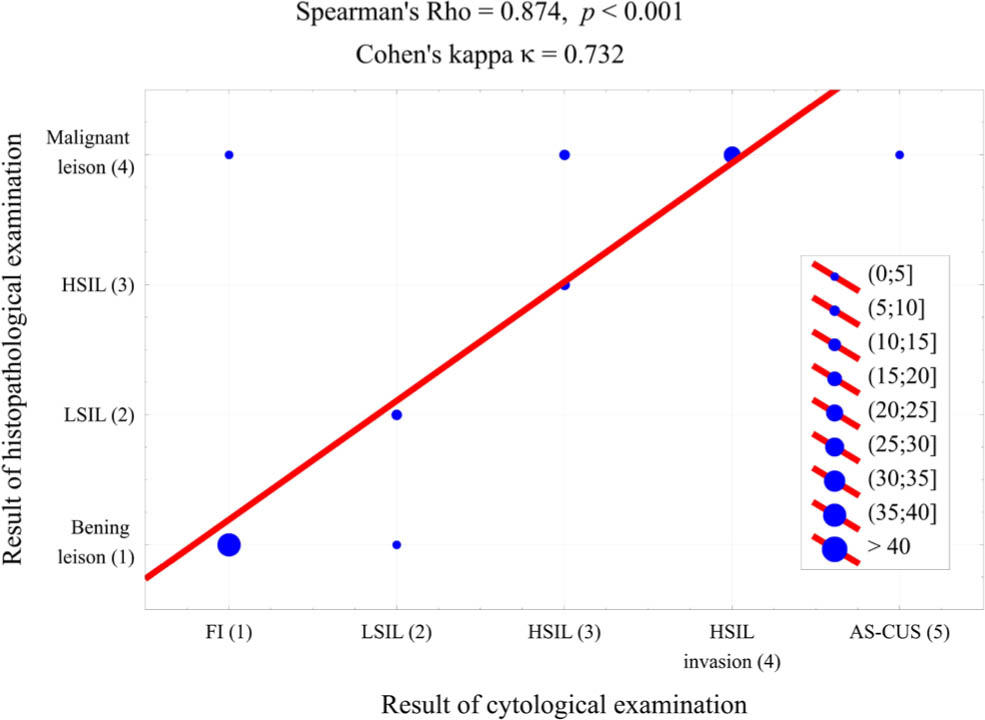
Fig. 4
Scatter plot of cytology and histopathology results
Table 5
The accuracy of brush cytology as a diagnostic test for laryngeal cancer
| Cytological examination | The actual status – “gold standard” Histopathological examination | ||
|---|---|---|---|
| (+) | (−) | Total | |
| (+) | 40 (PD) | 3 (FD) | 43 (PD + FD) |
| (−) | 4 (FU) | 43 (PU) | 47 (FU + PU) |
| 44 (PD + FU) | 46 (FD + PU) | 87 (PD + FD + FFU + PU) | |
[i] Test sensitivity = (40/44) × 100 = 90.9%
[ii] Test specificity = (43/46) × 100 = 93.5%
[iii] Accuracy of diagnosis = (83/87) × 100 = 92.2%
[iv] Positive prediction = (40/40) = 93.0%
[v] Negative prediction = (15/25) = 91.5%
[vi] LR+ reliability index = 13.94
[vii] LR− reliability index = 0.10
Table 6
Observed numbers of the classification of laryngeal findings conducted by a cytologist and histopathologist, and Cohen’s kappa value with quadratic weights and standard errors for κ
| Cytologist | Histopathologist | |||
|---|---|---|---|---|
| Benign lesion | LSIL | HSIL | Malignant lesion | |
| Benign lesion | 40 | 0 | 0 | 3 |
| LSIL | 4 | 7 | 0 | 0 |
| HSIL | 0 | 0 | 6 | 6 |
| HISL with features of invasion | 0 | 0 | 0 | 21 |
| N = 87; Cohen’s kappa coefficient κ = 0.732; SE = 0.020; p < 0.0001 | ||||