
Fig. 1
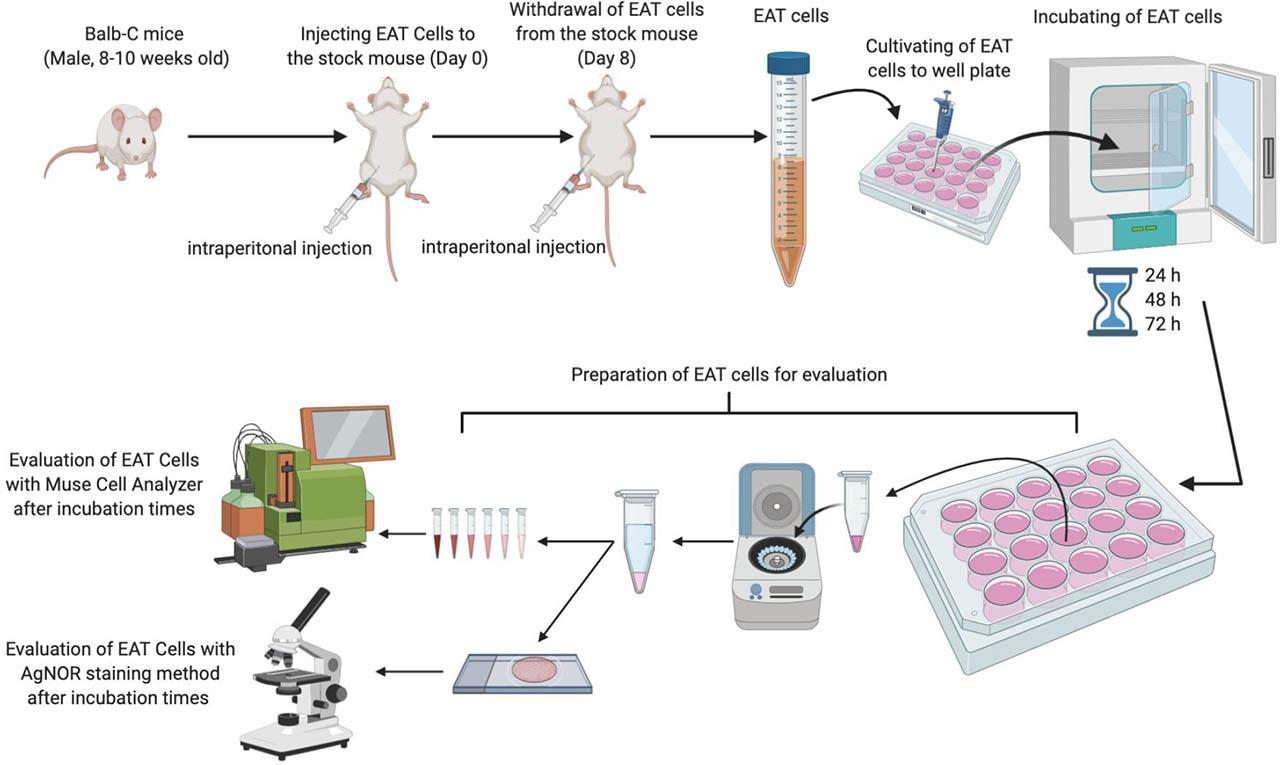
Fig. 2
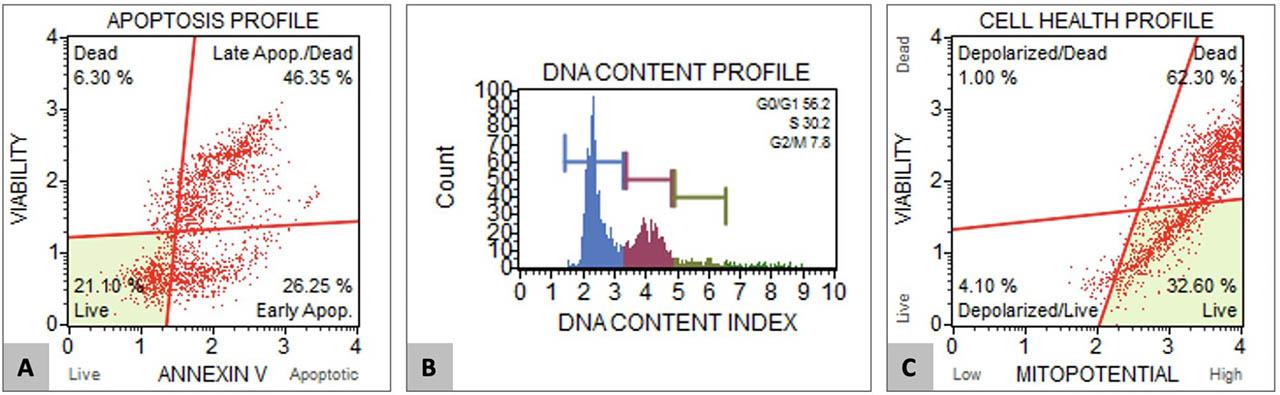
Fig. 3
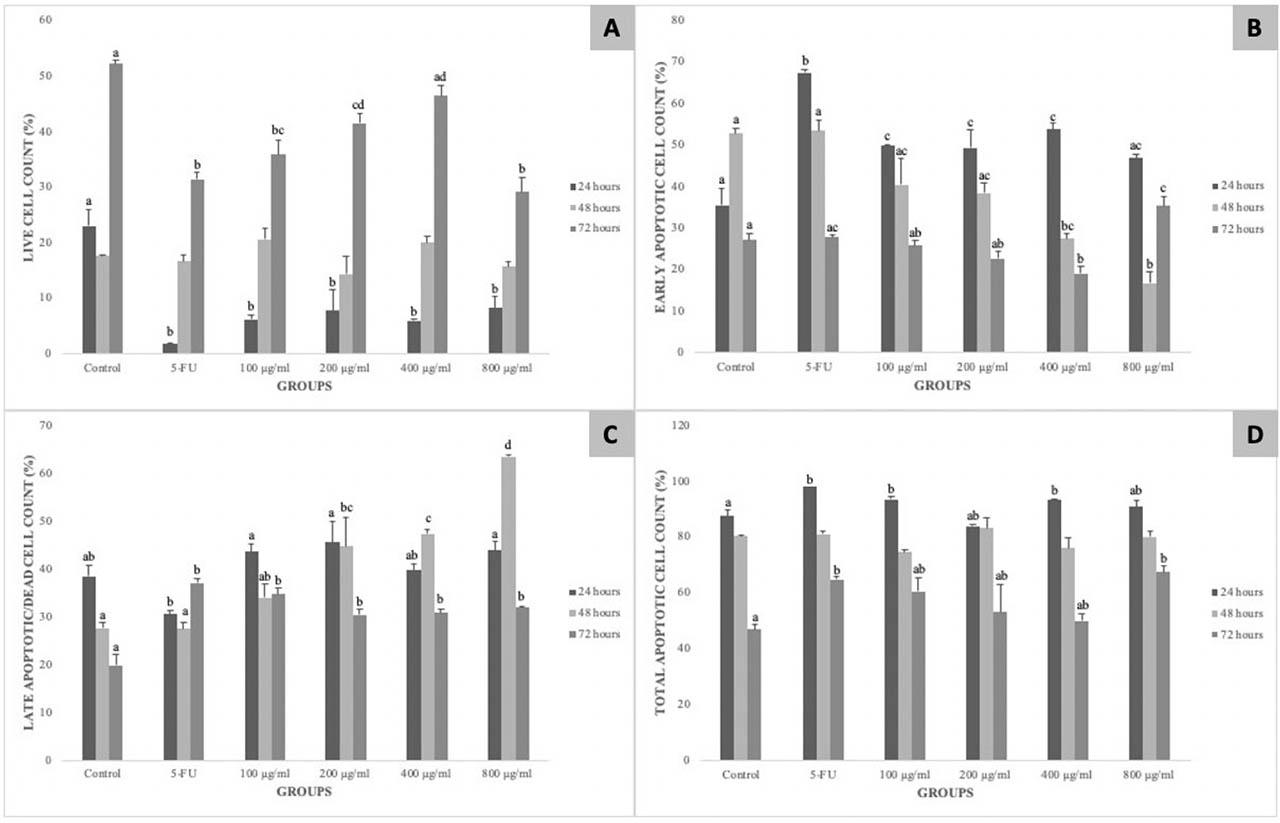
Fig. 4
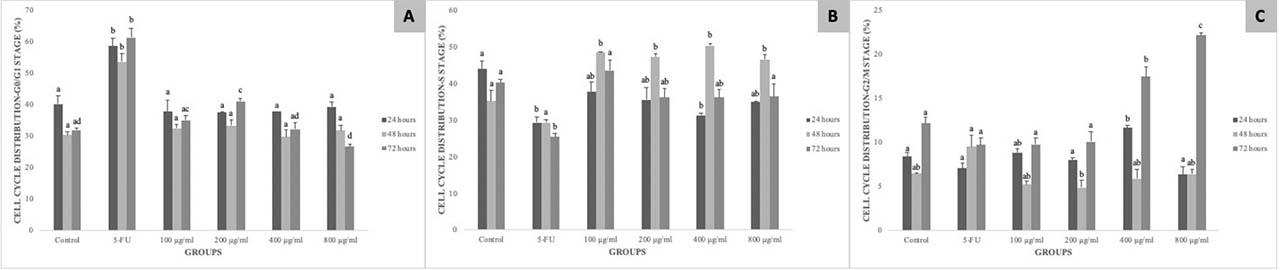
Fig. 5
Fig. 6
Mean AgNOR number after 24, 48, and 72 hours of incubation
| Hours/Groups | Control | 5-FU | 100 μg/ml | 200 μg/ml | 400 μg/ml | 800 μg/ml | p |
|---|---|---|---|---|---|---|---|
| 24 hours | 3.54±1.26a | 2.82±1.06b | 2.98±1.16ab | 1.74±0.77c | 1.74±1.00c | 1.80±1.19c | <0.001 |
| 48 hours | 3.68±1.55a | 3.16±1.07a | 2.40±0.78b | 2.12±1.25b | 1.96±0.75b | 1.28±0.53c | <0.001 |
| 72 hours | 1.52±0.64a | 2.20±1.08bc | 2.26±1.24c | 2.20±1.01bc | 1.68±0.76ab | 1.74±0.85abc | <0.001 |
Total phenolic and flavonoid contents of mistletoe fruit
| Total phenol (mgGAE/gextract) | Total flavonoid (mgCAE/gextract) | |
|---|---|---|
| Mistletoe fruit | 6.24±2.26 | 4.82±1.36 |
TAA / NA value at the end of 24, 48, and 72 hours of incubation
| Hours/Groups | Control | 5-FU | 100 μg/ml | 200 μg/ml | 400 μg/ml | 800 μg/ml | p |
|---|---|---|---|---|---|---|---|
| 24 hours | 0.11±0.04ab | 0.14±0.04b | 0.10±0.03ac | 0.13±0.06ab | 0.08±0.04c | 0.10±0.05ac | <0.001 |
| 48 hours | 0.27±0.15a | 0.23±0.05a | 0.17±0.08b | 0.13±0.12bc | 0.09±0.05c | 0.09±0.07c | <0.001 |
| 72 hours | 0.10±0.04ac | 0.12±0.04ab | 0.13±0.05b | 0.10±0.06ac | 0.08±0.04c | 0.11±0.04bc | <0.001 |