
Fig. 1
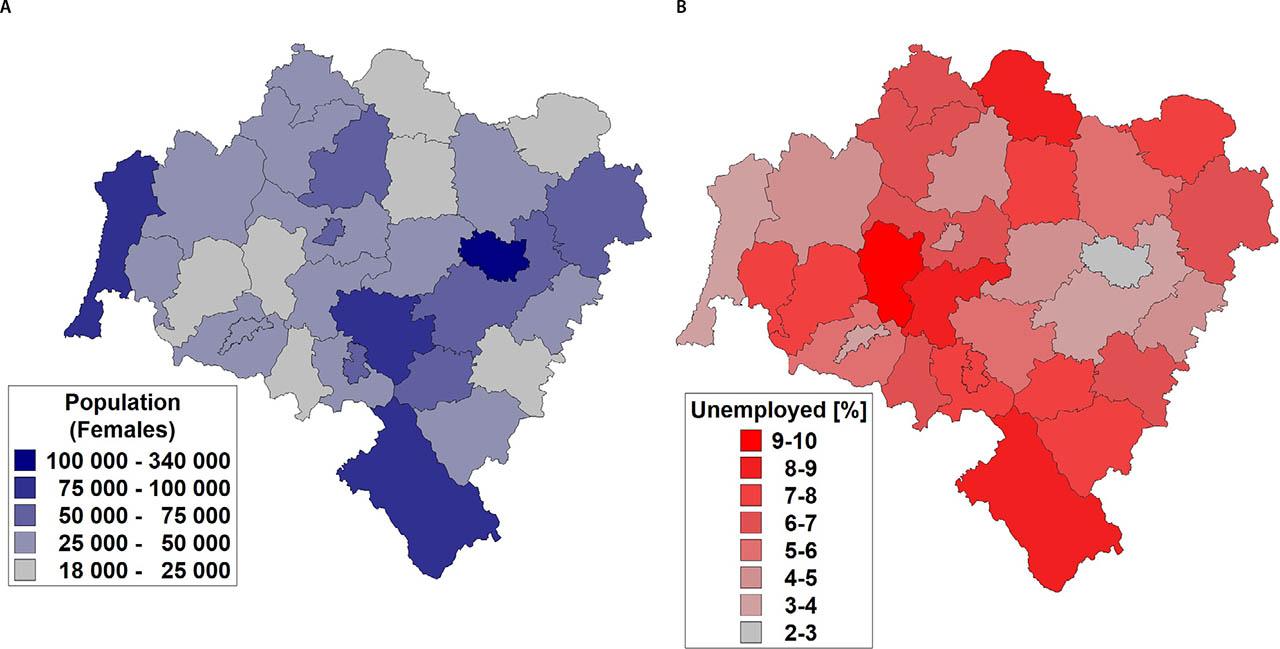
Fig. 2

Fig. 3
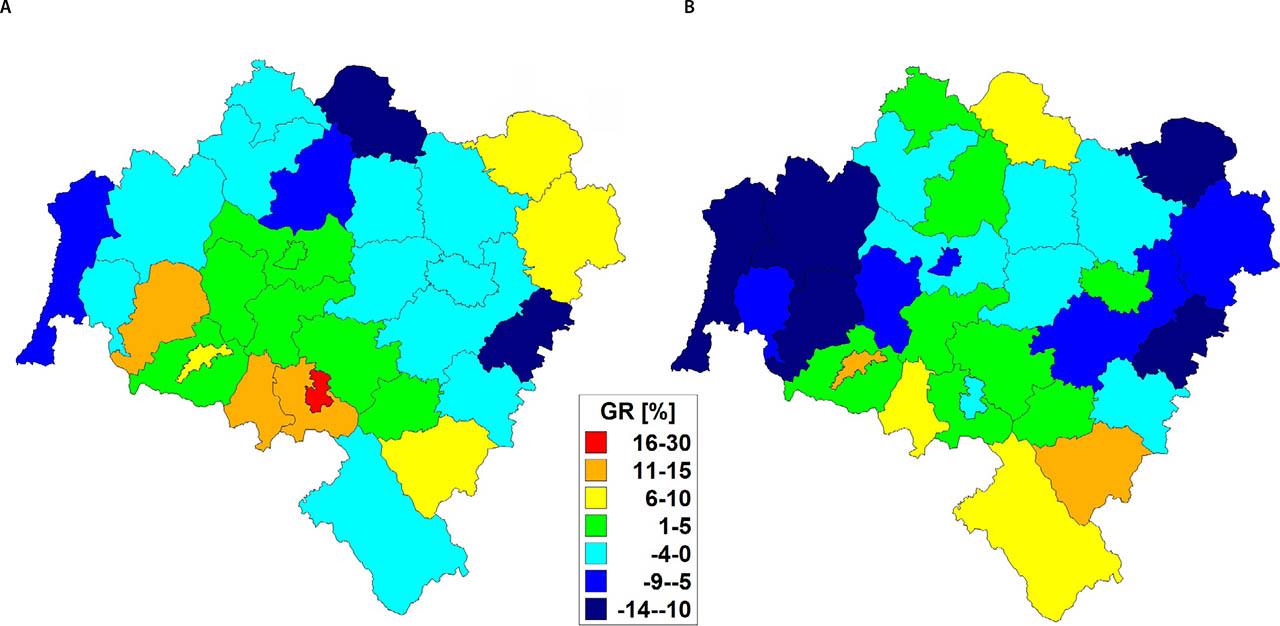
Fig. 4

Moran's I statistic and test p-values
| Spatial feature | Moran's I | p-value |
|---|---|---|
| SIR | −0.057 | 0.506 |
| SMR | 0.001 | 0.308 |
| GR (incidence) | 0.079 | 0.001 |
| GR (mortality) | 0.052 | 0.014 |
Estimates of regression coefficients of the unemployed fraction [%] in the entire female population on breast cancer incidence and mortality in Lower Silesia, Poland (2005–2014)
| Spatial feature | Regr. coeff. | CI95% | p-value |
|---|---|---|---|
| BC incidence | −0.03 | (−0.05, −0.01) | 0.005 |
| BC mortality | 0.04 | (0.01, 0.07) | 0.002 |
Pearson's r linear correlations between standardized incidence and mortality ratios as well as cancer growth rates (SIRs, SMRs, and GRs) in Lower Silesia Region
| Correlation | SMR | GR (incidence) | GR (mortality) |
|---|---|---|---|
| SIR | r= −0.35 | r= 0.19 | r= 0.17 |
| SMR | -- | r= 0.34 | r= 0.60 |
| GR (incidence) | -- | -- | r= 0.13 |
Statistically significant (p< 0_05) spatiotemporal BC clusters in Lower Silesia (2005–2014)
| Spatial feature | Cluster # | N, E Coordinates | Radius [km] | Counties | Timeframe | RR (CI95%) | p-value |
|---|---|---|---|---|---|---|---|
| Incidence | 1 | 51.13, 16.99 | 0 | Wroclaw | 2010–2014 | 1.42 (1.31–1.53) | <0.001 |
| 2 | 50.79, 16.30 | 20.8 | Wałbrzych, wałbrzyski, świdnicki, kamiennogórski | 2011–2013 | 1.29 (1.16–1.43) | <0.001 | |
| 3 | 51.16, 15.07 | 0 | zgorzelecki | 2008–2012 | 0.48 (0.41–0.56) | <0.001 | |
| 4 | 59.9 | Wałbrzych, wałbrzyski, świdnicki, dzierżoniowski, jaworski, Jelenia Góra, jeleniogórski, kamiennogórski, złotoryjski, średzki, Legnica, legnicki, wrocławski, ząbkowicki, kłodzki, strzeliński, lwówecki | 2005–2006 | 0.74 (0.69–0.79) | <0.001 | ||
| 5 | 51.26, 17.51 | 0 | oleśnicki | 2005–2009 | 0.53 (0.68–0.81) | <0.001 | |
| Mortality | 6 | 50.76, 16.01 | 32.5 | jaworski, Jelenia Góra, jeleniogórski, kamiennogórski, świdnicki, Wałbrzych, wałbrzyski | 2008–2013 | 1.35 (1.19–1.54) | <0.001 |
Characteristics of the female population and oncological care (presence of the full-profile oncology center) of Lower Silesia by counties in 2005–2014
| County | SIR incidence | SMR mortality | GR incidence | GR mortality | Number of urban communes | Number of urban-rural communes | Number of rural communes | Presence of oncology center (reorganization/opening year) |
|---|---|---|---|---|---|---|---|---|
| bolesławiecki | 0.94 | 0.95 | 0.99 | 0.89 | 1 | 1 | 4 | NO |
| dzierżoniowski | 1.04 | 1.03 | 1.03 | 1.01 | 3 | 2 | 2 | NO |
| głogowski | 0.89 | 1.02 | 0,96 | 1.01 | 1 | 0 | 5 | NO |
| górowski | 0.98 | 1.05 | 0.89 | 1.08 | 0 | 2 | 2 | NO |
| jaworski | 1.05 | 1.04 | 1.03 | 1.03 | 1 | 1 | 4 | NO |
| jeleniogórski | 0.90 | 1.07 | 1.04 | 1.02 | 4 | 0 | 5 | NO |
| kamiennogórski | 1.06 | 1.07 | 1.13 | 1.10 | 1 | 1 | 2 | NO |
| kłodzki | 1.13 | 0.99 | 1.00 | 1.06 | 5 | 6 | 3 | NO |
| legnicki | 0.93 | 1.08 | 1.01 | 0.98 | 1 | 1 | 6 | NO |
| lubański | 1.14 | 0.93 | 0,99 | 0.92 | 2 | 2 | 3 | NO |
| lubiński | 0.91 | 1.00 | 0.91 | 1.02 | 1 | 1 | 2 | NO |
| lwówecki | 0.95 | 0.93 | 1.10 | 0.89 | 0 | 5 | 0 | NO |
| milicki | 1.15 | 0.88 | 1.07 | 0.86 | 0 | 1 | 2 | NO |
| oleśnicki | 0.74 | 1.14 | 1,08 | 0.92 | 1 | 4 | 3 | NO |
| oławski | 1.42 | 0.83 | 0.88 | 0.88 | 1 | 1 | 2 | NO |
| polkowicki | 0.96 | 0.97 | 0.96 | 0.98 | 0 | 3 | 3 | NO |
| strzeliński | 1.01 | 0.96 | 0.99 | 0.98 | 0 | 2 | 3 | NO |
| średzki | 0.85 | 1.03 | 0,97 | 0.98 | 0 | 1 | 4 | NO |
| świdnicki | 1.12 | 1.06 | 1.02 | 1.04 | 2 | 3 | 3 | NO |
| trzebnicki | 0.90 | 0.99 | 1.00 | 0.95 | 0 | 4 | 2 | NO |
| wałbrzyski | 1.08 | 1.08 | 1.13 | 1.01 | 3 | 2 | 3 | NO |
| wołowski | 1.09 | 1.03 | 1.00 | 0.98 | 0 | 2 | 1 | NO |
| wrocławski | 1.09 | 0.92 | 1.00 | 0.90 | 0 | 3 | 6 | NO |
| ząbkowicki | 1.04 | 1.09 | 1.08 | 1.11 | 0 | 4 | 3 | NO |
| zgorzelecki | 0.55 | 1.06 | 0.92 | 0.88 | 3 | 2 | 3 | NO |
| złotoryjski | 1.00 | 0.88 | 1.04 | 0.94 | 2 | 1 | 3 | NO |
| Jelenia Góra | 1.15 | 1.09 | 1.05 | 1.11 | 1 | 0 | 0 | NO |
| Legnica | 1.10 | 1.01 | 1.03 | 0.93 | 1 | 0 | 0 | YES (2014) |
| Wrocław | 1.25 | 0.95 | 0.96 | 1.00 | 1 | 0 | 0 | YES |
| Wałbrzych | 1.24 | 1.07 | 1.27 | 0.99 | 1 | 0 | 0 | YES (2008) |