
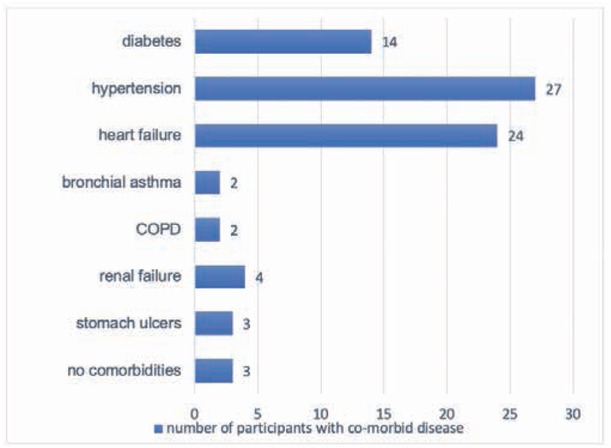
Figure 1
The distribution of the individual accompanying diseases
Table 1
Comparison of the Beck Depression Scale (BDI) and the State-Trait Anxiety Inventory – status (STAI-X1) and features (STAI-X2) – depending on the group being examined
| Group of patients | Baseline | After cardiac rehabilitation | p |
|---|---|---|---|
| BPI | |||
| All participants (n=40) | 14.55 ± 6.47 | 8.28±5.26 | <0.001 |
| Women (n=18) | 17.94±7.07 | 10.56±5.90 | <0.001 |
| Men (n=22) | 11.78±4.40 | 6.41±3.88 | <0.001 |
| STAI-X1 | |||
| All participants (n=40) | 31.80±7.24 | 26.40±6.30 | <0.001 |
| Women (n=18) | 33.61±8.46 | 26.94±6.83 | <0.001 |
| Men (n=22) STAI-X2 | 30.32±5.87 | 25.96±5.95 | <0.001 |
| All participants (n=40) | 35.98±8.29 | 29.80±6.57 | <0.001 |
| Women (n=18) | 37.89±9.68 | 31.44±7.65 | <0.001 |
| Men (n=22) | 34.41±6.79 | 28.46±5.34 | <0.001 |
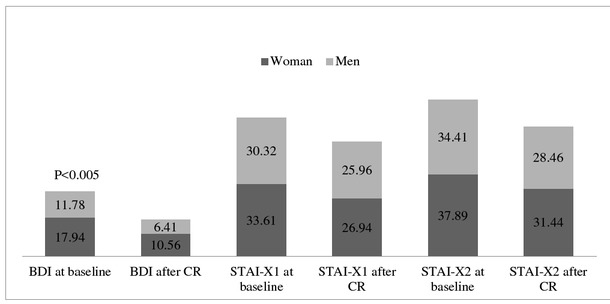
Figure 2
Comparison of the severity of anxiety and depression symptoms by gender (CR—cardiac rehabilitation)
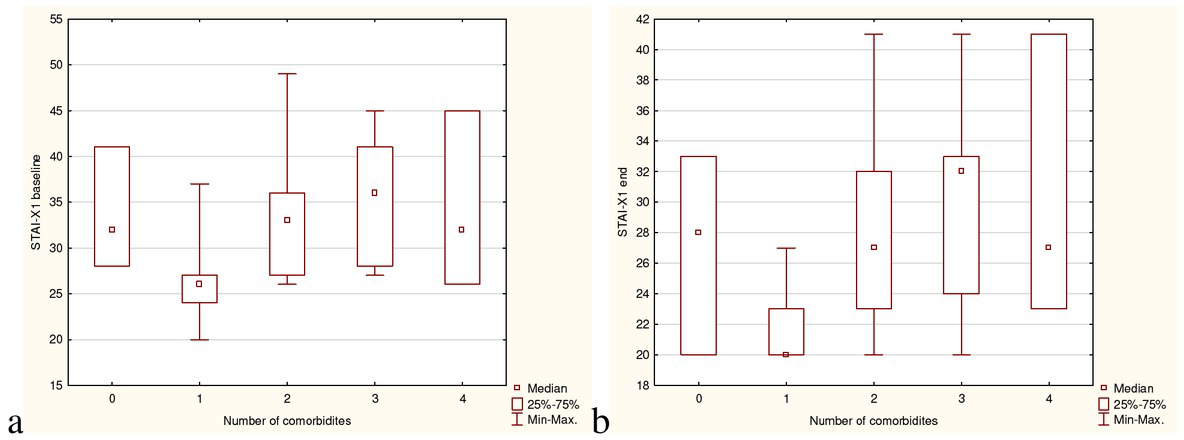
Figure 3
Anxiety as a condition—STAI scale depending on the number of comorbidities (p <0.05) at the beginning of cardiac rehabilitation— a; at the end of cardiac rehabilitation—b
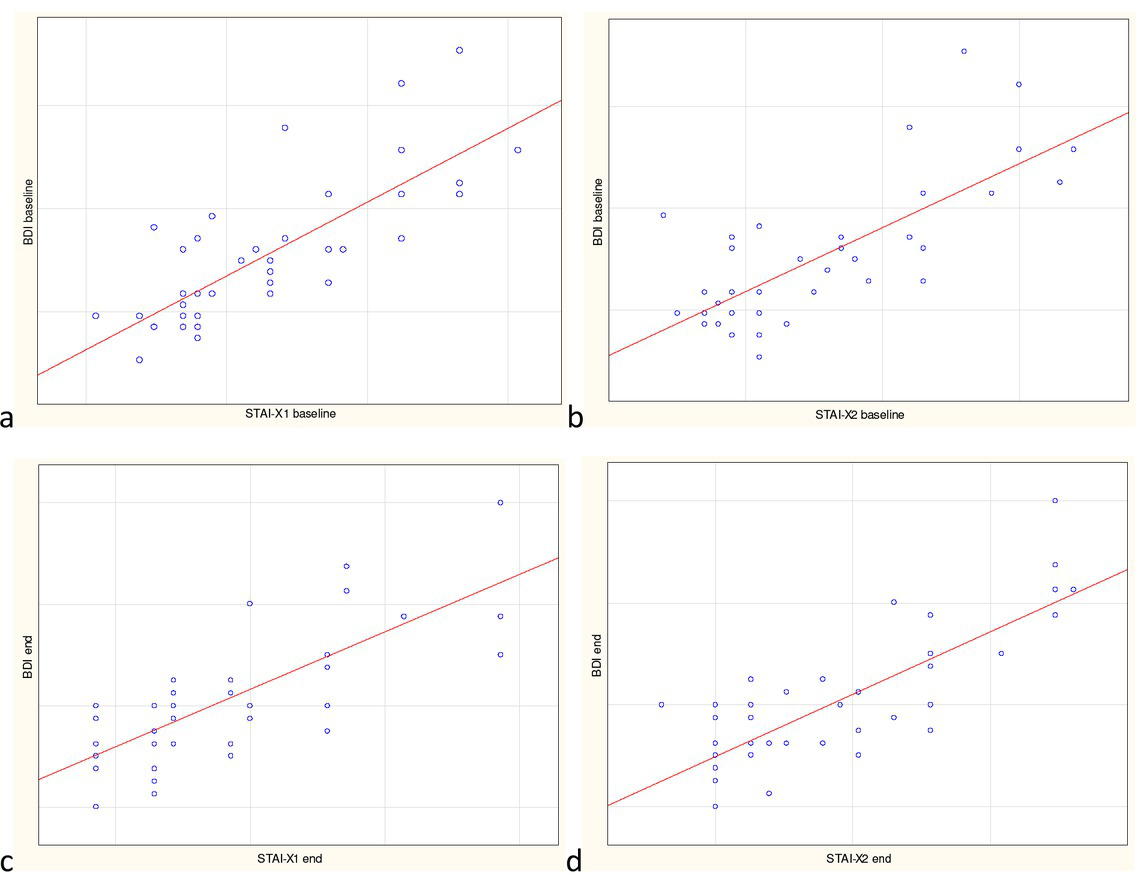
Figure 4
Correlation between the severity of depressive symptoms (BDI) and the severity of anxiety both as a condition (STAI-X1) and as a trait (STAI-X2)