
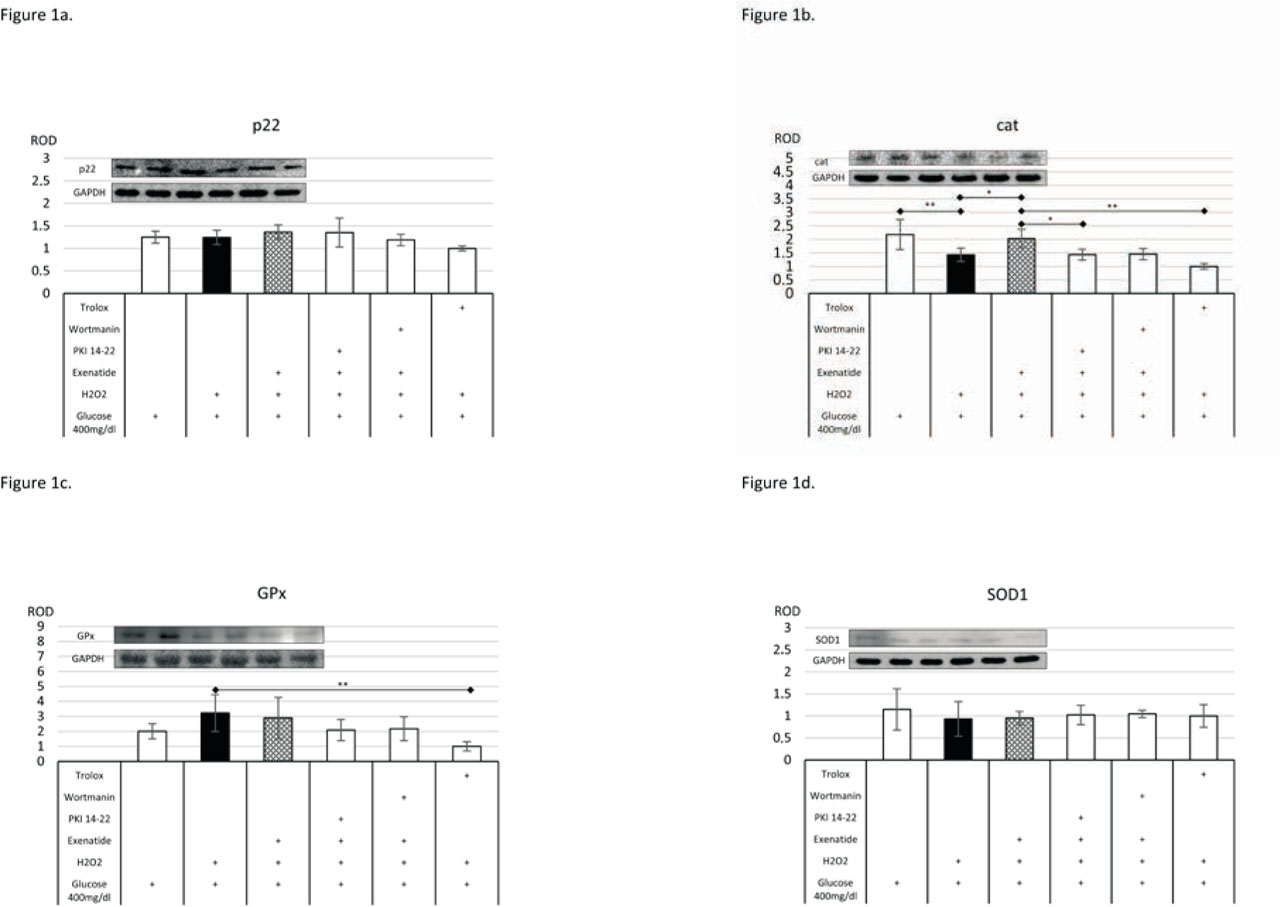
Fig. 1
The impact of exenatide on the level of expression of p22 (a), catalase (b), glutathione peroxidase (c) and superoxide dismutase 1 (d). Data are expressed as means ± SEM. Asterisks indicate the level of statistical significance: * - p<0.05, ** - p<0.01
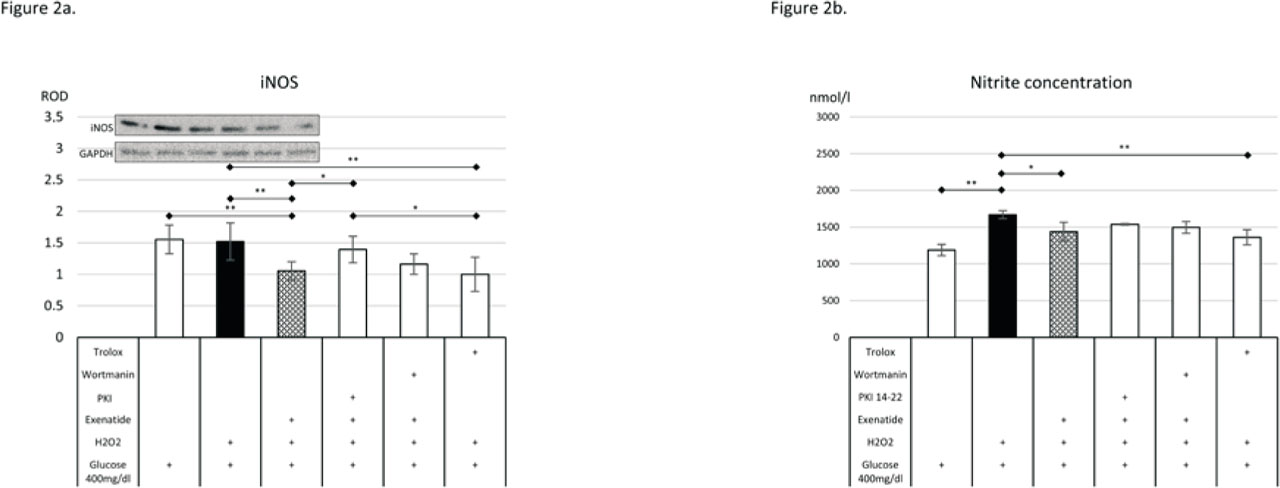
Fig. 2
The impact of exenatide on the level of expression of inducible nitric oxide (a), and the concentration of nitrite in culture media (b). Data are expressed as means ± SEM. Asterisks indicate the level of statistical significance: * - p<0.05, ** - p<0.01
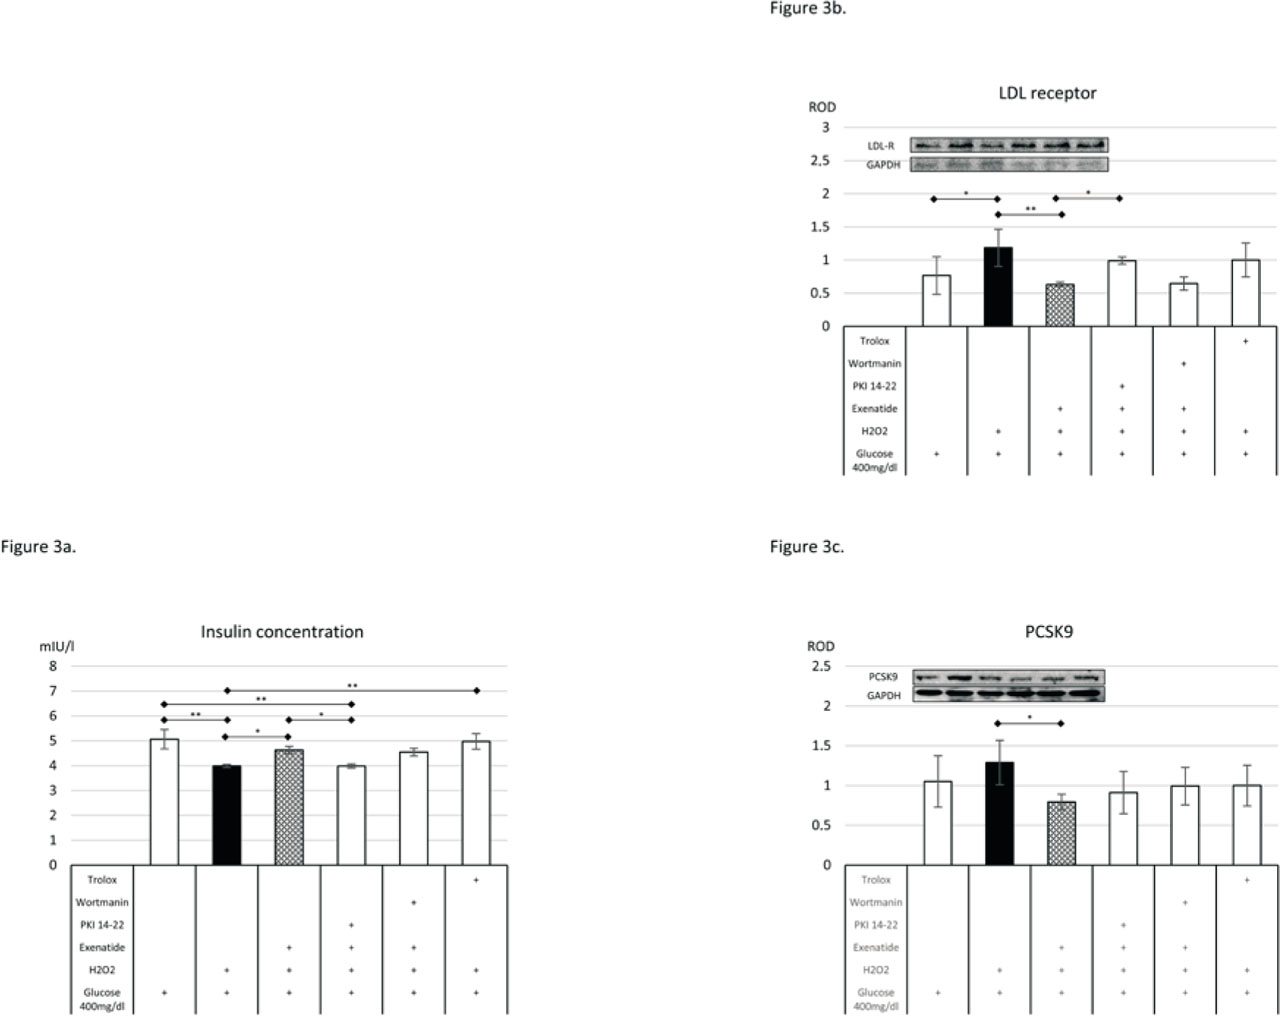
Fig. 3
The impact of exenatide on the concentration of insulin in culture media (a), the level of expression of LDL receptor (b) and PCSK9 (c). Data are expressed as means ± SEM. Asterisks indicate the level of statistical significance: * - p<0.05, ** - p<0.01