
Table 1.
The formulation of body lotion sunscreen
| FN | F1 | F2 | F3 | F4 | |
|---|---|---|---|---|---|
| Tangerine oil | - | 3 | 6 | 9 | 12 |
| TiO2 | 3 | 3 | 3 | 3 | 3 |
| Stearate acic | 5 | 5 | 5 | 5 | 5 |
| Cetyl alcohol | 3 | 3 | 3 | 3 | 3 |
| TEA | 2 | 2 | 2 | 2 | 2 |
| Glycerin | 5 | 5 | 5 | 5 | 5 |
| Paraffin liquid | 8 | 8 | 8 | 8 | 8 |
| Propylene glycol | 8 | 8 | 8 | 8 | 8 |
| Phenoxyethanol | 1 | 1 | 1 | 1 | 1 |
| Citric acid | 1 | 1 | 1 | 1 | 1 |
| Distilled water (add) | 100 | ||||
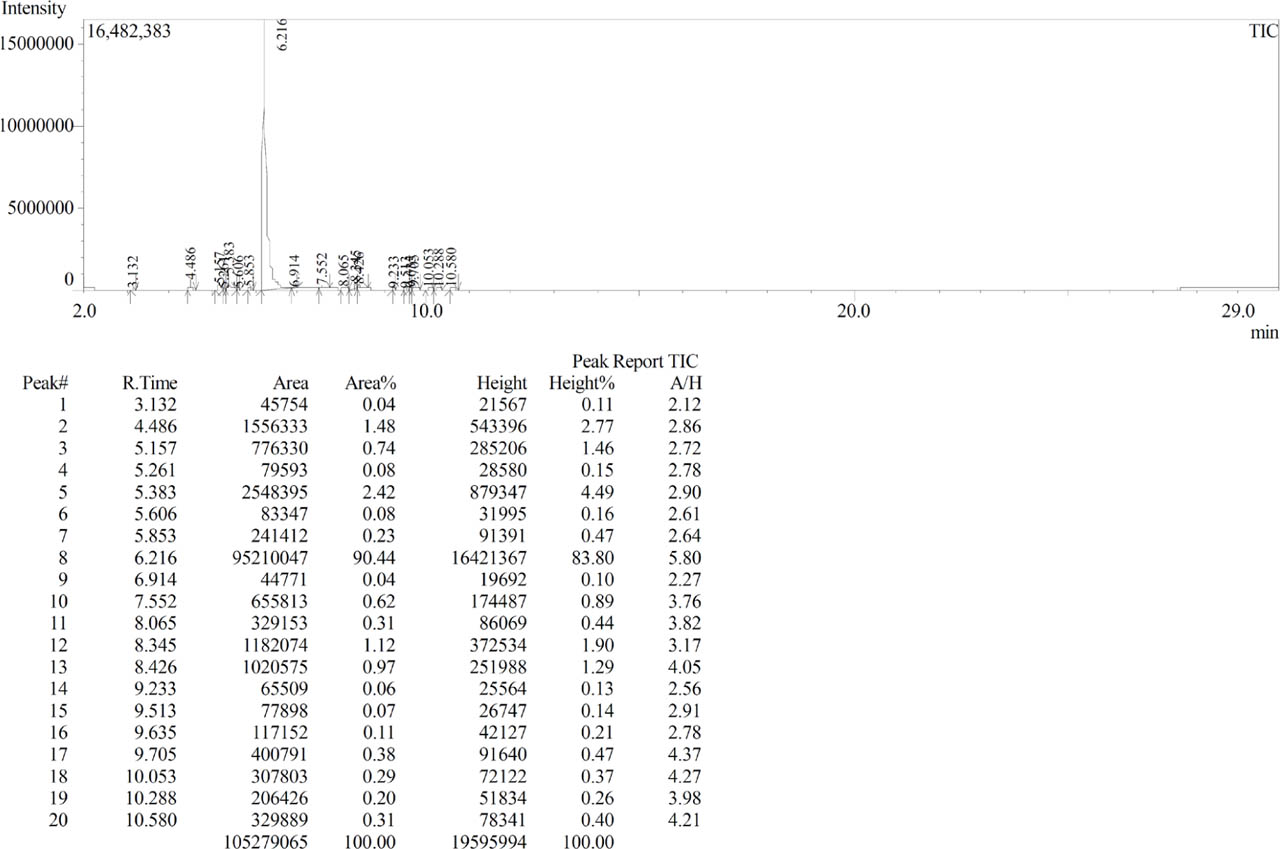
Fig. 1.
Chromatogram of tangerine oil and the information of retention time, area, and height of the detected peaks.
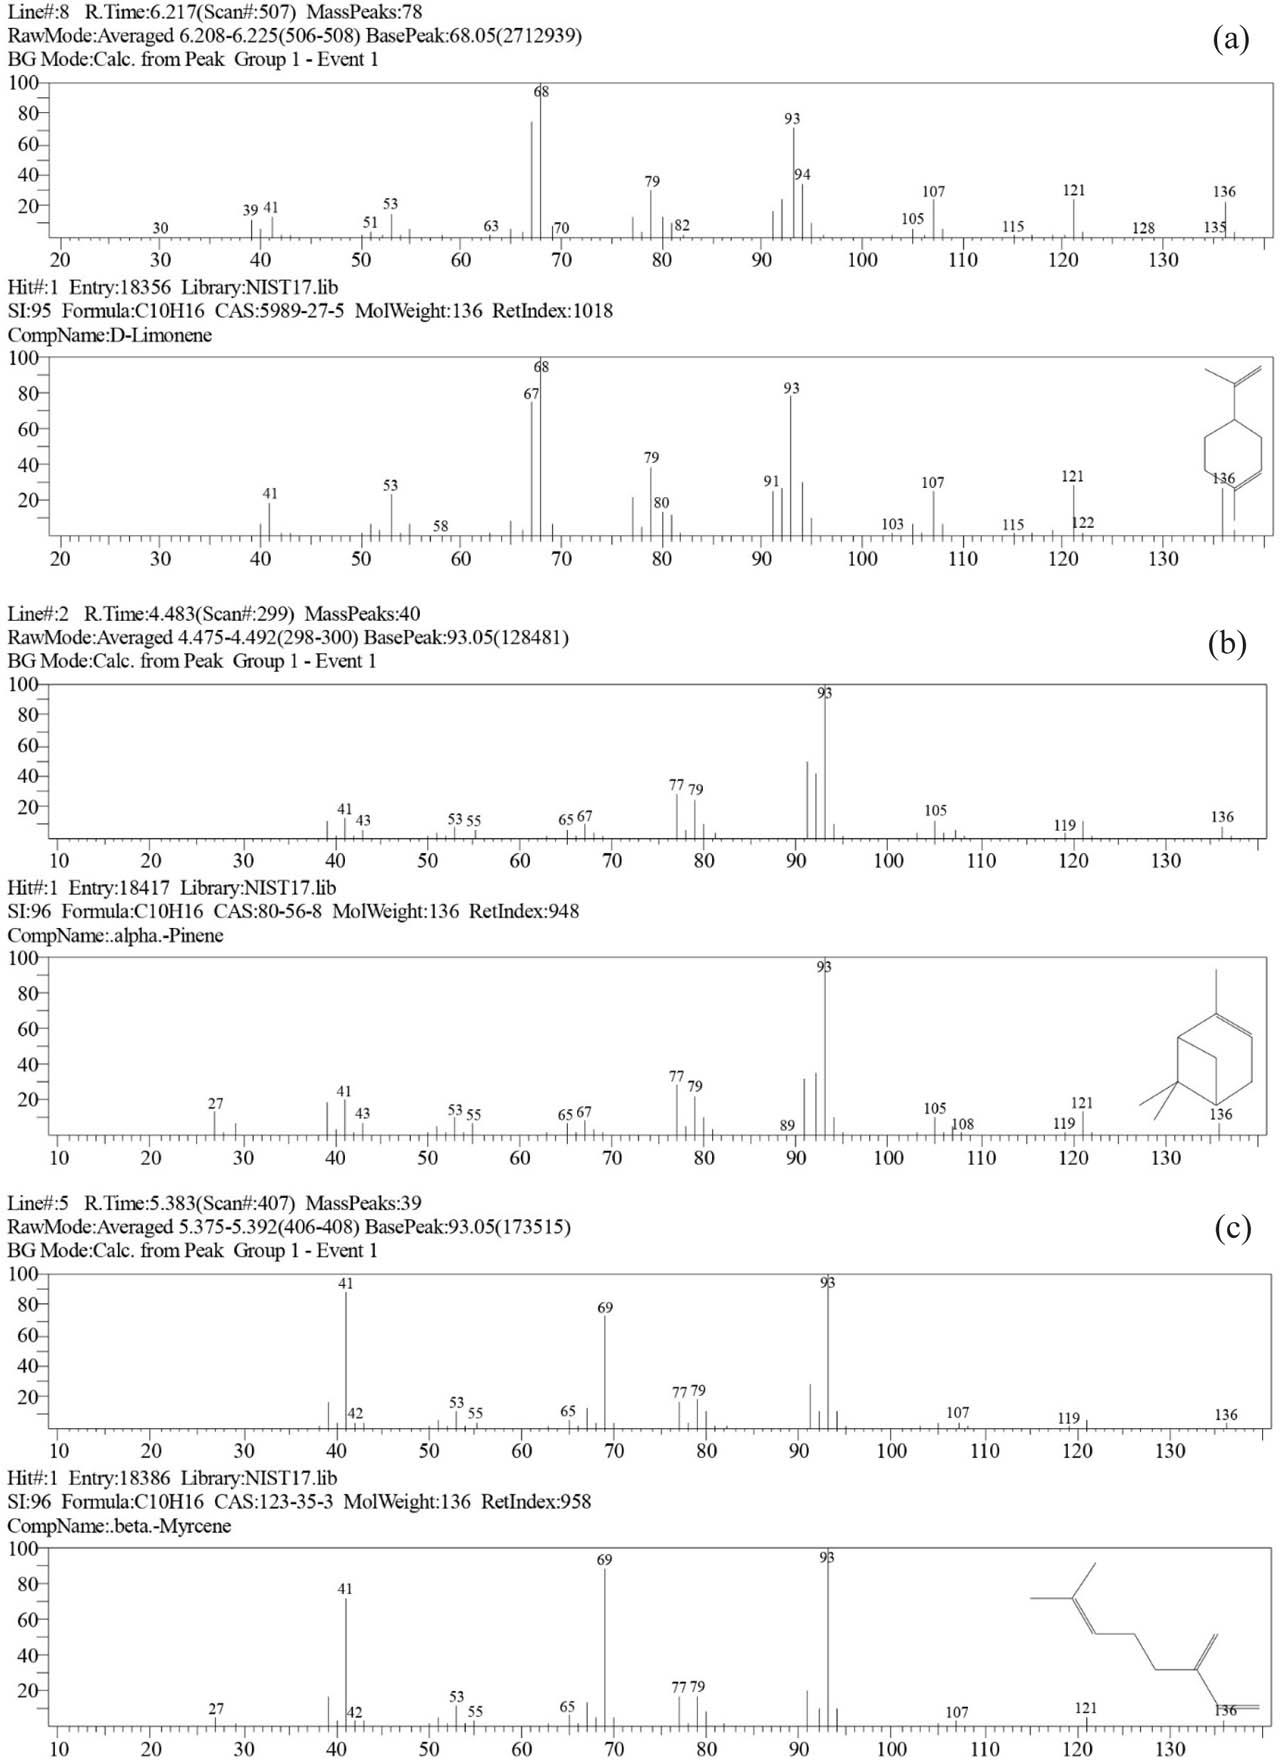
Figure 2.
MS spectra of selected main chemical compounds in tangerine oil, which are (a) D-limonene, (c) α-pinene and β-myrcene
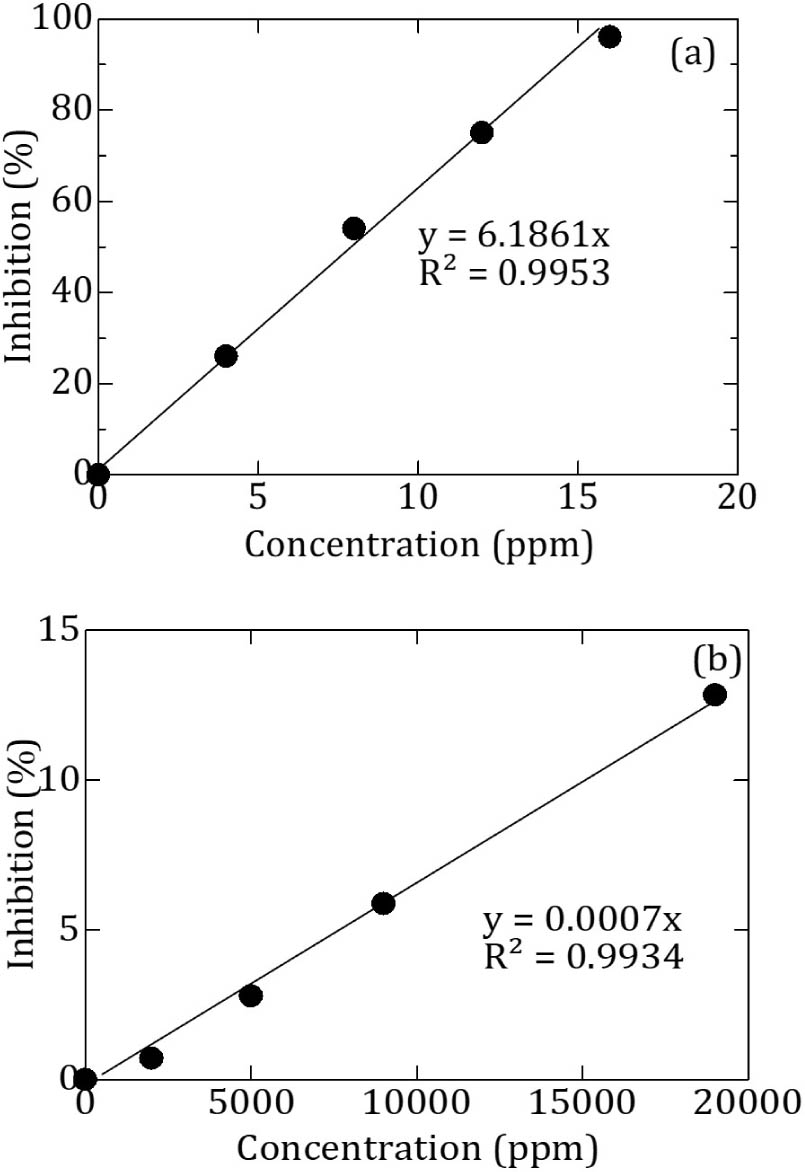
Fig. 3.
Linear plots of DPPH inhibition percentage versus concentration of (a) ascorbic acid and (b) tangerine oil
Table 2.
The evaluation of body lotion sunscreen
| Formulation | pH fresh | Viscosity (cP) | Adhesion (s) | Spreadability (cm) | Particle size (mm) | pH after stability test | SPF value |
|---|---|---|---|---|---|---|---|
| FN | 7.67 ± 0.03 | 1500 | 2.65 ± 0.17 | 5.69 ± 0.15 | 2.03 ± 0.10 | 7.69 ± 0.11 | 12.82 ± 0.07 |
| F1 | 7.66 ± 0.22 | 1300 | 2.58 ± 0.08 | 5.84 ± 0.72 | 2.11 ± 0.26 | 7.80 ± 0.05 | 12.30 ± 0.05 |
| F2 | 7.76 ± 0.12 | 850 | 2.51± 0.05 | 6.06 ± 0.59 | 1.72 ± 0.02 | 7.91 ± 0.05 | 13.19 ± 0.14 |
| F3 | 7.72 ± 0.10 | 600 | 2.15 ± 0.09 | 6.24 ± 0.45 | 2.30 ± 1.15 | 7.89 ± 0.06 | 13.59 ± 0.06 |
| F4 | 7.70 ± 0.35 | 500 | 1.70 ± 0.18 | 6.36 ± 0.18 | 2.22 ± 1.16 | 7.93 ± 0.02 | 13.24 ± 0.08 |
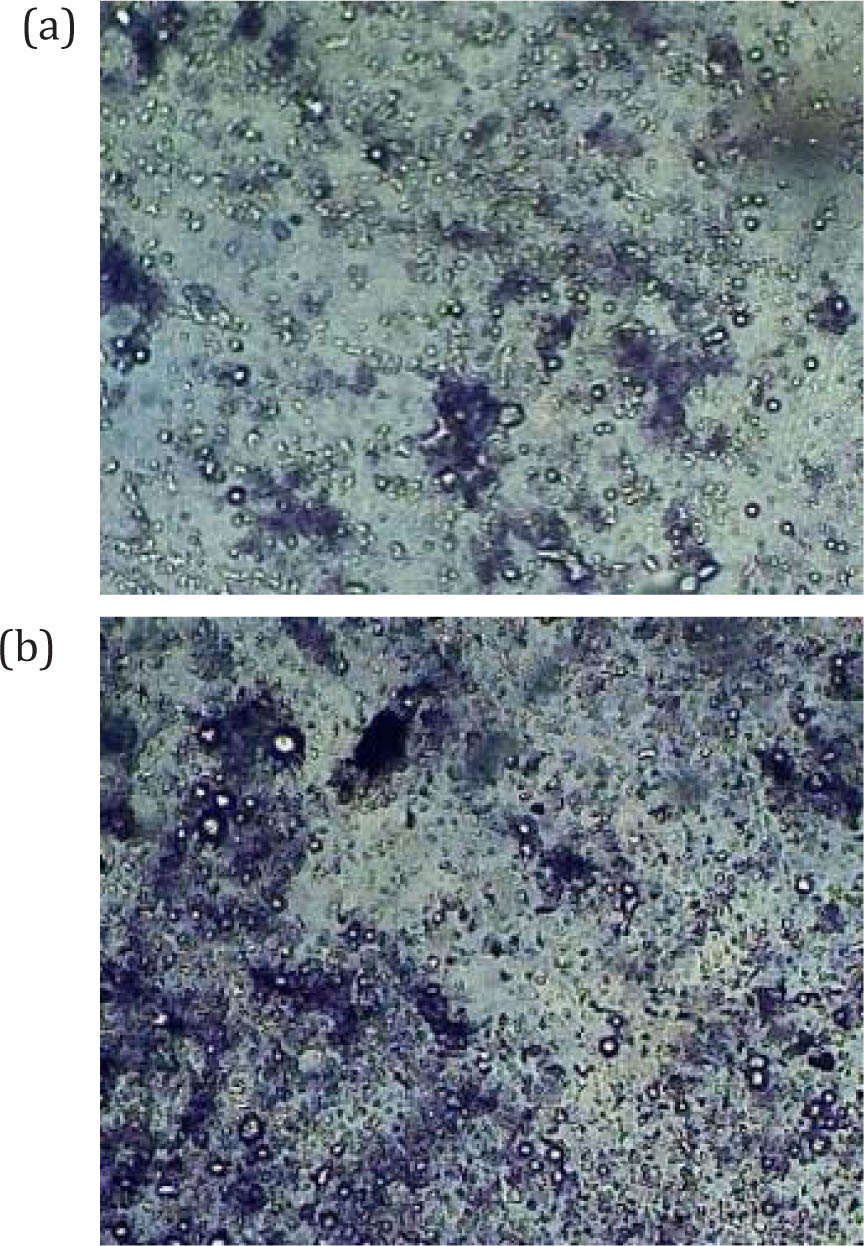
Figure 4.
Micrographs of selected (a) F3 and (4) F4 formulas
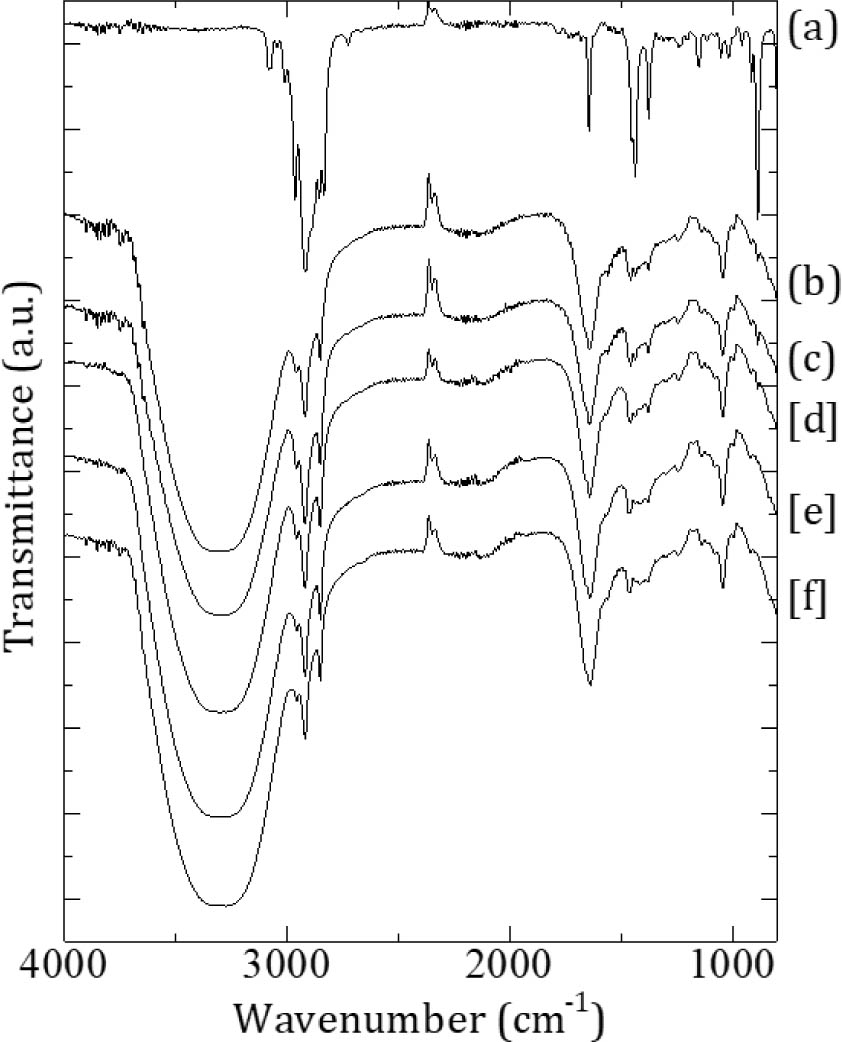
Figure 5.
FTIR spectra of (a) tangerine oil, (b) F4, (c) F3, (d) F2, (e) F1, and (f) FN samples.
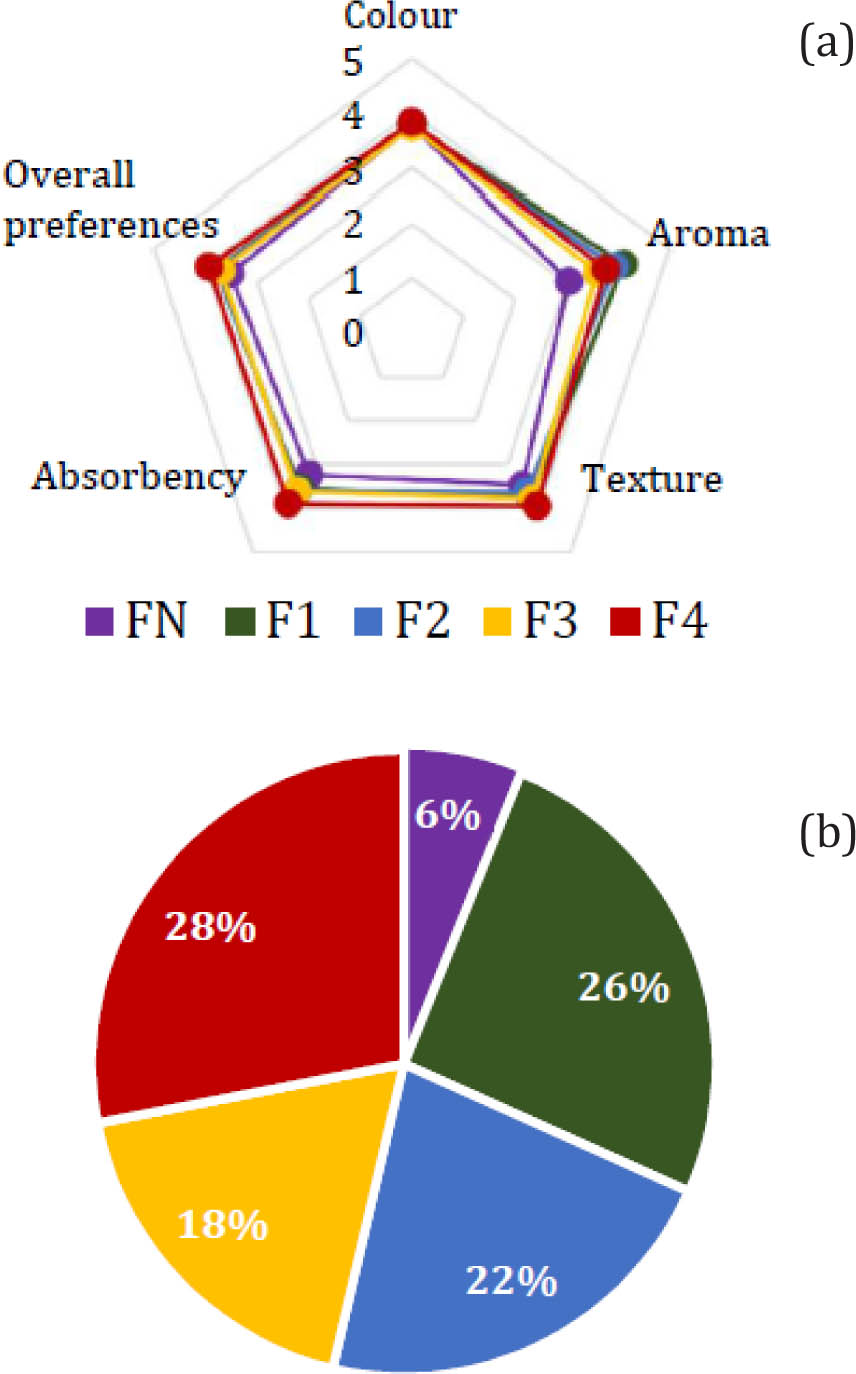
Figure 6.
(a) Spider diagram of hedonic evaluation and (b) percentage pie chart for overall preference