
INTRODUCTION
Topical drug delivery systems are most commonly used and thus the most easily available methods of providing medicines. The most common semisolid dosage forms utilized in the application of topical medicines are creams, ointments, and gels (Jin et al., 2022). Microgels are soft, deformable, and penetrable objects containing an internal gel composed of swollen polymer networks with a dispersing solvent. Their softness and ability to be triggered by external conditions, such as temperature, pressure, pH, ionic strength, and different analytes, make them useful as soft model systems in basic science studies as well as for various uses especially in biological applications (Karg et al., 2019).
Posaconazole (PCZ) is a new antifungal medication that belongs to the triazole class and works by blocking an enzyme called cytochrome P450-dependent lanosterol-14-alpha demethylase (Chen et al., 2020). This blockage disrupts the production of ergosterol, a key component of fungal cell membranes, leading to a buildup of harmful substances and stopping the growth and division of fungal cells. Studies show that PCZ is very effective against various types of fungi, including dermatophyte fungi. It is approved for preventing severe Aspergillus and Candida infections in patients aged 13 years and older who have a high risk of these infections (Lu et al., 2025). As a second-generation triazole, PCZ demonstrates strong antifungal activity, particularly against Candida and Aspergillus species. Compared to Itraconazole, PCZ is two to four times more effective against many types of harmful fungi. It also works against Candida and Aspergillus strains that are resistant to other antifungal drugs like amphotericin B. Graphene and its related materials, such as graphite and graphene oxide, also show different antimicrobial properties, including effectiveness against bacteria, fungi, and viruses (Maertens 2004).
In the field of biomedicine, graphene shows remarkable capabilities for diagnostics and has potential use as a nanocarrier and for delivering drugs. Fungal pathogens such as Aspergillus niger, Aspergillus oryzae, Fusarium graminearum, and Fusarium oxysporum can be inhibited by graphene oxide (GO) or reduced graphene oxide (rGO) (Cao et al., 2024). The introduction of graphene enhances product properties by taking advantage of its large surface area and compatibility with biological systems. Graphene and its derivatives are also effective in tissue engineering and have strong antimicrobial properties, making them ideal for creating hybrid structures useful in various medical applications, including tissue development, healing, and infection management (Sawangphruk et al., 2012). Improving the therapeutic effects of graphene leads to better drug loading and controlled release. Graphene’s sharp edges can disrupt fungal cell membranes, and it has been reported that graphene-based materials cause cell death by the flowing of DNA or RNA cell cytoplasm due to their sharp edge properties. Currently, PCZ is only available as an oral suspension, and no combination with graphene for treating fungal infections exists. Therefore, we aimed to develop a PCG microgel for cutaneous infections caused by A. niger based on current research.
MATERIALS AND METHODS
Drugs and Solvents
The active pharmaceutical ingredient posaconazole (laboratory grade, 98%) was obtained as a gift sample from Neutron Drugs & Pharmaceuticals Private Limited, Hyderabad. Graphene has been procured from Shilpent Enterprises, Nagpur, India. Ethanol, acetone, polypropylene glycol, orthophosphoric acid, Carbopol® 934 (Lubrizol, USA), polyvinyl alcohol, and Tri-ethanolamine (TEA) were purchased from Loba Chemie, Mumbai, India. All other reagents utilized were of analytical grades.
Instruments
The Malvern Zetasizer (Version. 7.11) was used to determine the particle size and poly dispersity index of posaconazole-conjugated graphene (PCZ-G). The FTIR spectrophotometer (Perkin Elmer Ver. 10.4.00) was used to measure the IR spectra of the sample. Morphological characterization of prepared PCZ-G was confirmed using scanning electron microscopy (Nova NanoSEM, FEI, Oregon). Differential scanning calorimetry (DSC) analysis of PCZ-G was carried out on a calorimeter (DSC 131 EVO, KEP Technologies, France). Refrigerated cooling centrifuge (Remi, Mumbai) was used to centrifuge the solution. UV-Vis spectrophotometer (Shimadzu-1700, Kyoto, Japan) was used to estimate entrapment efficiency of the formulation. Digital pH meter (Systronics, 335, India) was used to measure pH of the formulation. Rotational Viscometer (Singhla Scientific, Ambala, Model NDJ-85) was used to measure the viscosity of the gel.
Determination of λmax of PCZ
Absorption spectra of standard solution of PCZ (4mg) in phosphate buffer (pH 6.8) and methanol (7:3; 100 mL) were recorded over the wavelength range of 200–800 nm against solvent blank in quartz cuvettes with 1 cm path length. Preparation of calibration curve was performed by measuring the absorption of working standard solution at a concentration of 10–50 µg/mL. Absorption spectrum of sample solutions at concentrations of 20, 25, 30, 35, and 40 µg/mL was recorded over the wavelength range of 200–800 nm against solvent blank. The λmax was found to be 260.8 nm.
Development of PCZ-loaded microparticles
The emulsion solvent evaporation method was used to develop PCZ-loaded microparticles. First, 500 mg of posaconazole was dissolved in a mixture of ethanol and acetone in a ratio of 1:3, respectively, using ultrasonic vibration at 40 W. Then, this solution was stirred continuously at 750 rpm while injecting 1.5% polyvinyl alcohol (PVA) as stabilizing agent in it at a rate of 1 mL/min. To prevent the coalescence, the mixture was diluted with 100 ml of a 0.5% PVA solution, and the entire blend was kept stirring at 750 rpm under normal conditions. Various batches of PCZ-loaded microparticles were prepared with varying concentrations of independent and dependent variables as shown in Table 1. The resulting solution was subjected to lyophilization to complete evaporation of solvent, and solid microparticles were collected (O’Donnell and McGinity 1997).
Conjugation of PCZ microparticles with graphene
PCZ microparticles were conjugated with graphene using the physisorption technique. The magnetic stirrer has been employed to agitate the 0.25% graphene dispersion with water under the dark environment followed by sonication containing posaconazole microparticles for 10 minutes at 20 W for three different cycles at pH 5.0, further subjected for ultracentrifugation at 3000 rpm for 15 minutes at +4°C. The supernatant was collected for estimation of entrapment efficiency, and the conjugated PCZ-G was collected at the bottom and subjected for characterization (Vishwakarma et al., 2023).
Particle size analysis and characterization of PCZ-G
The particle size was estimated by placing the samples into disposable zeta cells, and the measurement was recorded at 25°C. During each experiment, before changing samples, washing of the cells was done using methanol and then rinsed by the sample, which is to be measured. The IR spectra of posaconazole, graphene, poly vinyl alcohol (PVA), and optimized PCZ-G formulation were obtained by insertion of the samples on KBr plate and analyzed within the range of 400 cm−1 to 4000 cm−1. DSC was performed using Calisto software. The material was accurately weighed onto aluminum pans, and heat flow was measured against an empty reference pan.
DSC scans were recorded at a heating rate of 10°C/minute in temperature range of 30°C–300°C (Singh et al., 2021).
Entrapment Efficiency (EE %)
Entrapment efficiency determination was carried out as per previously reported method of Ghurghure et al. with slight modification. Briefly, 2-mL PCZ-G dispersion was centrifuged for 45 minutes at 10000 rpm at 4°C. The supernatant liquid was taken with the help of micropipette, and entrapment efficiency was calculated at the predetermined wavelength of 260.8 nm by the following equation:
where A is the theoretical weight of drug added and B is the analytical weight of drug in the liquid after centrifugation (Ghurghure et al., 2022).Optimization and Statistical Analysis
The Box–Behnken design (BBD) was used to optimize the compositions of posaconazole with graphene-loaded microparticles using three different levels, three factors, and five center points. The BBD design matrix (Table 2) consisted of 17 runs by employing Stat-Ease 360 software, which has three dependent variable (outcomes), that is, particle size (PS), poly dispersity index (PDI), and EE%. Using three factors, that is, X = PVA concentration (%w/v), Y = stirring speed (rpm), and Z = stirring duration (min), 17 batches of PCZ-G microparticles were formulated. An analysis of variance was carried out at confidence interval of 95% (p < 0.05) to identify the significance of each variable and interaction between variables. For every response, an appropriate regression equation has been generated to measure the impact of independent variables. Contour plots and 3D response surface plots have been developed to determine the relationship between the independent and dependent variables (Singh et al., 2021).
Table 2
BBD of the study and their observed responses
| Run | PVA (%w/v) | Stirring speed (rpm) | Stirring time (minutes) | PS (nm) | PDI | EE% |
|---|---|---|---|---|---|---|
| 1. | 0 | 0 | 0 | 2500 | 0.732 | 70.56 |
| 2. | +1 | 0 | −1 | 3950 | 0.283 | 82.64 |
| 3. | −1 | +1 | 0 | 1500 | 0.991 | 67.87 |
| 4. | 0 | +1 | −1 | 2820 | 0.785 | 53.57 |
| 5. | −1 | 0 | +1 | 4670 | 0.962 | 65.47 |
| 6. | +1 | 0 | +1 | 3800 | 0.214 | 89.18 |
| 7. | −1 | 0 | −1 | 3250 | 0.699 | 68.49 |
| 8. | +1 | −1 | 0 | 1600 | 0.308 | 98.36 |
| 9. | 0 | 0 | 0 | 2300 | 0.652 | 78.08 |
| 10. | 0 | −1 | +1 | 2950 | 0.685 | 73.61 |
| 11. | 0 | 0 | 0 | 2880 | 0.816 | 81.59 |
| 12. | −1 | −1 | 0 | 1540 | 0.708 | 71.38 |
| 13. | 0 | +1 | +1 | 4770 | 0.795 | 58.32 |
| 14. | +1 | +1 | 0 | 2500 | 0.211 | 64.32 |
| 15. | 0 | −1 | −1 | 3230 | 0.610 | 80.85 |
| 16. | 0 | 0 | 0 | 1980 | 0.592 | 69.14 |
| 17. | 0 | 0 | 0 | 2010 | 0.759 | 73.75 |
Formulation of PCZ-G gel
For the development of optimized PCZ-G containing gel, Carbopol 934 (0.5% w/w) was dispersed slowly with stirring in little amount of distilled water, and the aqueous dispersion was kept for 6 h to allow the Carbopol 934 to hydrate. To this Carbopol dispersion, propylene glycol (15% v/v) and propyl 4-hydroxybenzoate (0.2% w/w) added and stirred at high speed (1000 rpm for 5 min). To this mixture, the pellets of optimized PCZ-G were added and stirred to get the gel (1% w/w), and subsequently, the triethanolamine was added drop wise to neutralize the gel to the pH 6, while the solution stirred for 10 min (Singh et al., 2021).
Evaluation of prepared PCZ-G gel
Physical Appearance and Homogeneity
The developed formulation was inspected visually on a black-and-white background for physical appearance such as color, clarity, and homogeneity (Yasser et al., 2024).
Determination of pH of the prepared gel
The pH of formulated gel was measured three times and reported as mean ± SD. The pH meter was previously standardized using pH 4.00 and pH 7.00 standard buffer solutions (Singh et al., 2021).
Determination of viscosity of gel
Viscosity of gel formulations was determined by rotational viscometer as per standard procedure of instrument by placing 100 mL of gel formulation in a 500-mL beaker along with the spindle loop. The spindle number 3 was selected and rpm was set at 60. The viscometer was started, and dial reading was measured after 5 min (to allow the sample to equilibrate). The viscosity in centipoises was estimated. The experiments were performed in triplicate, and observations were recorded as mean ± SD.
Determination of Spreadability
The spreadability of the Carbopol 934 gel bearing PCZ-G was carried out by the method reported by Singh et al. A circle of 2 cm diameter was pre-marked on a glass plate of 12 cm × 12 cm. Five hundred milligrams of gel was placed within this circle, and an another glass plate of the same dimension was placed over the first glass plate. Five hundred gram weight was put on the upper glass plate for 5 min, and the increase in the diameter due to spreading of the gel was noted. The measurement was carried out in triplicate, and the average of three readings was recorded (Singh et al., 2022).
Determination of Extrudability
To ascertain extrudability, the amount of gel that extruded through the tube under a particular load was measured. After cleaning it with butter paper, 8 grams of gel was put into the flexible aluminum tube. Crimps were used to seal the tube, and after 10 seconds, a constant force of one kilogram was applied to the tube. The extrudability of the formulation was measured in triplicate, and the average value has been recorded (Talele et al., 2017).
Drug Content
Two grams of gel was accurately weighed in a 100-mL volumetric flask and was dissolved in methanol (50 mL) by mixing and sonicating the solution for 10 min. The volume was made up to 100 mL with methanol. The resultant solution was filtered using a Whatman filter paper (grade 41); 2 mL of the filtrate was dissolved with 10 mL of methanol in a volumetric flask. The above solution was analyzed in UV–Vis spectrophotometer at λmax of 260.8 nm. The experiments were performed in triplicate, and observations were recorded as mean ± standard deviation.
In Vitro Drug Release Study
In vitro drug release studies of PCZ-G gel formulation were performed using the dialysis bag method reported by Singh et al. (2021). The samples equivalent to 2-mg drug were placed in pretreated dialysis membrane with a 2.4-nm pore size, followed by tying at both sides to form dialysis bag. The dialysis bag was immersed in a 100-mL beaker containing 50-mL mixture of PBS pH 6.8 and methanol (7:3) as release medium. Methanol was added in PBS pH 6.8 to completely solubilize the released PCZ and maintain the sink condition. The beaker was kept under magnetic stirring (100 rpm) at 37.0 ± 0.5 °C. Aliquots of 2 mL samples were withdrawn at predetermined time intervals and replenish with the same amount of diffusion medium. The withdrawn samples were analyzed spectrophotometrically after proper dilutions at λmax of 260.8 nm. The release studies were conducted in triplicate.
Drug Release Kinetics
The drug release kinetics of optimized formulation was examined by fitting the release data to four models including zero order, first order, Higuchi’s square root kinetics, and Korsmeyer–Peppas model to predict the release mechanisms. Linear regression coefficient value (R2) was used as an indicator for the best-fit model. The correlation coefficient value and other model parameters were calculated by Microsoft Excel software.
In Vitro Antifungal Study
The disk diffusion method was applied to evaluate the antifungal activity of prepared microgel as per earlier reported method of Singh et al with trivial modifications. The mean inhibition zone (MIZ) was used as an indicator to measure the antifungal activity. The Sabouraud dextrose agar (SDA) plates were inoculated by spreading with 100 μL of fungal culture, A. niger. The inoculum was prepared by adjusting 0.5 McFarland Unit-Approx cell density (1.5 × 10⁸ CFU/mL from Sabouraud dextrose broth) and followed by placing the discs containing 10 μL of different concentration (0–100 mg/mL). One disc in each plate was loaded with the dimethyl sulfoxide solvent alone which served as vehicle control, and Amphotericin B (50μg) was taken as positive control (PC). The plates of A. niger were incubated in the incubator (Basil Scientific Corp. India) at 37 °C for 48 h. The clear zones created around the disc were measured and recorded in triplicate (Singh et al., 2007).
RESULTS AND DISCUSSION
Determination of λmax of PCZ
The regression equation as per the calibration curve of the standard PCZ was found to be y = 0.0153x − 0.1746. It was found that the solutions show linearity (R2= 0.9651) in absorbance at a concentration of 20, 25, 30, 35, and 40 μg/mL and obey Beer–Lambert’s Law as shown in Fig. 1.
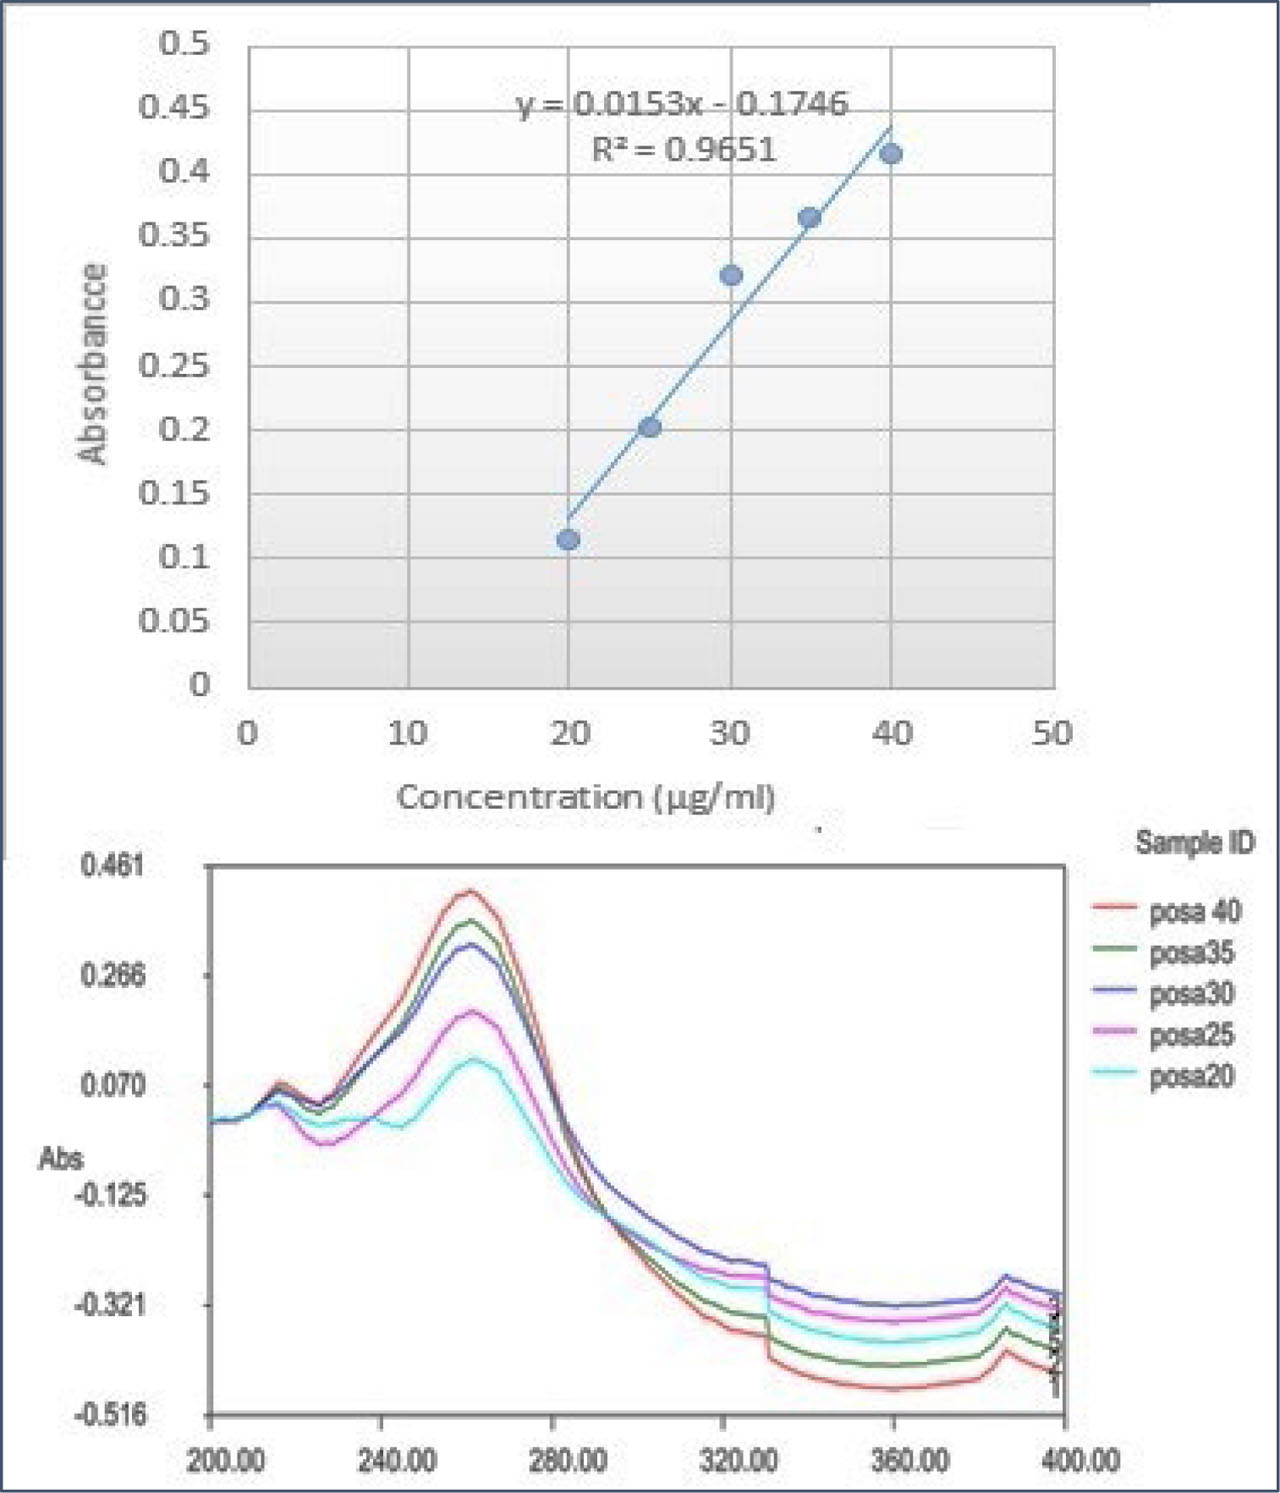
Figure 1
Calibration graph and absorption spectra at various concentrations of posaconazole
Particle size and characterization of PCZ-G
It was found that the optimized formulation had an average particle size of 1506 nm within a range of PDI equal to 0.406. According to the results, the PDI and particle size of the final microparticle formulation were significantly influenced by the amount of stabilizer used, the stirring rate, and the stirring period.
FTIR spectra of posaconazole, graphene, PVA, and optimized formulation along with characteristic peaks were obtained. The FTIR spectrum of posaconazole is shown in Fig. 2A. It showed characteristics peak at 3270 cm−1 corresponding to N–H stretch, 3048 cm−1 corresponding to C–H aromatic stretching, 2996 cm−1 corresponding to C–H stretch, 1684 cm−1 corresponding to C=O stretching, 1509 cm−1 corresponding to C–N stretching, 1397 cm−1 corresponding to C=C aromatic stretching, 1232 cm−1 and 1015 cm−1 corresponding to C–O stretching, and 818 cm−1 corresponding to aromatic p-substitution.
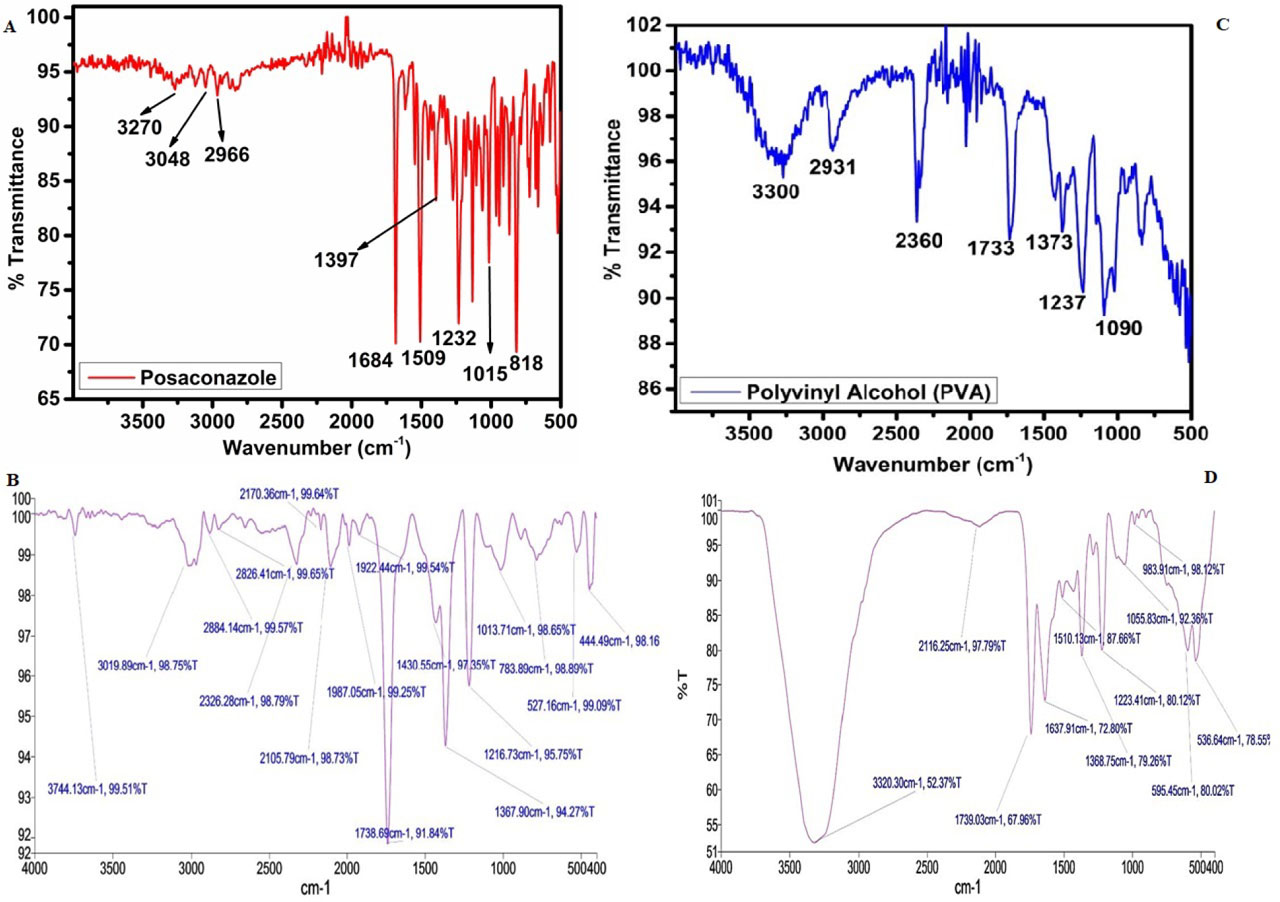
Figure 2
FTIR spectra of posaconazole (A), graphene (B), PVA (C), and PCZ-G (D)
The FTIR spectrum of graphene as shown in Fig. 2B showed characteristics peak at 3019.89 cm−1 corresponding to C–H aromatic stretching, 2884.14 cm−1 and 2826.14 cm−1 corresponding to C–H stretching, 2326.28 cm−1, 2170.36 cm−1, 2105.79 cm−1, 1987.05 cm−1, and 1922.44 cm−1 corresponding to C–C aromatic stretching, 1430.55 cm−1 corresponding to C=C stretching, 1367.90 cm−1, 783.89 cm−1, 527.16 cm−1, and 444.49 cm−1 corresponding to C–H bending, and 1216.73 cm−1 and 1013.71 cm−1 corresponding to C–C stretching. The FTIR spectrum of PVA as shown in Fig. 2C showed prominent characteristics peak at 3300 cm−1 corresponding to O–H stretch (free OH stretch), 2931 cm−1 corresponding to C–H stretching, and 1373 cm−1 corresponding to C–H bending. The FTIR spectrum of optimized formulation showed characteristic peaks at 3320.30 cm−1 corresponding to O–H stretching, 1637.91 cm−1 corresponding to C=O stretching, 1510.13 cm−1 corresponding to C=C aromatic stretching, 1368.75 cm−1 and 983.91 cm−1 corresponding to C–H bending, 1223.41 cm−1 corresponding to C–C stretching, and 1055.83 cm−1 corresponding to C–O stretching as shown in Fig. 2D. It was found that there were no significant differences among characteristics peak of the drug (posaconazole) when compared with the characteristics peak of the drug-loaded formulation. All the peaks were found compatible with other excipients.
FE-SEM was employed to examine the texture and surface morphology of the optimized formulation that showed more or less sphere-shaped particles with smooth surface as shown in Fig. 3.
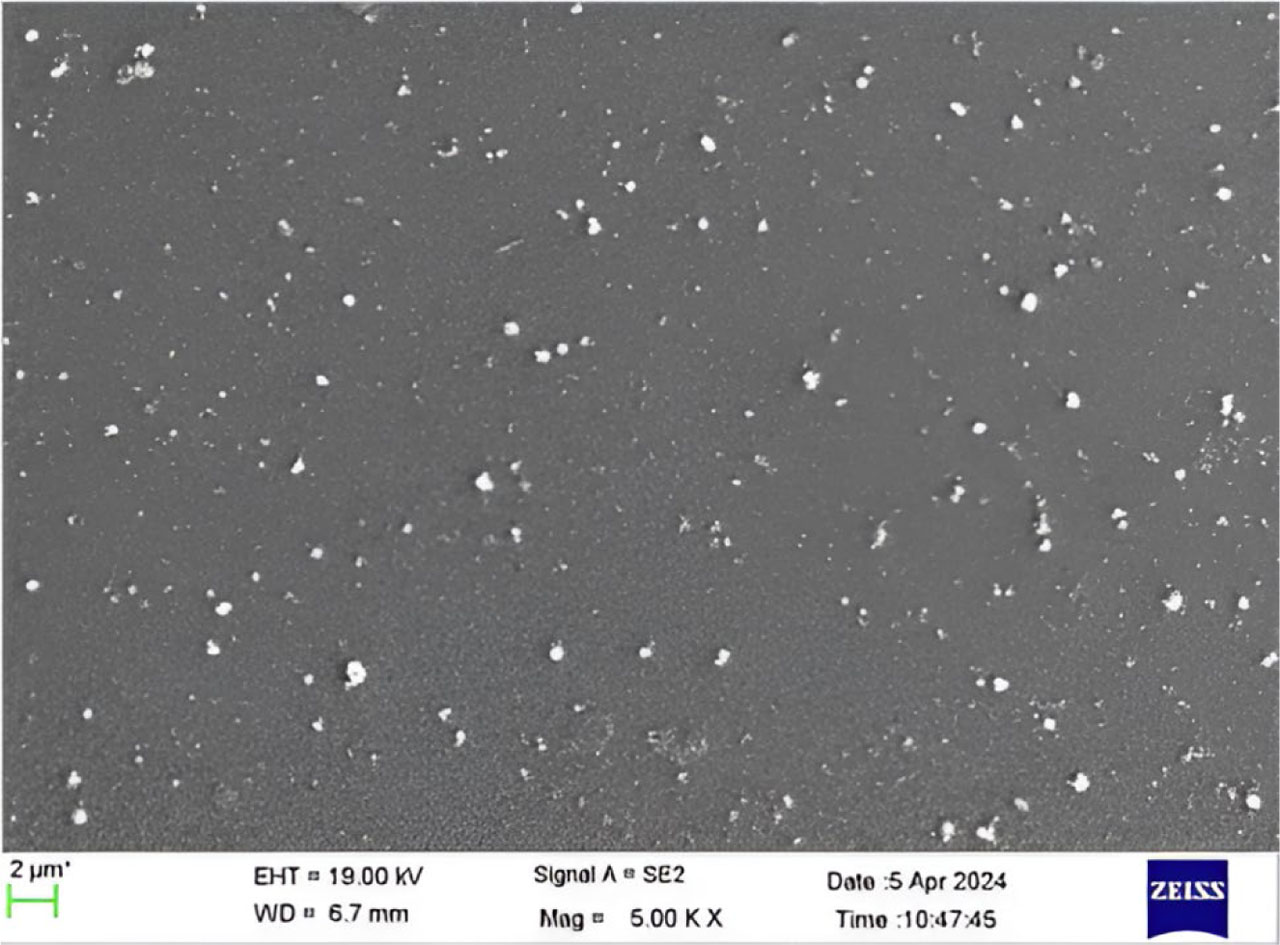
Figure 3
FE-SEM image of PCZ-G
The DSC of the optimized formulation revealed a small peak at 175.14°C and a sharp peak at 53.32°C, both of which are very close to the said melting points of the drug and additives. Therefore, according to More et al., it was proposed that neither the drugs nor the polymers could physically react (More and Ambekar 2016). The thermogram revealed that the drug’s condition remained unaltered as shown in Fig. 4.
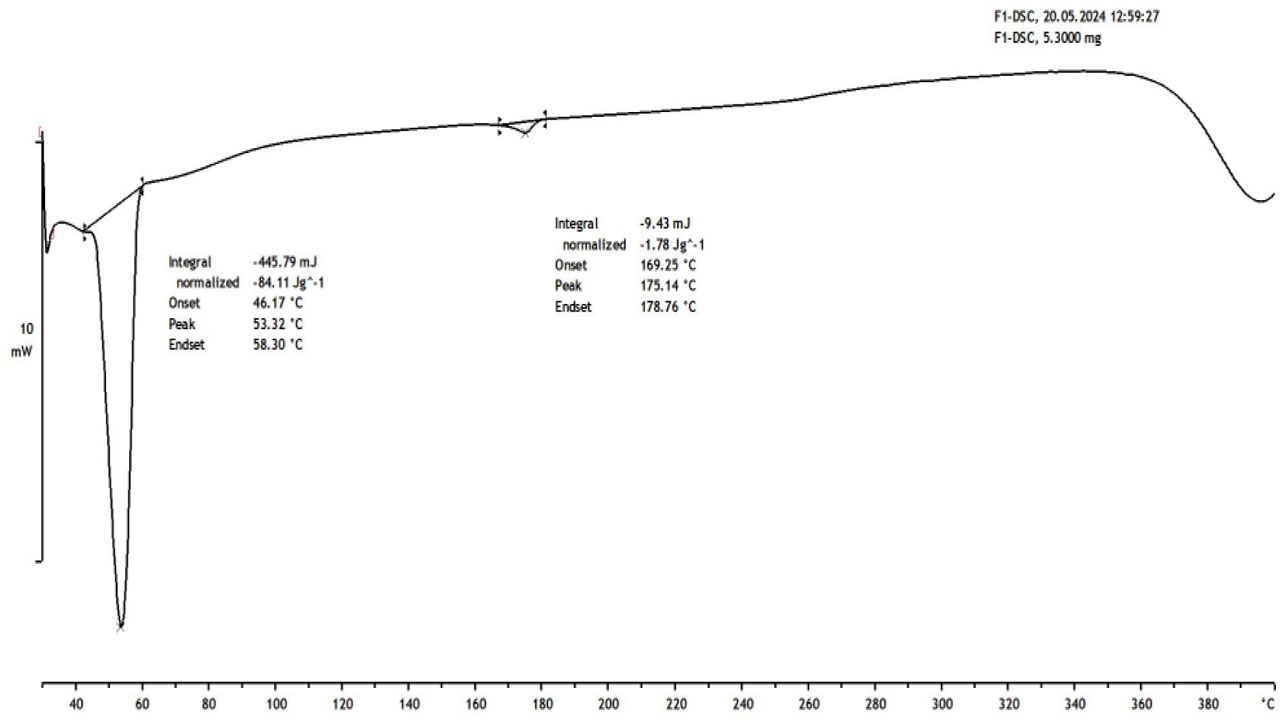
Figure 4
DSC thermogram of PCZ-G
Physicochemical properties of PCZ-G gel
The physicochemical properties of the gel formulation are shown in Table 3. From the observations, it is clearly seen that the prepared optimized gel formulation PCZ-G showed good homogeneity and smooth in texture. The appearance of the gel formulation was black in color with no grittiness. The pH of the prepared gel was found to be 5.89±0.03. The viscosity is an important consideration that influences the drug releases; greater-viscosity could slow down the dissolution of drugs, resulting in a prolonged absorption over an extended period, and they can also increase the gel’s sustainability. The viscosity of optimized PCZ-G was found to be 15.377±6.37 pascal second. An excellent spreading ability could be used efficiently and rapidly, without demanding to be used more than once along with an excessive attempt. The spreadability of optimized PCZ-G was found to be 6.9±0.36 cm, while the assessment of extrudability depends on the viscosity and uniformity of the formulation. In order to avoid phase inversion and to ensure constant efficacy, appropriate extrudability contributes in maintaining the uniformity of the formulation. Extrudability of the optimized formulation was found to be 19.44±0.73 g/cm2.
Drug Content
Drug content of the formulation was determined by the method described by Singh et al (2022). The drug content of the optimized gel was found to be 94.43±1.09% w/w, indicating efficient incorporation of PCZ into the formulation. Considering the theoretical drug concentration of 1% w/w, the actual drug content corresponds to approximately 0.94%w/w.
Entrapment Efficiency (EE %)
An encapsulation efficiency of 97.08±3.69 % w/w was demonstrated by the optimized formulation containing graphene, PVA, and posaconazole. The result shows that the stabilizer concentration, stirring time, and speed have a substantial impact on the encapsulation efficiency of microparticles.
Experimental Design
BBD has been used to optimize posaconazole with graphene-loaded microparticles. Each response had a significant p-value based on the quadratic framework that was statistically examined. A regression formula that was created on each of those responses describes the effects of different variables.
Effects of independent variables on Particle Size (R1)
For different factor-level arrangements, the mean particle size (PS) value of a microparticle with graphene and posaconazole ranged from 1500 to 4770 nm. The resulting regression equation (1) could be used to quantify the impact of independent factors onto PS:
A smaller p-value to 0.0008 indicates that the quadratic framework fit for PS most accurately. The equation regression coefficient number (R2) had been found with a value of 95.14%, indicating a satisfactory fit with the observed and expected values. Out of each of the three variables, the influence of stirring duration and rate was determined to be considerable since the p-value for both instances was ˂ 0.05. As per the literature, on increasing the stirring speed, there will be breakdown of solid aggregates resulting in smaller particle size (Baudonnet et al., 2002). In our study, as the stirring rate increased from 750 to 1000 rpm, PS dramatically reduced, promoting the breakdown of solid particles. In contrast, when the rate of stirring increased to 1000 rpm and the stirring duration is extended to 60 minutes, the particle size of the microparticles appears to reduce significantly as shown in Fig. 5, as indicated with the correlation between variables B and C (p ˂ 0.05), as shown in Table 4. The response surface curve was discovered to be explained by the coefficient that describes the quadratic aspect, B × B, which was determined to be statistically significant (p ˂ 0.05). Table 4 demonstrates that the impact of additional variables, like the PVA ratio, was considered irrelevant (p ˃ 0.05). The influence of stirring duration as well as stirring speed on the PS was represented by contour plots (Fig. 5a) along with 3D response surface plots (Fig. 5b).
Table 4
Coded coefficient and p-value for that coefficient between experimental factors or its combinations and responses
| Constant | A | B | C | AXB | BXC | AXA | BXB | CXC | ||
|---|---|---|---|---|---|---|---|---|---|---|
| PS | Coefficient | 2334 | 111.25 | 283.75 | 367.5 | 117.95 | 557.5 | −37 | −512 | 1620.5 |
| p-value | 0.3841 | 0.049 | 0.018 | 0.3812 | 0.013 | 0.8291 | 0.017 | <0.0001 | ||
| PdI | Coefficient | 0.7102 | −0.293 | 0.058 | 0.034 | −0.095 | 0.016 | −0.167 | −0.011 | −0.003 |
| p-value | <0.0001 | 0.048 | 0.200 | 0.029 | 0.655 | 0.0017 | 0.739 | −0.927 | ||
| % EE | Coefficient | 74.62 | 7.661 | −10.01 | 0.128 | 0.00 | 2.99 | 5.35 | −4.49 | −3.53 |
| p-value | 0.0019 | 0.0004 | 0.937 | 0.00 | 0.224 | 0.044 | 0.079 | 0.150 |
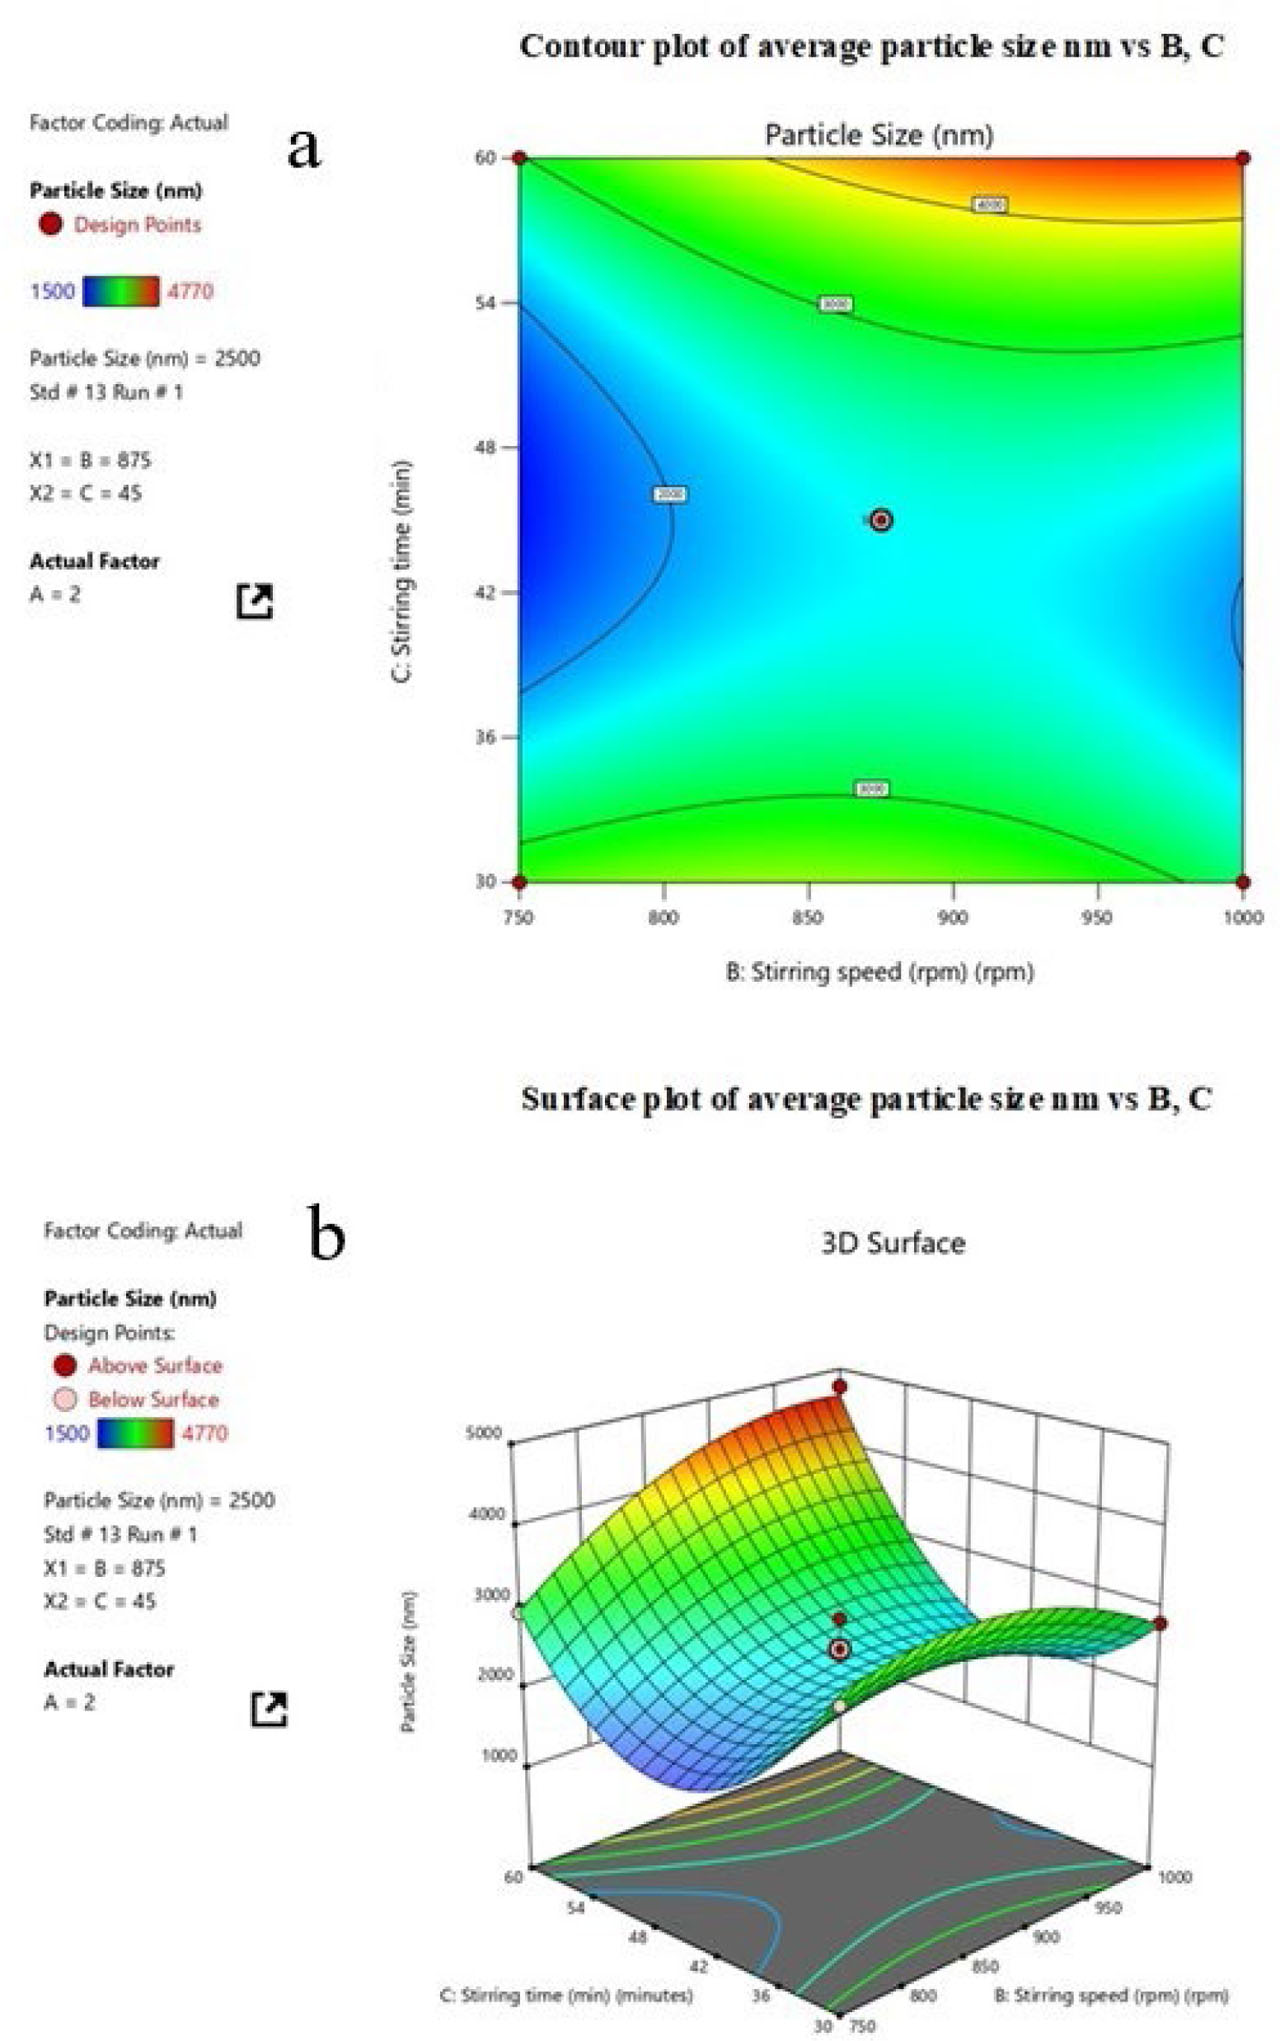
Figure 5
Effect of independent variables on PS: (a) contour plots and (b) 3D response surface plots
Effect of independent variables on PDI (R2)
For various numbers of aspects, the PDI for a microparticle with posaconazole and graphene ranged between 0.211 and 0.991. The resulting regression equation (2) could be used to quantify the impacts of independent factors on the PDI:
The quadratic framework’s p-value was assessed to be p ˂ 0.001, indicating that the mathematical approach was most appropriate for PDI. Equation 2’s regression coefficient value (R2) was determined to be 96.37%, indicating a strong fit to both the expected and observed data.
The effects of PVA contents (p ˂ 0.0001) and the speed of stirring (p< 0.05) were determined to represent the greatest significance across all three factors. As per literature, with low to moderate PVA concentration, aggregation of particle is less; hence, the PDI value is also low (Attia Shafie and Mohammed Fayek 2013). In our study, high PDI with low stirring speed and moderate PVA concentration results a low PDI value. Additionally, it was discovered that PDI substantially decreased when stirring duration decreased (p ˂ 0.05). That could be because of the consistent use of shearing pressure, resulting in uniform microparticle distribution.
The surface response curve as shown in Figure 7 has been demonstrated to be explained by the statistically significant (p ˂ 0.01) value that describes the quadratic component, A × A. With respect to factors A × B, there is significant decrease in PDI with p<0.05. Plots of contours (Fig. 6a) and 3D response surface plots (Fig. 6b) were applied to illustrate how PVA concentration and stirring speeds influenced PDI.
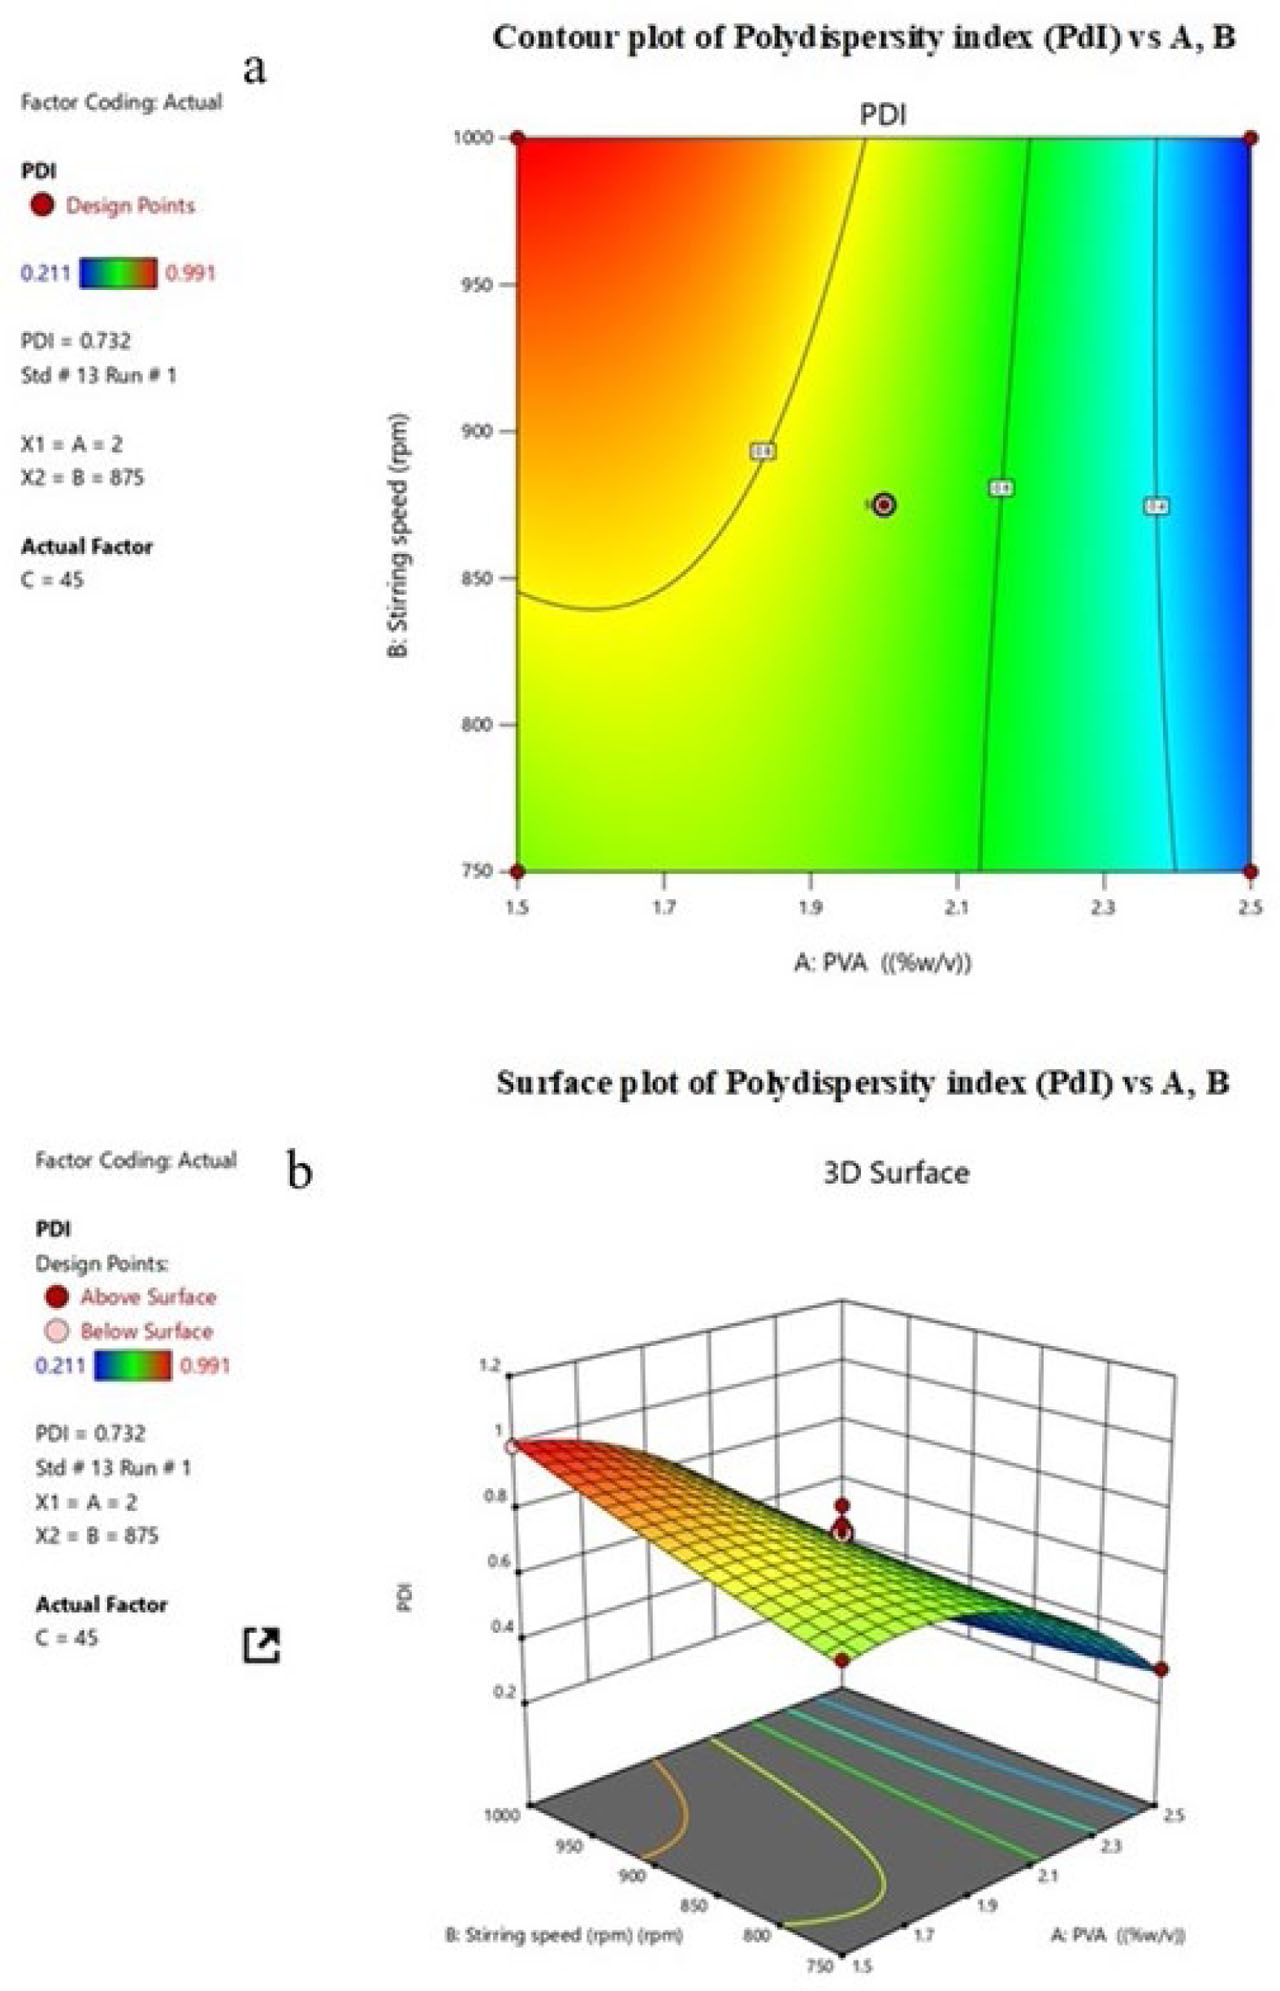
Figure 6
Effect of independent variables on PDI: (a) contour plots and (b) 3D response surface plots
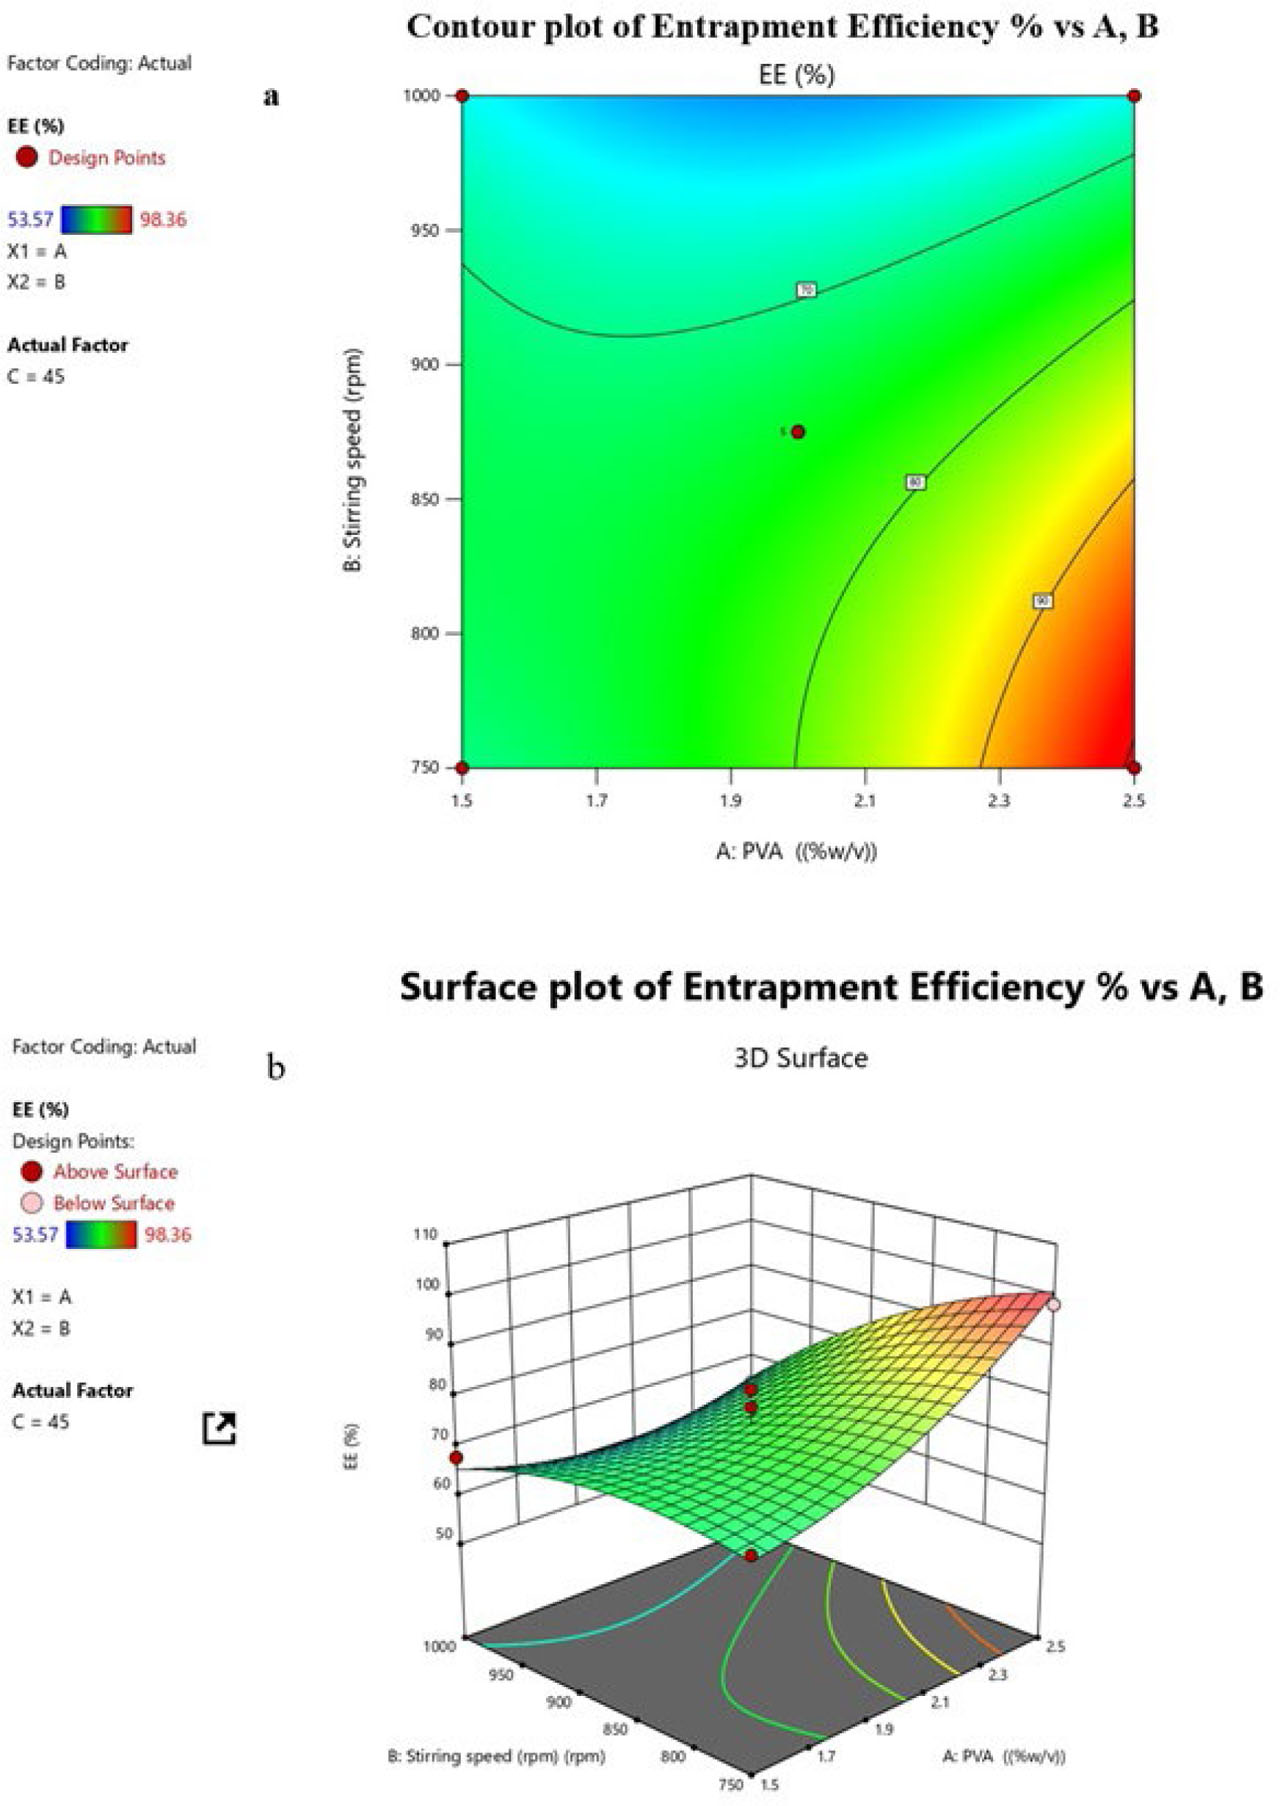
Figure 7
Effect of independent variables on EE%: (a) contour plots and (b) 3D response surface plots
Effect of independent variables on entrapment efficiency (R3)
For several factor-level configurations, the rate of entrapment of microparticles with graphene and posaconazole has been found ranging from 53.57% to 98.36%. The resulting regression equation (3) could be used to evaluate the impact of variables on EE:
EE was most accurately predicted using the quadratic framework, as indicated in the p-value of ˂ 0.01. Equation 3’s regression coefficient value (R2) has been found to be 92.75%, indicating an excellent correlation with the observed and expected outcomes. With the coefficient p-value < 0.01, the PVA and stirring speed variables determined to be statistically significant. As per literature at moderate concentration of PVA, there is an increase in entrapment efficiency (Sharma et al., 2016). Entrapment efficiency increases with enhanced homogenization up to an optimum level, but on increasing the speed, it decreases due to drug leakage (Crucho and Barros 2017). Moreover, our study justifies that at 2.5% w/v PVA and at 752.93 rpm, the entrapment efficiency is optimum. This may be due to increased interfacial stability resulting in better encapsulation of poorly water-soluble drugs. Other parameters such as stirring time show no significant effect (p ˃ 0.05). The entrapment efficiency is optimum as the correlation between the variables A and B are significant (p <0.05). Fig. 7a and 7b, accordingly, displays contour plots with 3D surface response plots that illustrate the impact of PVA and stirring speed on entrapment efficiency.
Optimization of Experimental Model
In order to obtain the expected response, the mathematical optimization approach was utilized through an optimization chart. This included determining the objectives (mathematical limitations) to all responds, providing each an equal significance value. Table 5 uses the software responsive optimization, and the desirability value was examined in order to forecast the ideal formulation. In order to determine how effectively the parameter choices accomplish their response targets, software generated the optimum settings to each variable in respect to desirability levels. Each of the responses had received unique desirability of 0.969, thus near to approximately 1. These results demonstrated that responses to targets were achieved. Table 6 displays the variables and values that BBD determined to produce the optimal formulation using expected results.
Validation of Experimental Design
The optimized approach was confirmed by formulating a novel batch for posaconazole and graphene-loaded microparticles using expected variable settings and calculating percent bias based on the observed results as given in Table 7. Bias analyzes the discrepancies between the expected number and the discovered mean value. Findings regarding PS, PDI, and EE demonstrated minimal percent bias. The results, thus, confirm the accuracy of the observational framework across different outcome estimates.
In vitro Drug Release Study
The drug release from optimized formulation was found to be 93.83±1.07 % within 10 hours. The cumulative drug release value indicates the total percentage of the drug that was released from the formulation over the specified time. This result showed that the optimized formulation released, on average, 93.83% of its drug content after 10 hours, with the standard deviation of 1.07, which indicates a low variability in the release rate across the samples tested. The first-order kinetic plot (Figure 8) does not demonstrate satisfactory linearity (R2 = 0.61), indicating poor model fitting; hence, it is clearly stated that the first-order model does not adequately describe the drug release kinetics. A release rate spread over 10 hours suggests a sustained-release mechanism, rather than an immediate, rapid release. In this case, R2 value of 0.9797 means that the Higuchi kinetic model is an excellent fit for the release profile, confirming that diffusion is the dominant mechanism governing the drug’s release as shown in Table 8 and Fig. 8. However, the regression equation obtained for the Higuchi plot showed a small non-zero intercept, indicating slight deviation from ideal Higuchi behavior. This deviation may be due to the initial burst release of drug molecules present near the surface of the formulation or structural heterogeneity within the matrix system.
Table 8
In Vitro Drug Release Kinetics Model
| S. No. | In vitro drug release kinetics model | Parameters (R2 values) |
|---|---|---|
| 1. | Zero-order kinetics | 0.9638 |
| 2. | First-order kinetics | 0.6112 |
| 3. | Higuchi release kinetics | 0.9797 |
| 4. | Korsmeyer–Peppas model | 0.9619 |
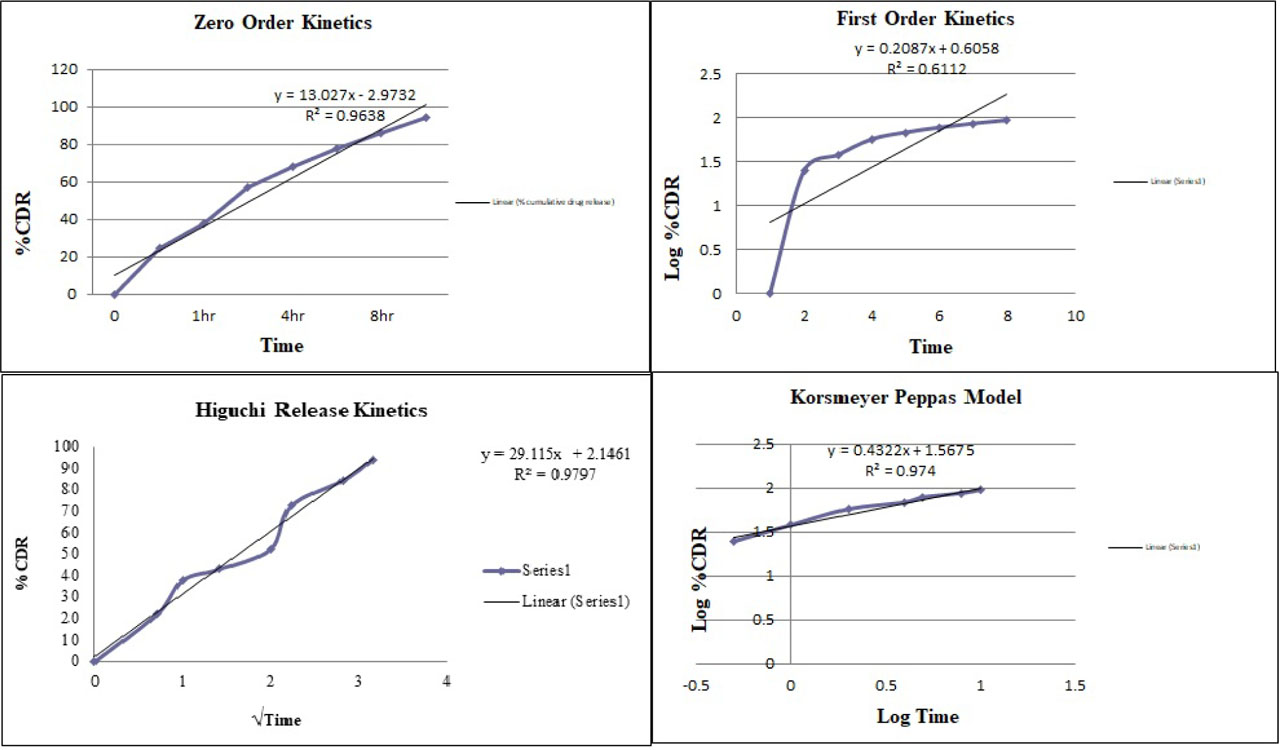
Figure 8
In vitro drug release analysis
In Vitro Antifungal Study
A. niger has been reported to cause many skin diseases including cutaneous aspergillosis. In this research, A. niger (MTCC281) had been used as standard strain to assess the in vitro antifungal activity of prepared microgel. Mean inhibition zone (MIZ) of the plates was calculated by measuring the mean diameter of MIZ after application of PCZ-G gel (1% w/w) in the wells. PCZ-G gel (1% w/w) exhibited concentration dependent anti-fungal activity 22.66± 0.68 at 500 µg/disc and 23±0.28 at 1000 µg/disc, whereas Amphotericin B (PC) at 50 µg/disc showed 15.66± 0.70 mm zone inhibition as shown in Fig. 9. Higher in vitro antifungal activity of PCZ-G microgel confirmed the enhancement of physicochemical characteristics of posaconazole and graphene after its incorporation in microgel system.
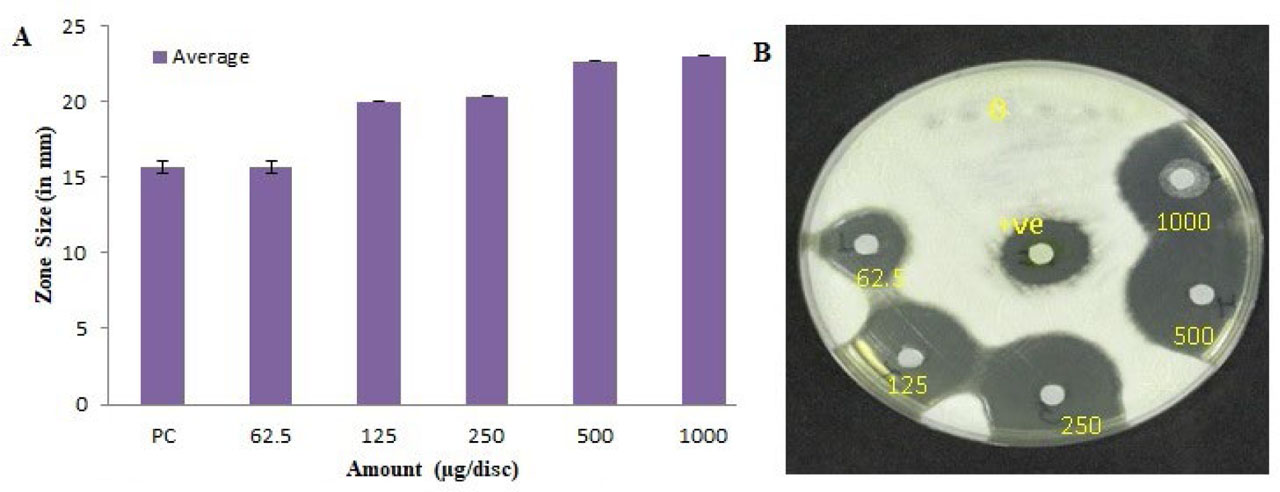
Figure 9
Antifungal activity of PCZ-G gel (A), plate showing zone of inhibition (B)
CONCLUSION
In the present study, a posaconazole-conjugated graphene (PCZ-G) microgel was successfully developed, optimized, and evaluated as a topical delivery system for the treatment of cutaneous fungal infections caused by A. niger. The formulation was systematically optimized using the Box–Behnken design, which demonstrated a significant influence of PVA concentration, stirring speed, and stirring time on particle size, polydispersity index, and entrapment efficiency. The optimized PCZ-G microgel exhibited a desirable particle size (~1506 nm), narrow size distribution, high entrapment efficiency (97.08±3.69%), and satisfactory drug content (94.43 ± 1.09%), confirming the robustness of the experimental design and formulation approach. Physicochemical characterization by FTIR, DSC, and FE-SEM confirmed successful drug incorporation, compatibility between components, and the formation of spherical micro-range particles with stable structural properties. The physicochemical parameters, viz., pH (5.89±0.03), viscosity (15.377±6.37 pa.s), and spreadability (6.9±0.36 cm), indicate that the data lie within the acceptable physiological range for topical formulations, indicating good compatibility with skin. The optimized microgel demonstrated sustained drug release over 10 hours, with release kinetics best described by the Higuchi model, indicating sustained release behavior. Importantly, the PCZ-G microgel showed significantly enhanced in vitro antifungal activity against A. niger compared to the standard Amphotericin B. Overall, these findings suggest that the PCZ-G microgel is a promising topical drug delivery system capable of enhancing antifungal performance. Although the study was limited to in vitro evaluation against a single fungal strain, the results provide a strong foundation for further investigations.