
Table 1.
Composition of formulations.
| Formulation | PF127 (% w/w) | MC (% w/w) | SA (% w/w) | AgNam (% w/w) |
|---|---|---|---|---|
| PMSA 0.2 | 15.00 | 0.25 | 0.20 | - |
| PMSA 0.3 | 15.00 | 0.25 | 0.30 | - |
| PMSA 0.4 | 15.00 | 0.25 | 0.40 | - |
| PMSA 0.5 | 15.00 | 0.25 | 0.50 | - |
| PMSA 0.6 | 15.00 | 0.25 | 0.60 | - |
| PMSA 0.7 | 15.00 | 0.25 | 0.70 | - |
| PMSA 0.8 | 15.00 | 0.25 | 0.80 | - |
| PSA | 15.00 | - | 4.00 | - |
| PMSA | 15.00 | 0.25 | 4.00 | - |
| MSA | - | 0.25 | 4.00 | - |
| SA | - | - | 4.00 | - |
| PMSA AgNam | 15.00 | 0.25 | 4.00 | 1.00 |
Table 2.
Appearance and injectability of sols and gels.
| Formulation | Appearance | Injectability (needle diameter) | ||||
|---|---|---|---|---|---|---|
| Sol | Gel | 0.5 mm | 0.6 mm | 0.7 mm | 0.8 mm | |
| PMSA 0.2 | +++ | − | + | ++ | ++ | +++ |
| PMSA 0.3 | +++ | − | + | + | ++ | +++ |
| PMSA 0.4 | +++ | +++ | + | + | + | +++ |
| PMSA 0.5 | +++ | +++ | + | + | + | +++ |
| PMSA 0.6 | +++ | +++ | + | + | + | ++ |
| PMSA 0.7 | ++ | ++ | + | + | + | ++ |
| PMSA 0.8 | ++ | ++ | + | + | + | ++ |
| PSA | +++ | − | − | − | + | + |
| PMSA | +++ | − | − | − | + | + |
| MSA | ++ | − | − | + | + | + |
| SA | ++ | − | − | + | + | + |
| PMSA AgNam | + | − | − | − | + | + |
Table 3.
pH and critical sol–gel transition temperature of the formulations.
| Formulation | pH ± SD (n = 3) | Tsg (°C) ± SD (n=3) |
|---|---|---|
| PMSA 0.2 | 6.78 ± 0.00 | - |
| PMSA 0.3 | 6.72 ± 0.00 | - |
| PMSA 0.4 | 6.70 ± 0.00 | 34.10 ± 0.28 |
| PMSA 0.5 | 6.68 ± 0.01 | 33.36 ± 0.13 |
| PMSA 0.6 | 6.64 ± 0.00 | 32.66 ± 0.17 |
| PMSA 0.7 | 6.61 ± 0.00 | 33.60 ± 0.08 |
| PMSA 0.8 | 6.60 ± 0.01 | 31.50 ± 0.36 |
| PSA | 6.16 ± 0.02 | - |
| PMSA | 6.26 ± 0.00 | - |
| MSA | 5.84 ± 0.00 | - |
| SA | 5.75 ± 0.01 | - |
| PMSA AgNAM | 5.61± 0.02 | - |
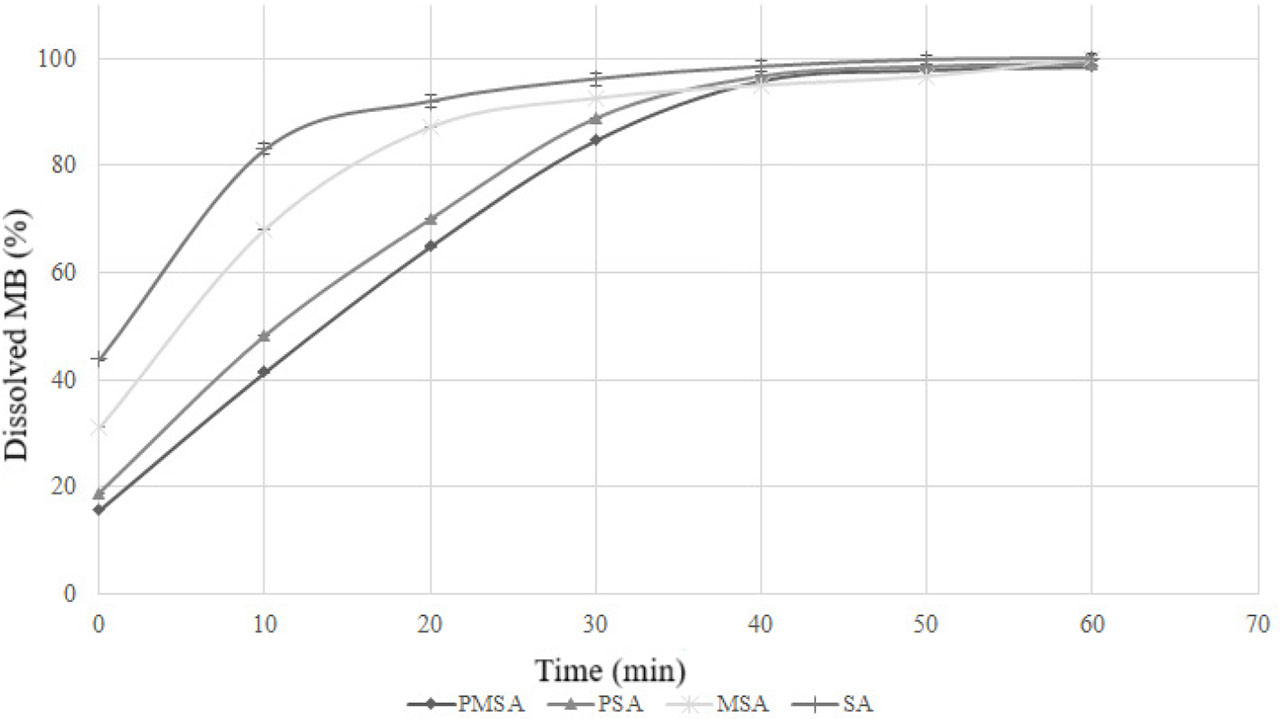
Figure 1.
Dissolution profile of methylene blue.
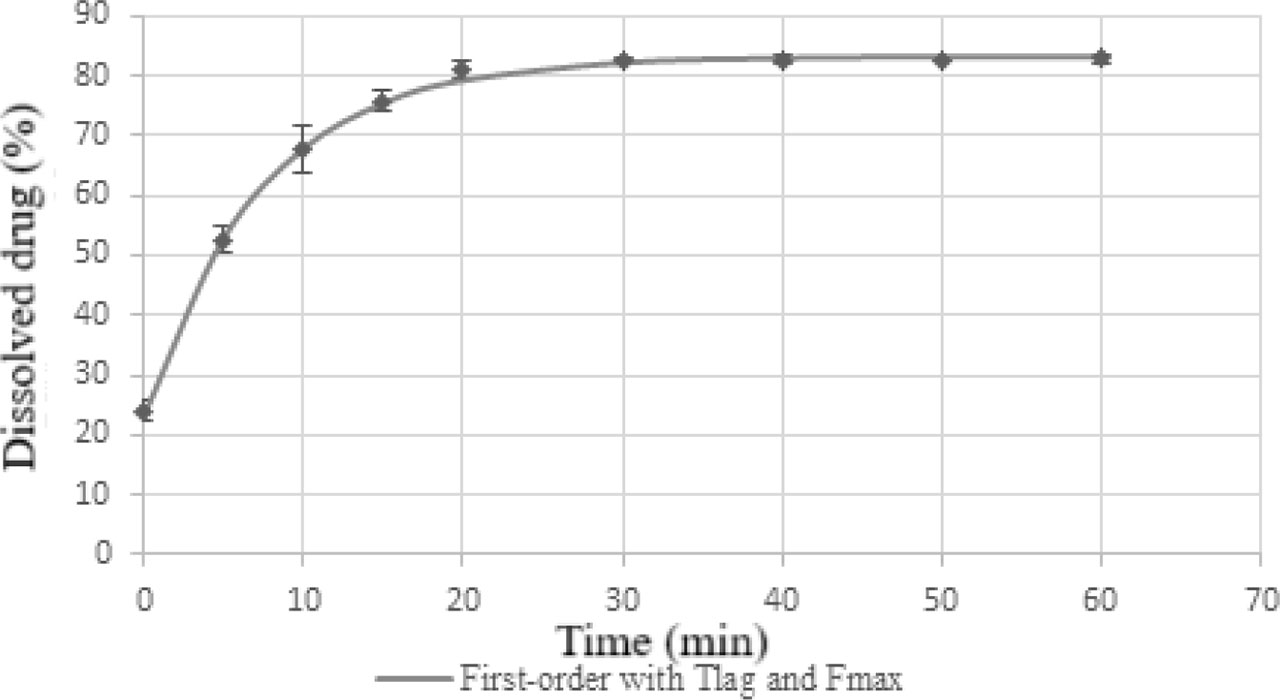
Figure 2.
Dissolution profile of PMSA AgNam.
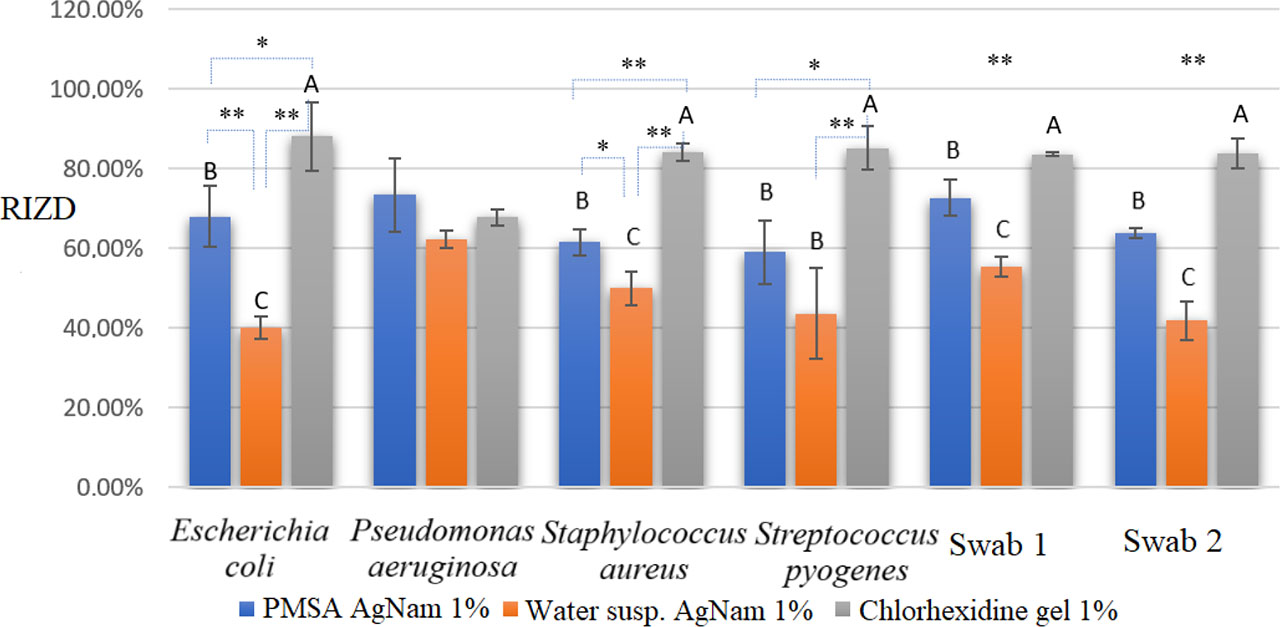
Figure 3.
Antibacterial activity of PMSA AgNam. n = 3 ± SD. A, B, C represent statistically significant differences in the efficacy of tested samples. Values marked with the same letter are not significantly different from each other. Statistically significant differences are marked as follows: * for p < 0.05; ** for p < 0.01; *** for p < 0.001. The same significance applies for swab 1 and 2 for all pairs.
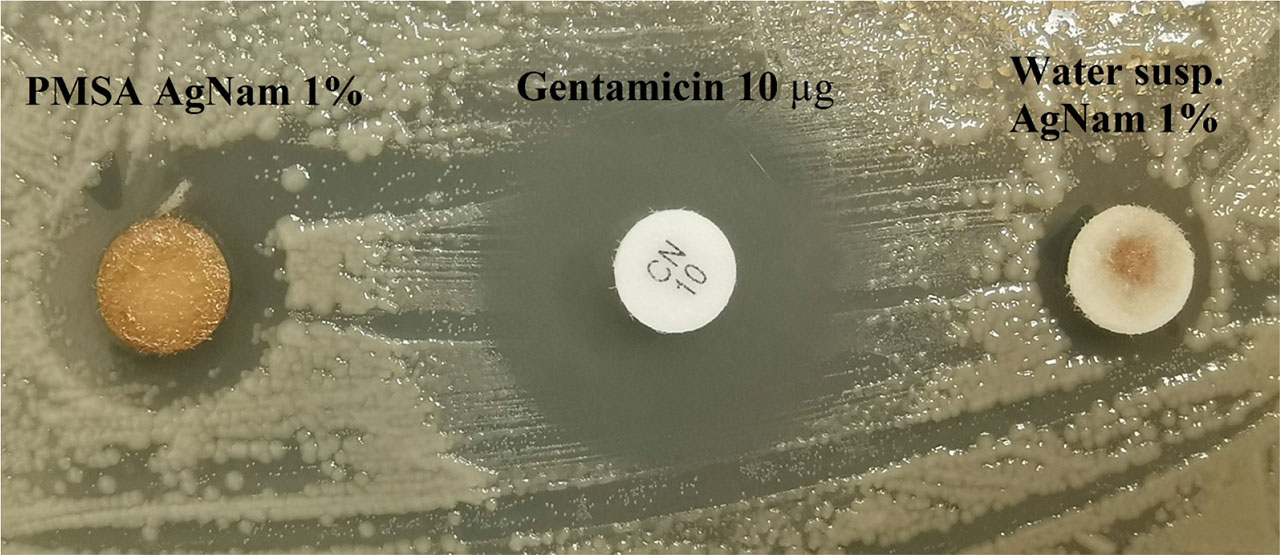
Figure 4.
Inhibition zones for Streptococcus pyogenes.