
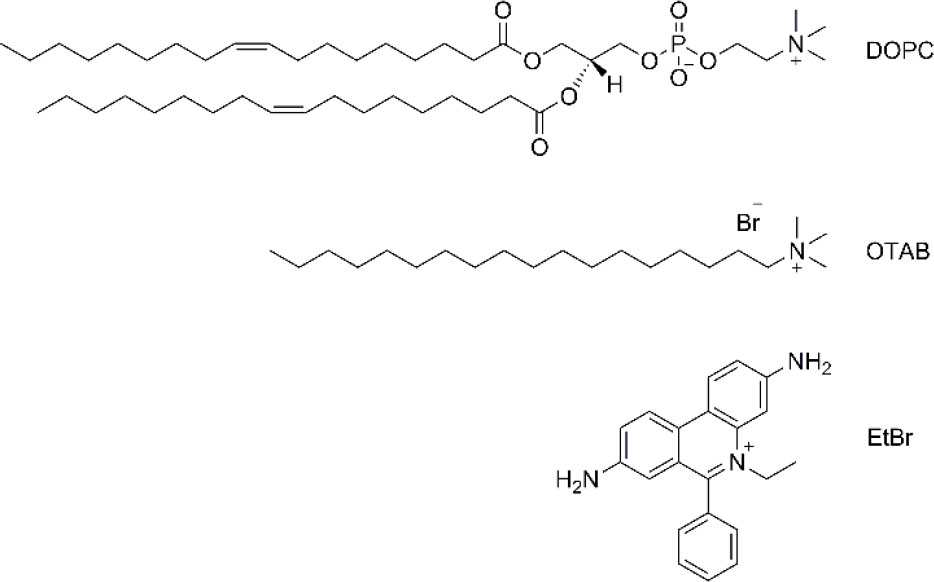
Figure 1.
Structures of DOPC, OTAB and EtBr.
DOPC: 1,2-dioleoyl-sn-glycero-3-phosphocholine, OTAB: octadecyltrimethylammonium bromide, EtBr: 3,8-diamino-5-ethyl-6-phenylphenanthridinium bromide
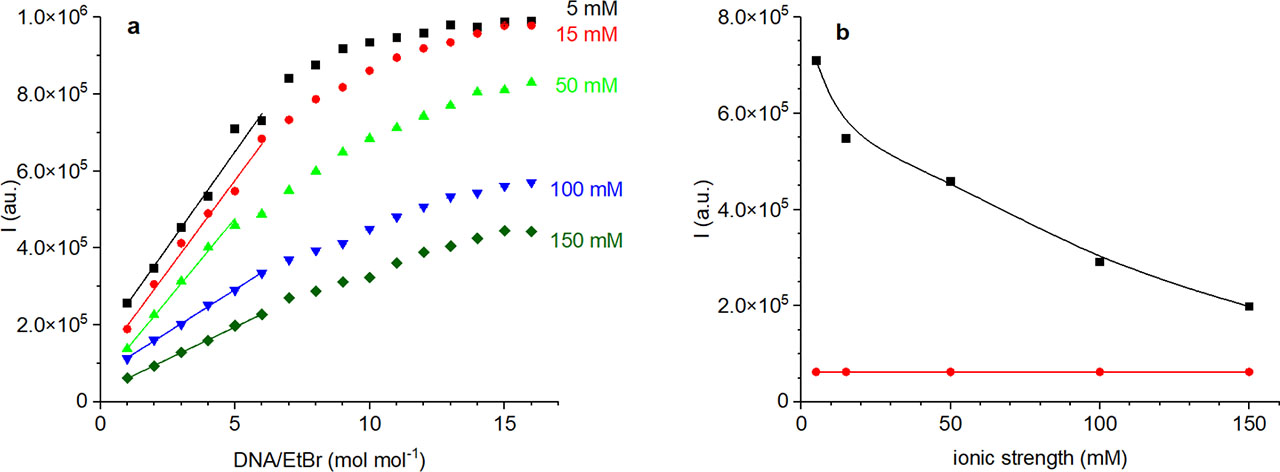
Figure 2.
(a) Dependences of the emission fluorescence intensity I of complex DNA + EtBr on DNA/EtBr mole ratio at different NaCl ionic strengths. Error bars are within the size of the symbols. Lines represent the best linear fits of respective experimental data. (b) Dependences of the fluorescence intensity I of DNA/EtBr = 5:1 mol mol−1 complex (▪) on the ionic strength compared to pure EtBr ( ). Curves are a guide to the eyes only.
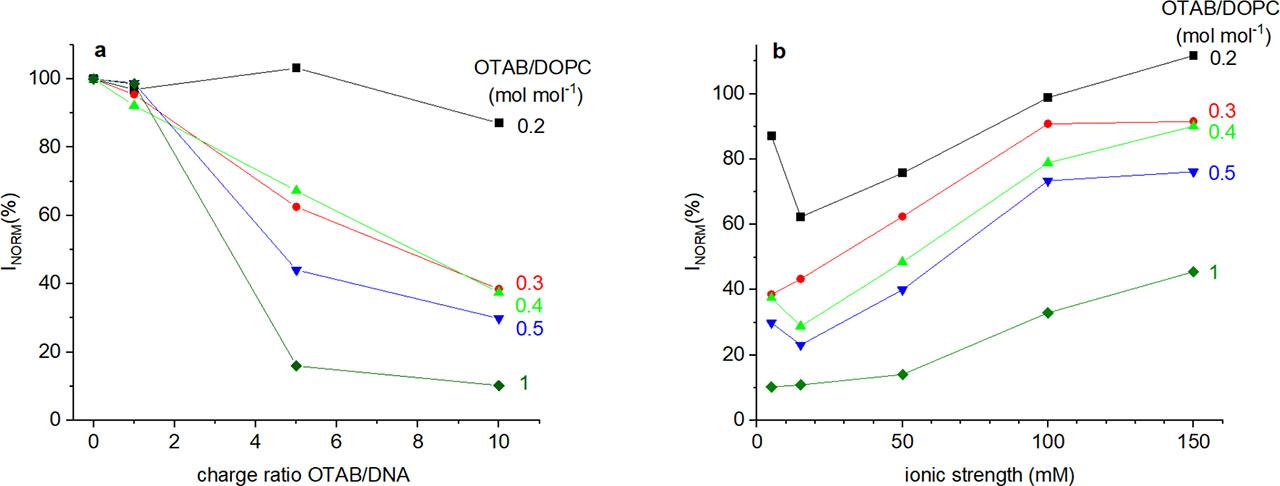
Figure 3.
(a) Dependence of normalized fluorescence intensity Inorm of DOPC + OTAB + DNA + EtBr complexes on the OTAB/DNA charge ratio at different OTAB/DOPC mole ratios in 5 mmol l−1 NaCl. The points are connected to guide the eyes. Error bars are smaller than the symbol size. (b) Dependence of normalized fluorescence intensity Inorm of DOPC + OTAB + DNA + EtBr complexes on ionic strength at a charge ratio of OTAB/DNA = 10 and at different OTAB/DOPC mole ratios.
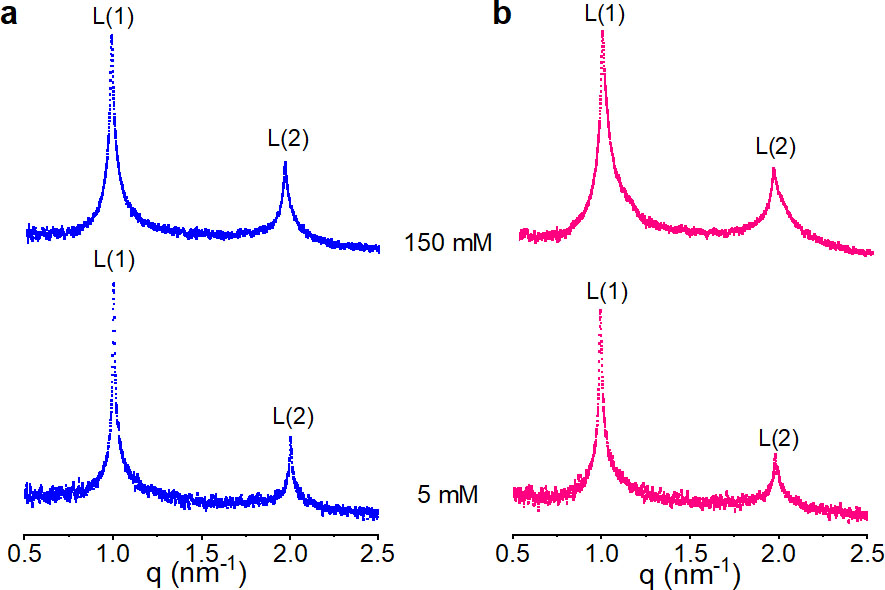
Figure 4.
The SAXS patterns of DOPC in 5 and 150 mM of NaCl at 20 °C (a) and 50 °C (b). Intensity is in a logarithmic scale.
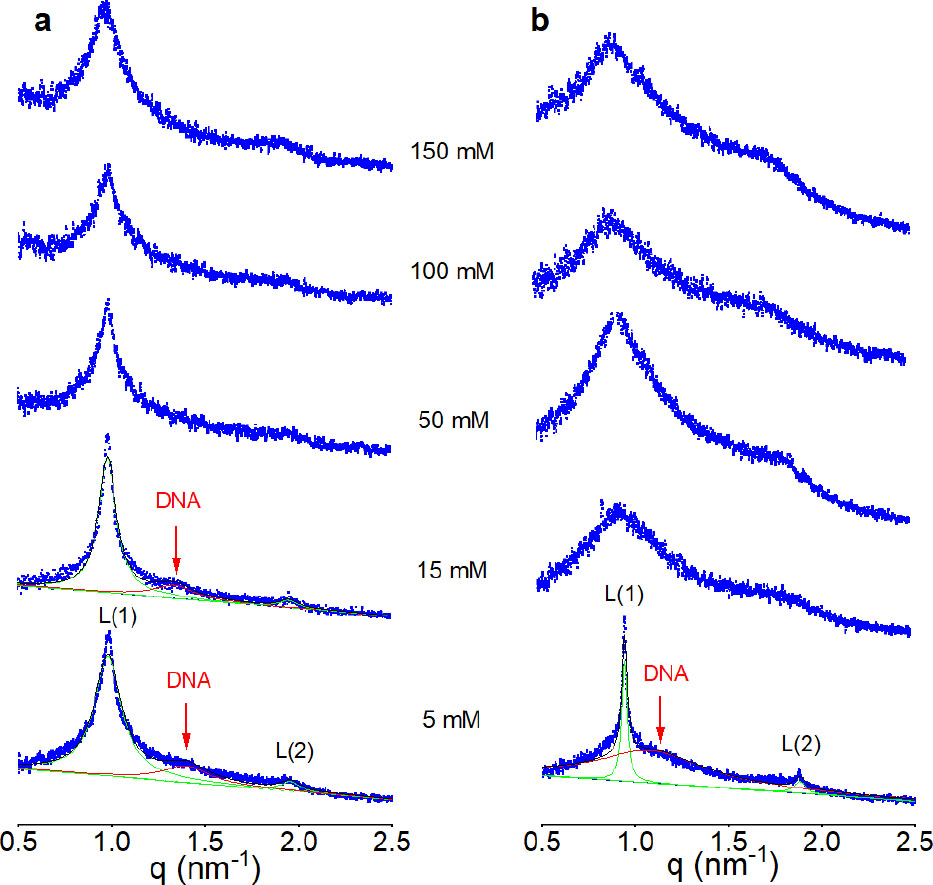
Figure 5.
The SAXS patterns of DOPC + OTAB + DNA complexes at different ionic strengths and mole ratios OTAB/DOPC = 1 (a) and 0.3 (b) at 20 °C. For illustration, the data points are simulated with the best Lorentzian fit curves. Intensity is in a logarithmic scale.
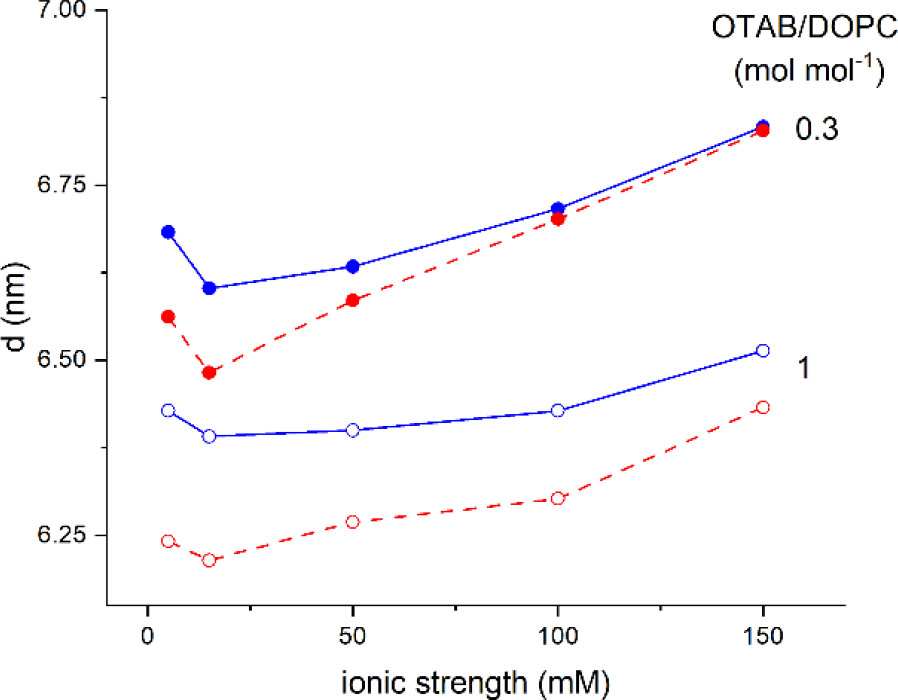
Figure 6.
Dependence of the repeat distance d of the lipid bilayers stacking in the DOPC + OTAB + DNA system on ionic strength at the mole ratios OTAB/DOPC = 0.3 (dots) and 1 (circles) at 20 °C (blue line) and 50 °C (red line).