
Table 1
Effect of CoQ10, NAC or their combination on body weight% and kidney to body weight ratio (mg/g).
| Groups | Body weight % | Kidney to Body Weight Ratio (mg/g) | |
|---|---|---|---|
| Initial at Week 0 | Final at Week 12 | ||
| Control | 100.0 ± 0.368 | 145.2 ± 0.865* | 3.807 ± 0.041 |
| STZ-NAD DN | 100.0 ±1.389 | 87.5 ± 0.958a, * | 7.504 ± 0.193 a |
| CoQ10 (10 mg/kg) | 100.0 ±0.763 | 105.2 ± 1.122a, b, * | 5.490 ± 0.199a, b |
| NAC (300 mg/kg) | 100.0 ±1.128 | 106.5 ± 0.467a, b, * | 5.201 ± 0.072a, b |
| CoQ10 + NAC | 100.0 ±1.039 | 112.0 ± 1.217a, b, c, d, * | 4.530 ± 0.126a, b, c, d |
Values are expressed as mean ± SEM; n = 6. One-way ANOVA followed by Tukey's multiple comparison test.
Table 2
Effect of CoQ10, NAC or their combination on blood glucose level (mg/dL) and HbA1C
| Groups | Blood Glucose (mg/dL) | HbA1C (%) | |
|---|---|---|---|
| Initial at Week 0 | Final at Week 12 | ||
| Control | 91.83 ± 2.937 | 91.0 ± 3.13 | 4.733 ± 0.084 |
| STZ-NAD DN | 499.0 ± 17.27a | 534.0 ± 24.28a | 9.05 ± 0.283 a |
| CoQ10 (10 mg/kg) | 473.2 ± 17.35a | 413.5 ± 5.812a, b, * | 6.15 ± 0.080a, b |
| NAC (300 mg/kg) | 480.0 ± 15.73a | 451.7 ± 11.8a, b | 6.4 ± 0.085a, b |
| CoQ10 + NAC | 477.7 ± 15.34a | 351.5 ± 12.03a, b, c, d, * | 5.4 ± 0.171a, b, c, d |
Values are expressed as mean ± SEM; n = 6. One-way ANOVA followed by Tukey's multiple comparison test.
Table 3
Effect of CoQ10, NAC or their combination on serum total protein, albumin, creatinine and creatinine clearance.
| Groups | Total Protein (g/dL) | Albumin (g/dL) | Creatinine (mg/dL) | Creatinine clearance (mL/min) |
|---|---|---|---|---|
| Control | 7.55 ± 0.071 | 3.65 ± 0.042 | 0.426 ± 0.032 | 1.134 ± 0.088 |
| STZ-NAD DN | 4.88 ± 0.094a | 1.86 ± 0.114 a | 2.7 ± 0.182 a | 0.269 ± 0.030a, b |
| CoQ10 (10 mg/kg) | 6.21 ± 0.149a, b | 2.95 ± 0.117a, b | 1.51 ± 0.110a, b | 0.631 ± 0.039a, b |
| NAC (300 mg/kg) | 5.93 ± 0.195a, b | 2.56 ± 0.133a, b | 1.55 ± 0.105a, b | 0.608 ± 0.045a, b |
| CoQ10 + NAC | 6.9 ± 0.063a, b, c, d | 3.05 ± 0.067a, b, d | 1.05 ± 0.058a, b, c, d | 0.907 ± 0.039a, b, c, d |
Values are expressed as mean ± SEM; n = 6. One-way ANOVA followed by Tukey's multiple comparison test.
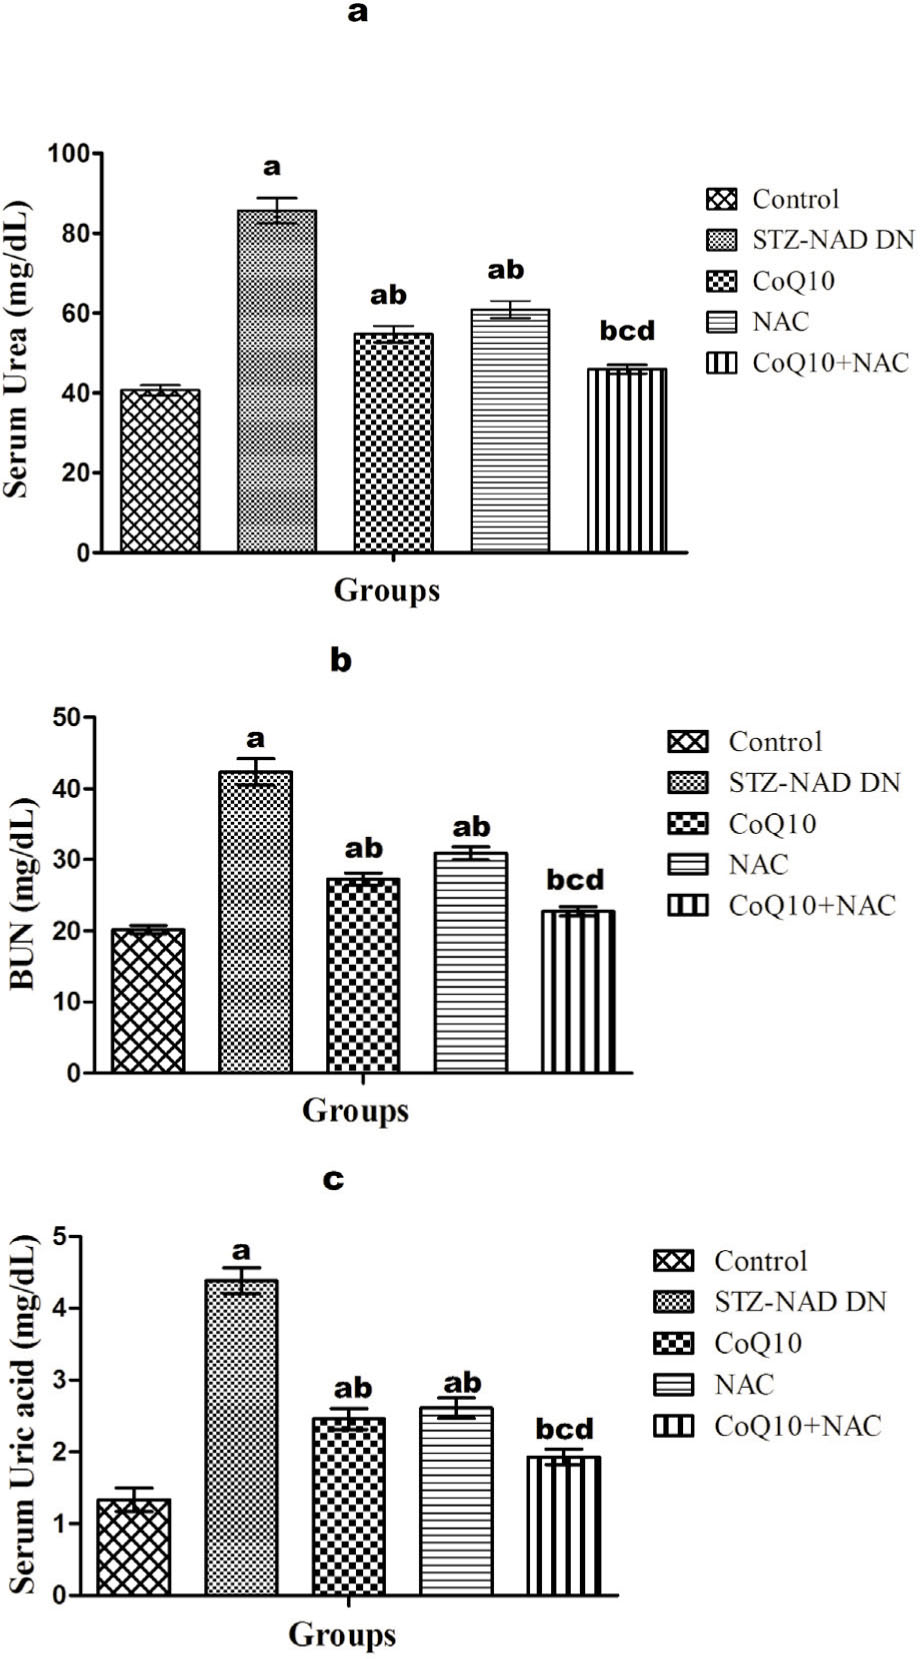
Figure 1
Effect of CoQ10, NAC or their combination on a) serum urea, b) BUN and c) uric acid.
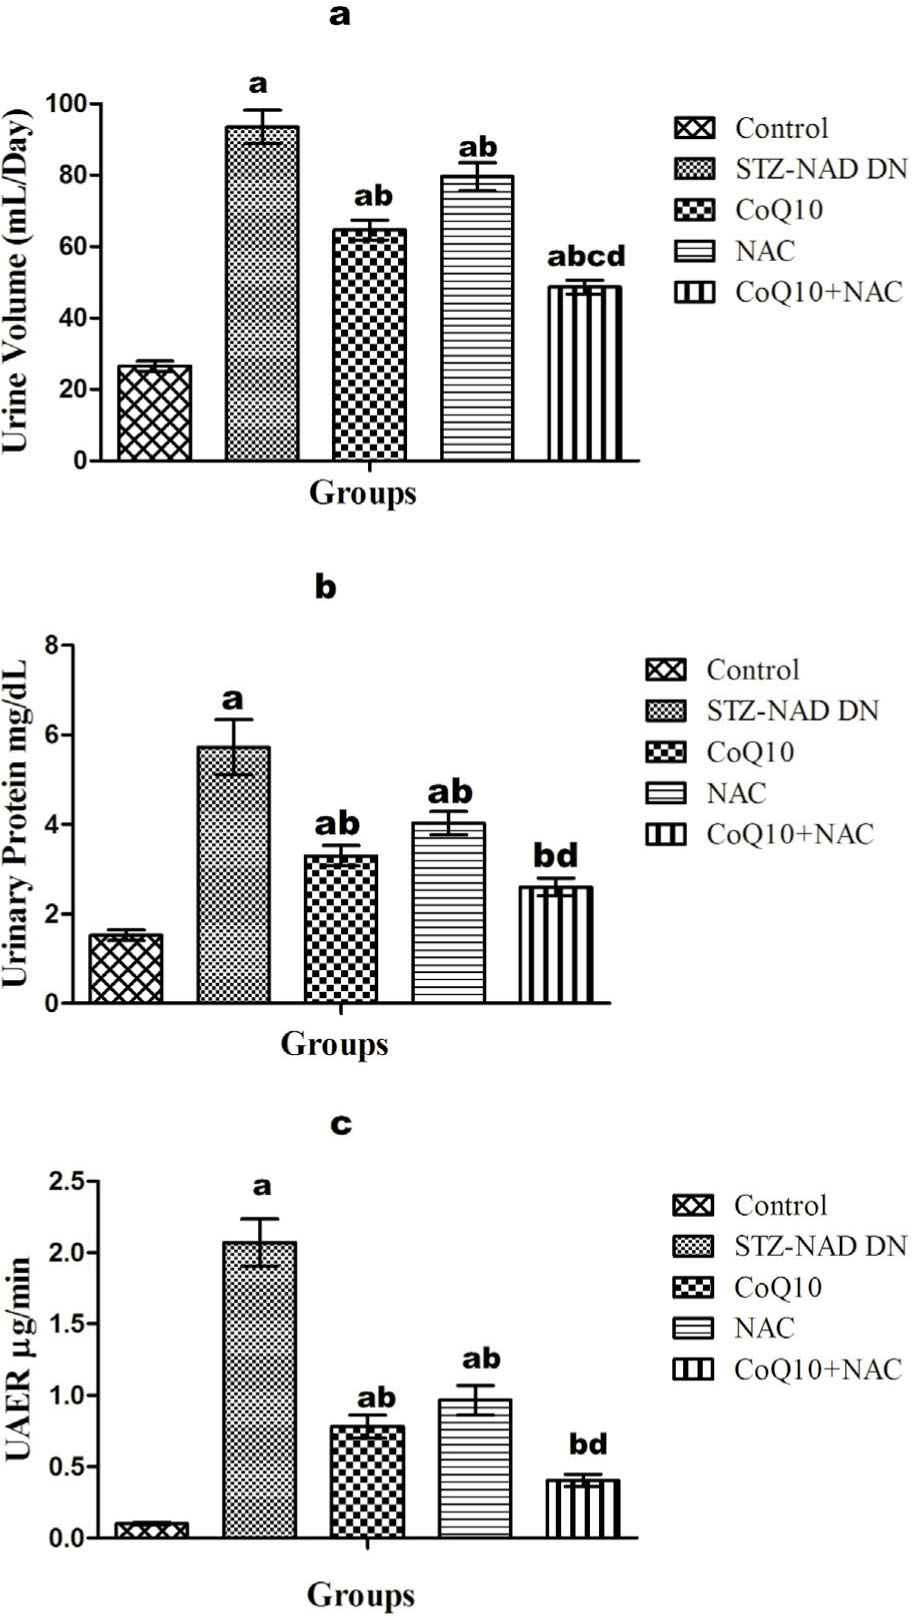
Figure 2
Effect of CoQ10, NAC or their combination on a) urine volume (mL/Day), b) urinary protein (mg/dL) and c) UAER (μg/min).
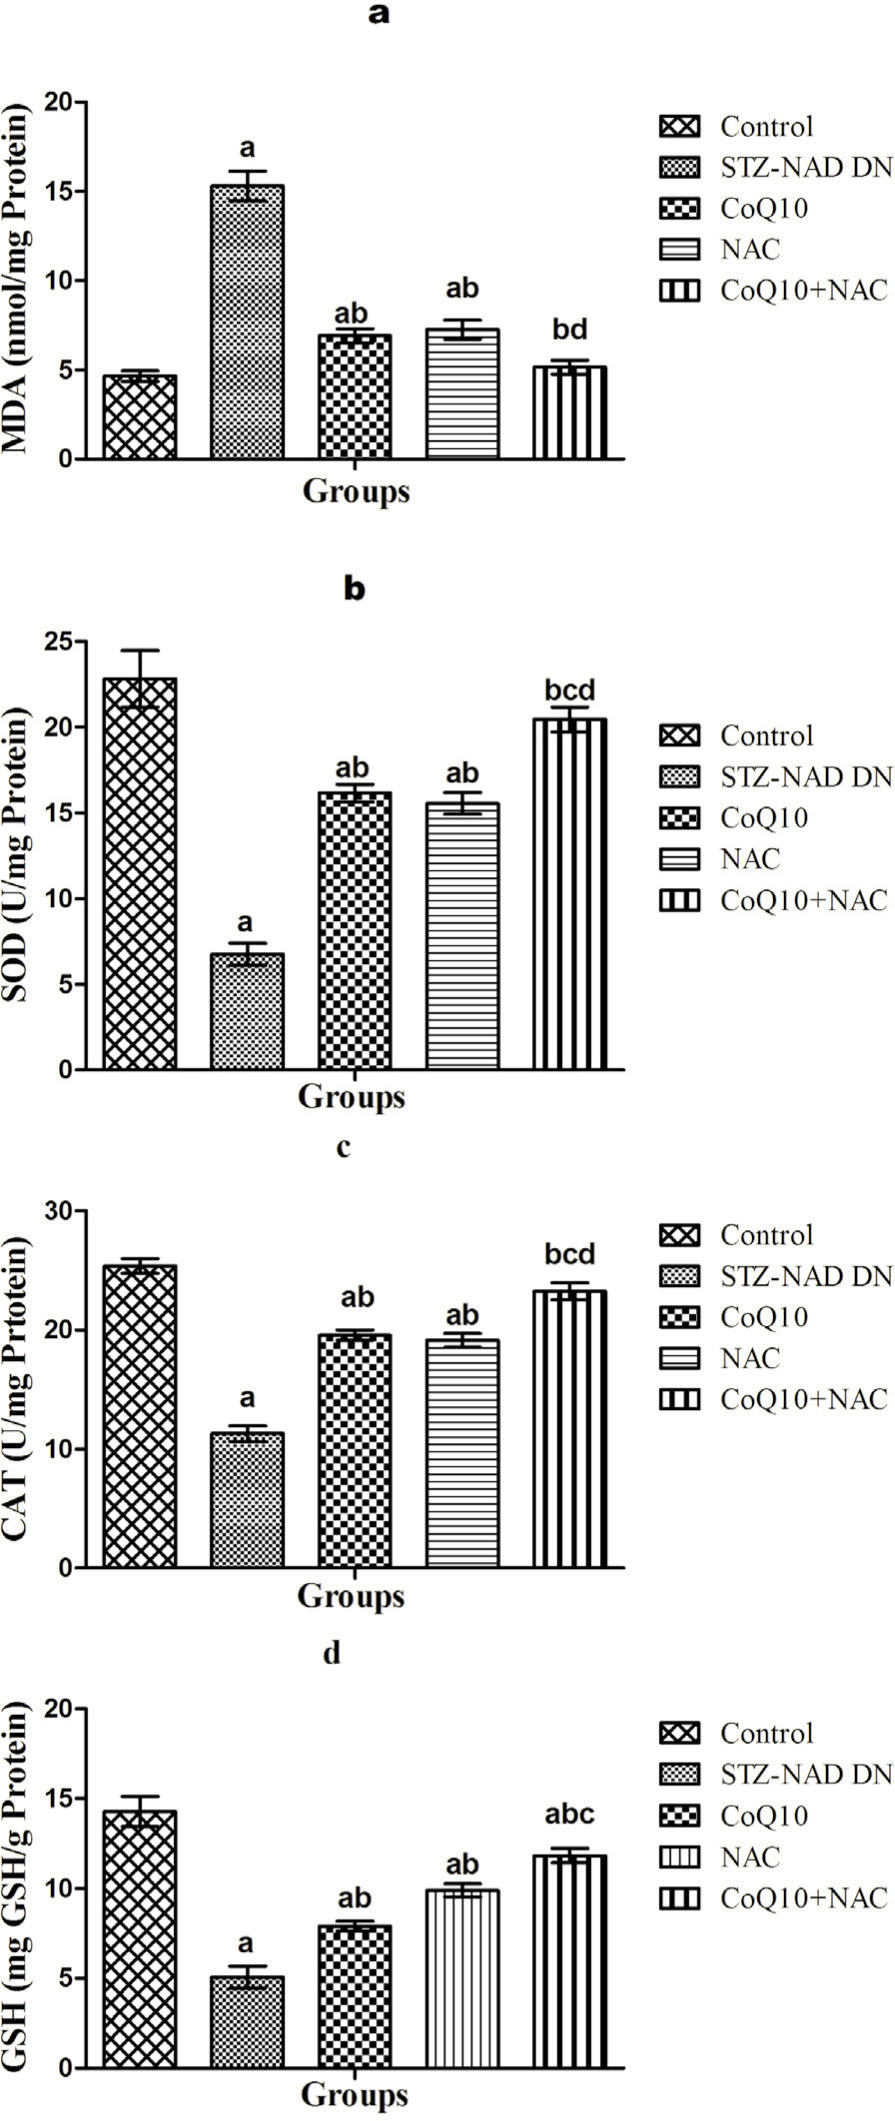
Figure 3
Effect of CoQ10, NAC or their combination on renal OS and anti-oxidant markers a) MDA, b) SOD, c) CAT and d) GSH.
Table 4
Effect of CoQ10, NAC or their combination on MPO activity and NO in renal tissue.
| Groups | MPO | NO |
|---|---|---|
| (U/g Tissue) | (μmol/g Tissue) | |
| Control | 8.00 ± 0.718 | 4.38 ± 0.567 |
| STZ-NAD DN | 27.28 ± 0.871a | 12.45 ± 0.776 a |
| CoQ10 (10 mg/kg) | 16.63 ± 0.639a, b | 6.36 ± 0.355b |
| NAC (300 mg/kg) | 17.27 ± 0.556a, b | 7.23 ± 0.480a, b |
| CoQ10 + NAC | 13.07 ± 0.582a, b, c, d | 4.68 ± 0.425b, d |
Values are expressed as mean ± SEM; n = 6. One-way ANOVA followed by Tukey's multiple comparison test.