Figure 1
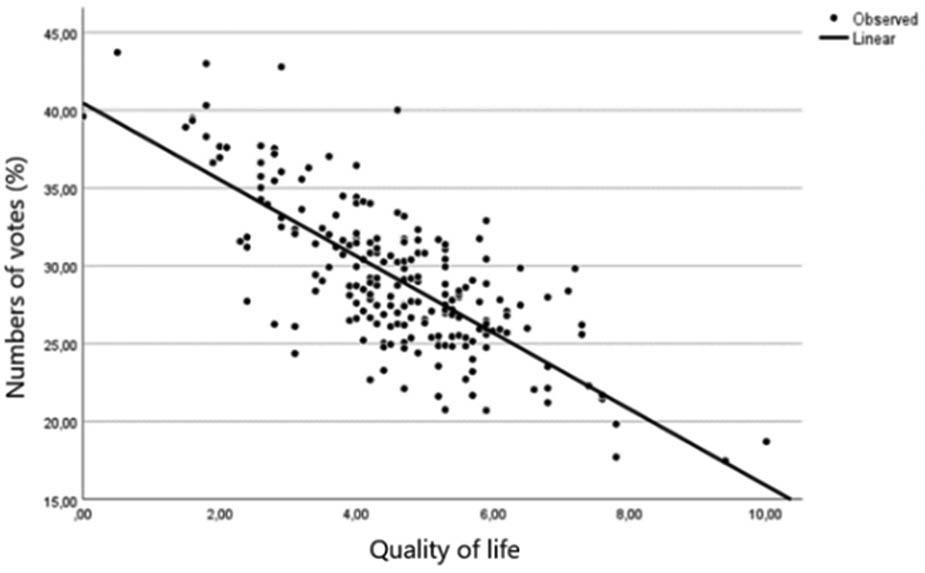
Figure 2
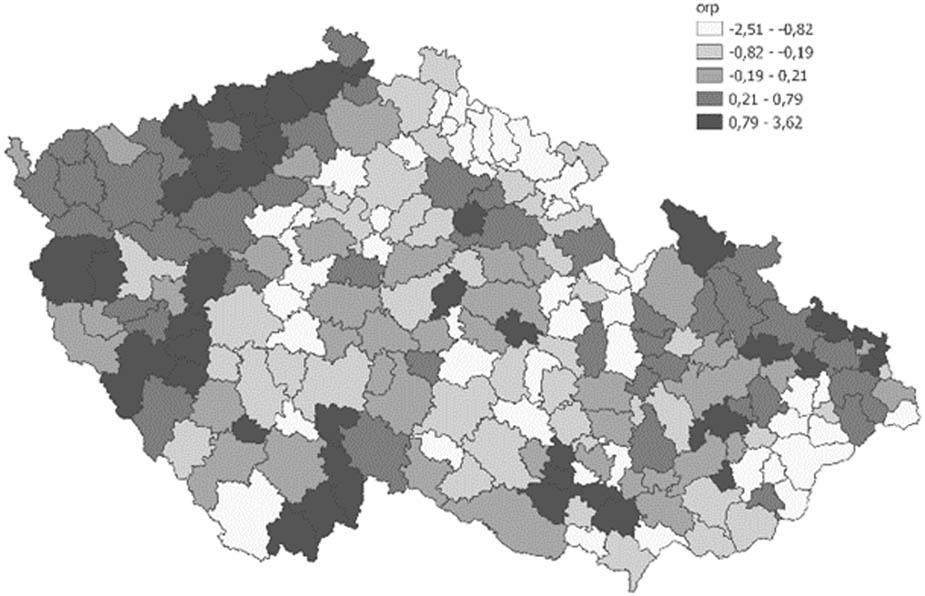
Figure 3
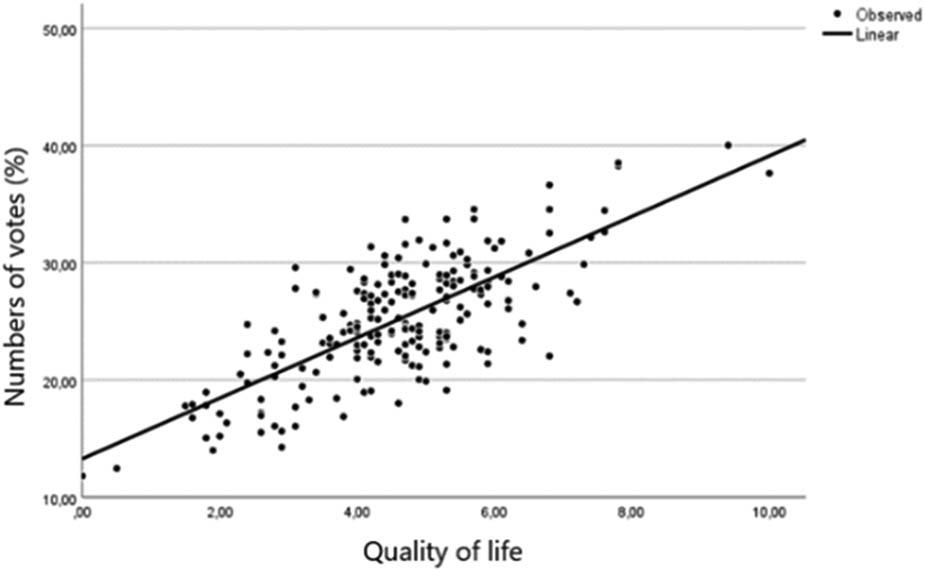
Figure 4
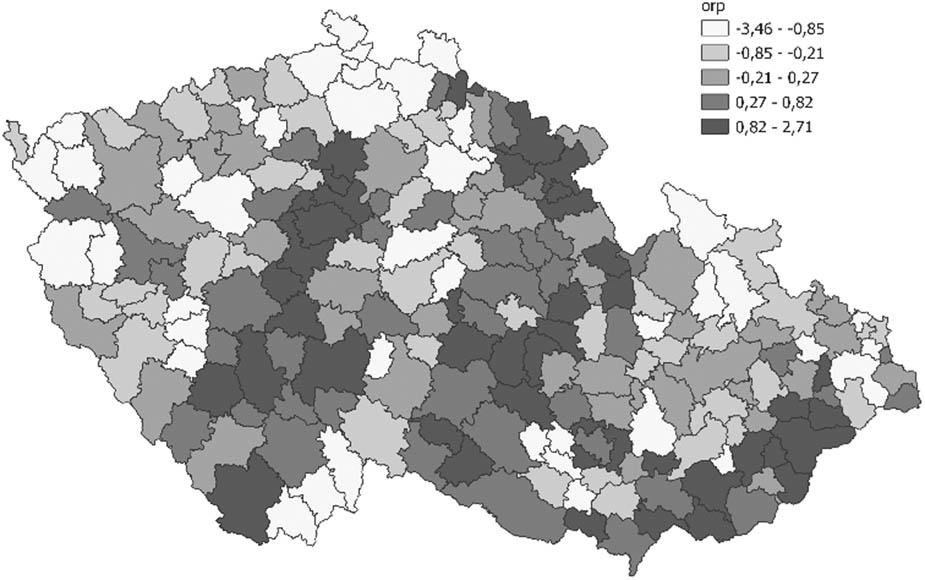
Figure 5
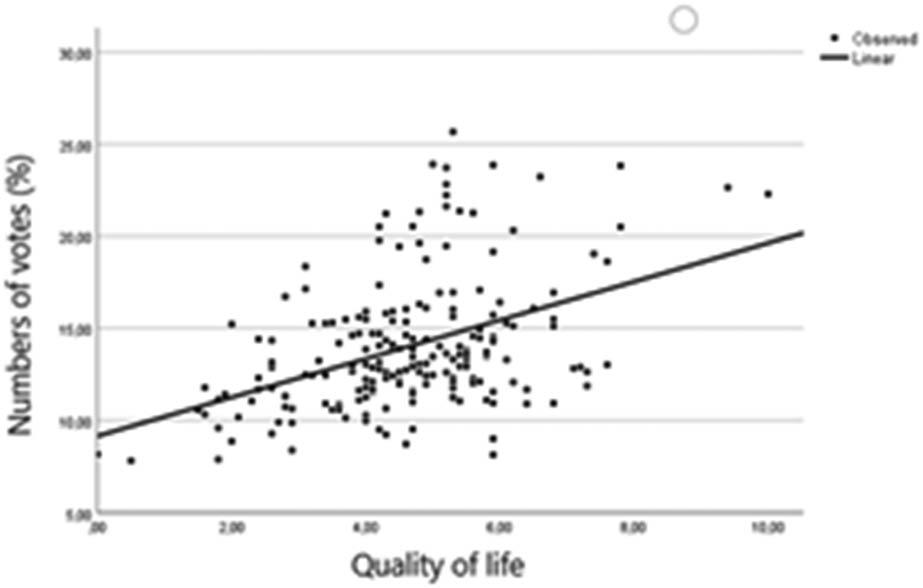
Figure 6

Figure 7
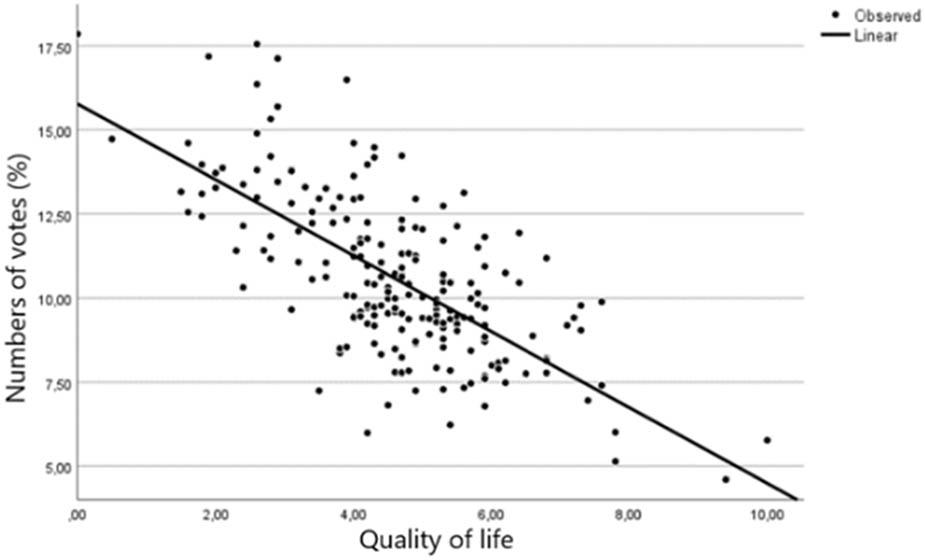
Figure 8
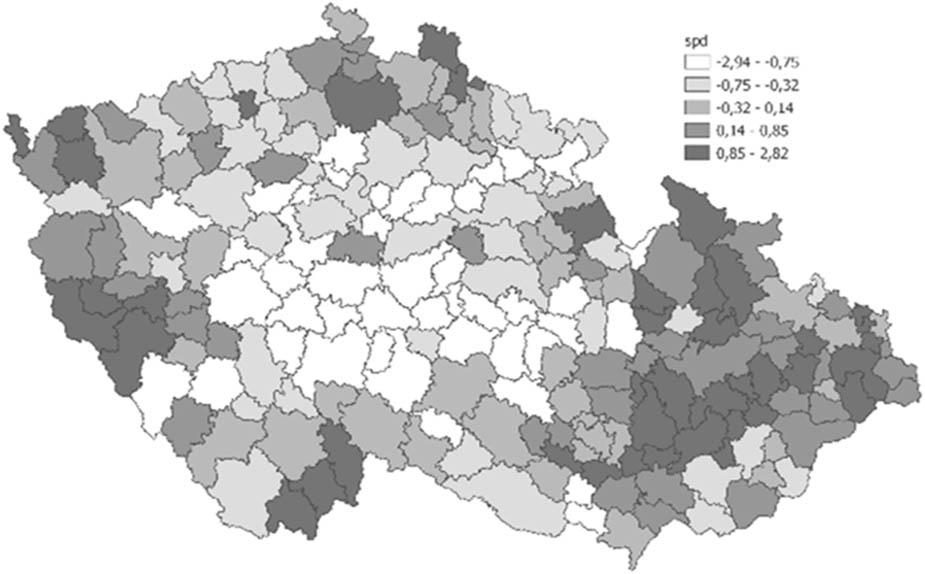
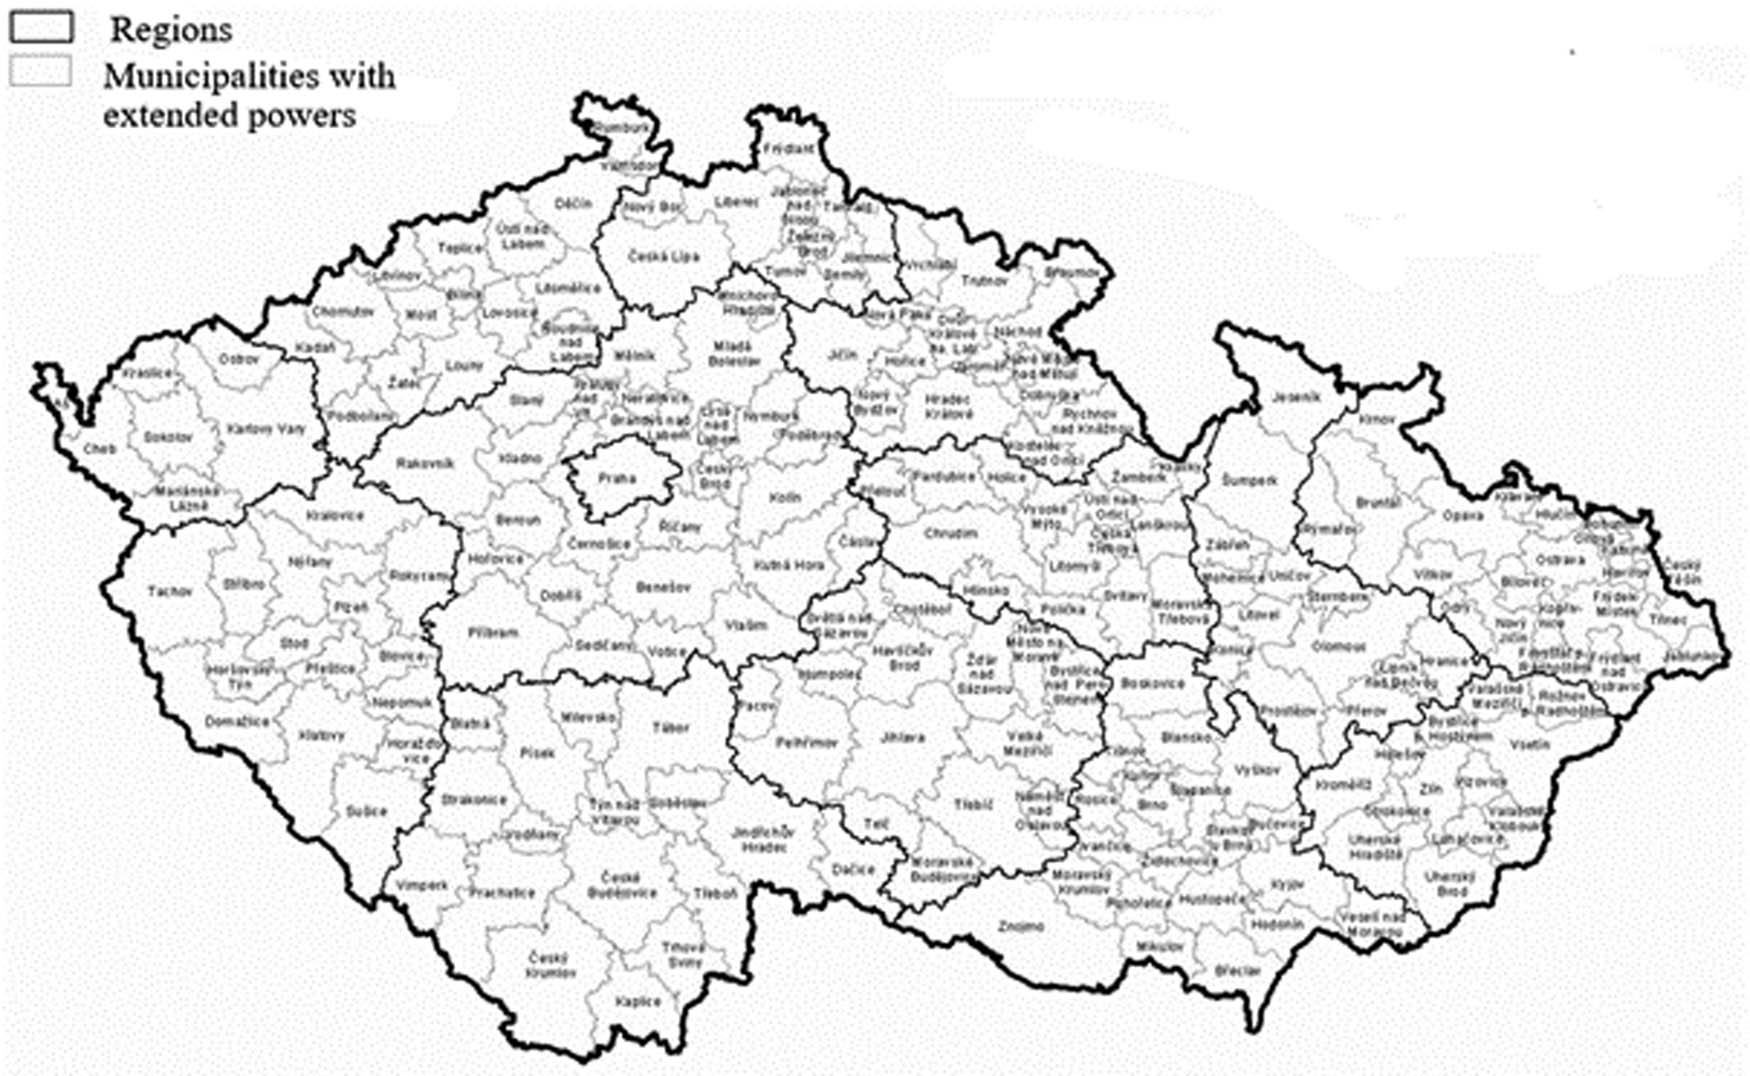
Figure A1
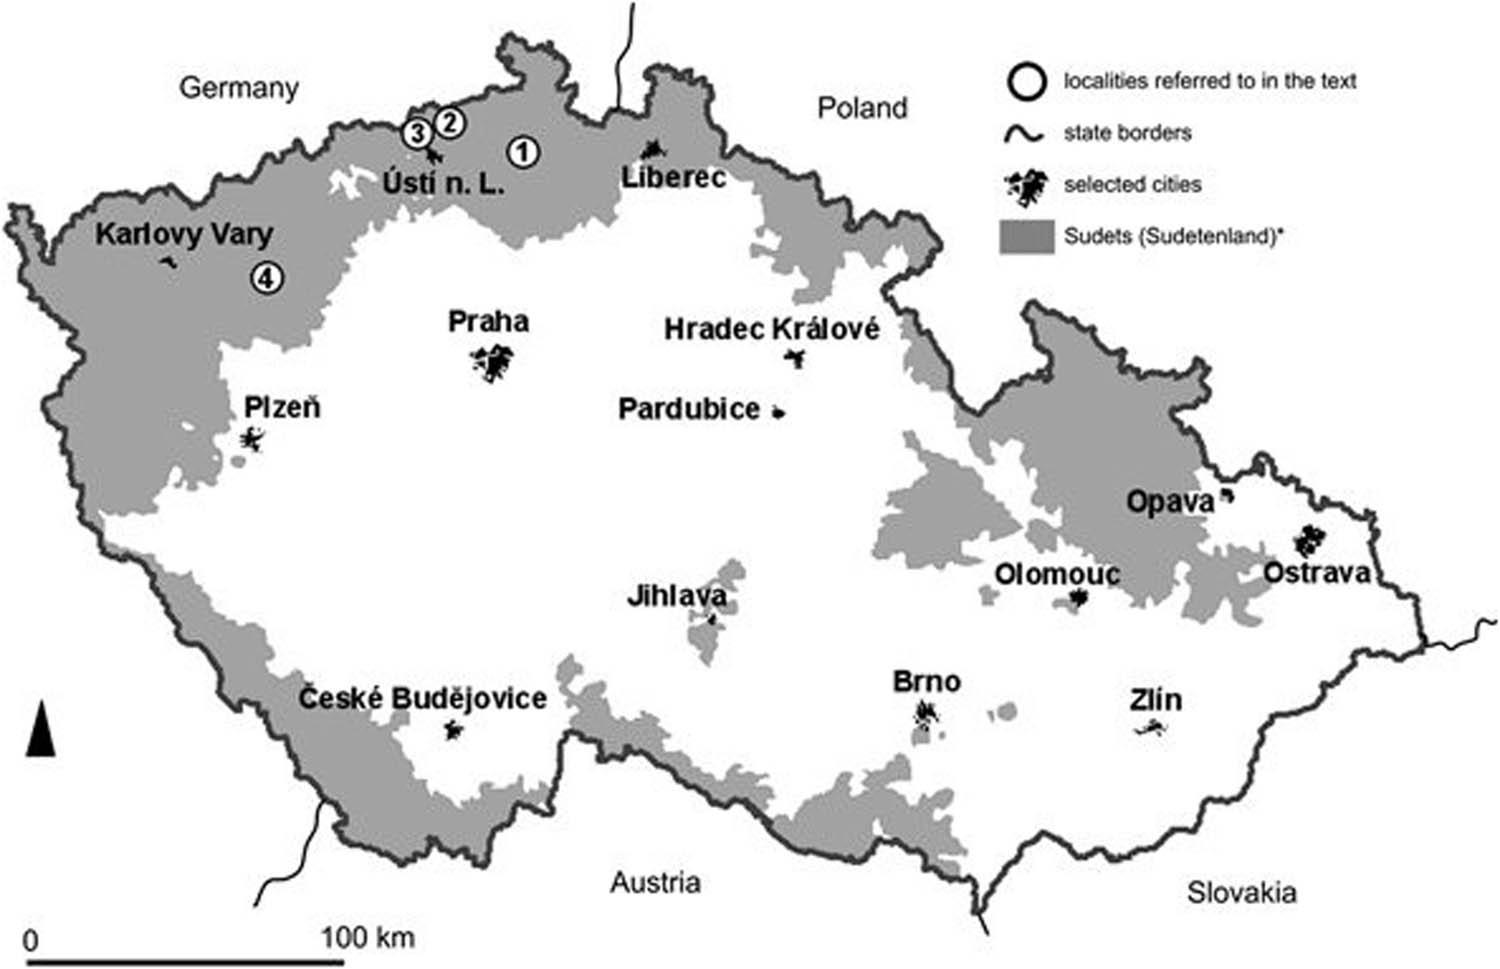
Figure A2
Voter turnout and quality of life with control variables_
| Variable | B | S.E. | Sig. | Exp (B) |
|---|---|---|---|---|
| Quality of life | 2.513 | 0.125 | <0.001 | 0.766 |
| The share of people over 65 years | 0.184 | 0.105 | 0.080 | 0.070 |
| The share of Catholics | 0.080 | 0.028 | 0.005 | 0.113 |
| The share of people with foreign citizenship from countries outside Europe | −2.191 | 0.320 | <0.001 | −0.292 |
| The number of inhabitants (logarithmically adjusted) | 0.133 | 0.597 | 0.824 | 0.009 |
| Constant | 50.274 | 2.547 | <0.001 | |
| N | 206 | |||
SPOLU and quality of life with control variables_
| Variable | B | S.E. | Sig. | Exp(B) |
|---|---|---|---|---|
| Quality of life | 2.382 | 0.159 | <0.001 | 0.684 |
| The share of people over 65 years | −0.114 | 0.132 | 0.391 | −0.041 |
| The share of Catholics | 0.157 | 0.036 | <0.001 | 0.209 |
| The share of people with foreign citizenship from countries outside Europe | −0.783 | 0.404 | 0.054 | −0.098 |
| The number of inhabitants (logarithmically adjusted) | 2.184 | 0.755 | 0.004 | 0.140 |
| Constant | 14.457 | 3.223 | <0.001 | |
| N | 206 | |||
SPD and quality of life with control variables_
| Variable | B | S.E. | Sig. | Exp (B) |
|---|---|---|---|---|
| Quality of life | −1.132 | 0.088 | <0.001 | −0.689 |
| The share of people over 65 years | −0.068 | 0.073 | 0.355 | −0.051 |
| The share of Catholics | 0.010 | 0.020 | 0.618 | 0.028 |
| The share of people with foreign citizenship from countries outside Europe | 0.279 | 0.223 | 0.213 | 0.074 |
| The number of inhabitants (logarithmically adjusted) | −0.450 | 0.471 | 0.282 | −0.061 |
| Constant | 17.247 | 1.780 | <0.001 | |
| N | 206 | |||
ANO and quality of life with control variables_
| Variable | B | S.E. | Sig. | Exp (B) |
|---|---|---|---|---|
| Quality of life | −2.348 | 0.155 | <0.001 | −0.718 |
| The share of people over 65 years | 0.158 | 0.129 | 0.223 | 0.060 |
| The share of Catholics | −0.041 | 0.035 | 0.247 | −0.058 |
| The share of people with foreign citizenship from countries outside Europe | 0.994 | 0.395 | 0.013 | 0.133 |
| The number of inhabitants (logarithmically adjusted) | −0.795 | 0.738 | 0.283 | −0.054 |
| Constant | 36.803 | 3.152 | <0.001 | |
| N | 206 | |||
Pirates/STAN and quality of life with control variables_
| Variable | B | S.E. | Sig. | Exp (B) |
|---|---|---|---|---|
| Quality of life | 1.070 | 0.151 | <0.001 | 0.441 |
| The share of people over 65 years | −0.048 | 0.126 | 0.702 | −0.025 |
| The share of Catholics | −0.149 | 0.034 | <0.001 | −0.285 |
| The share of people with foreign citizenship from countries outside Europe | 0.218 | 0.384 | 0.571 | 0.039 |
| The number of inhabitants (logarithmically adjusted) | 0.962 | 0.717 | 0.182 | 0.088 |
| Constant | 10.527 | 3.062 | 0.001 | |
| N | 206 | |||
