
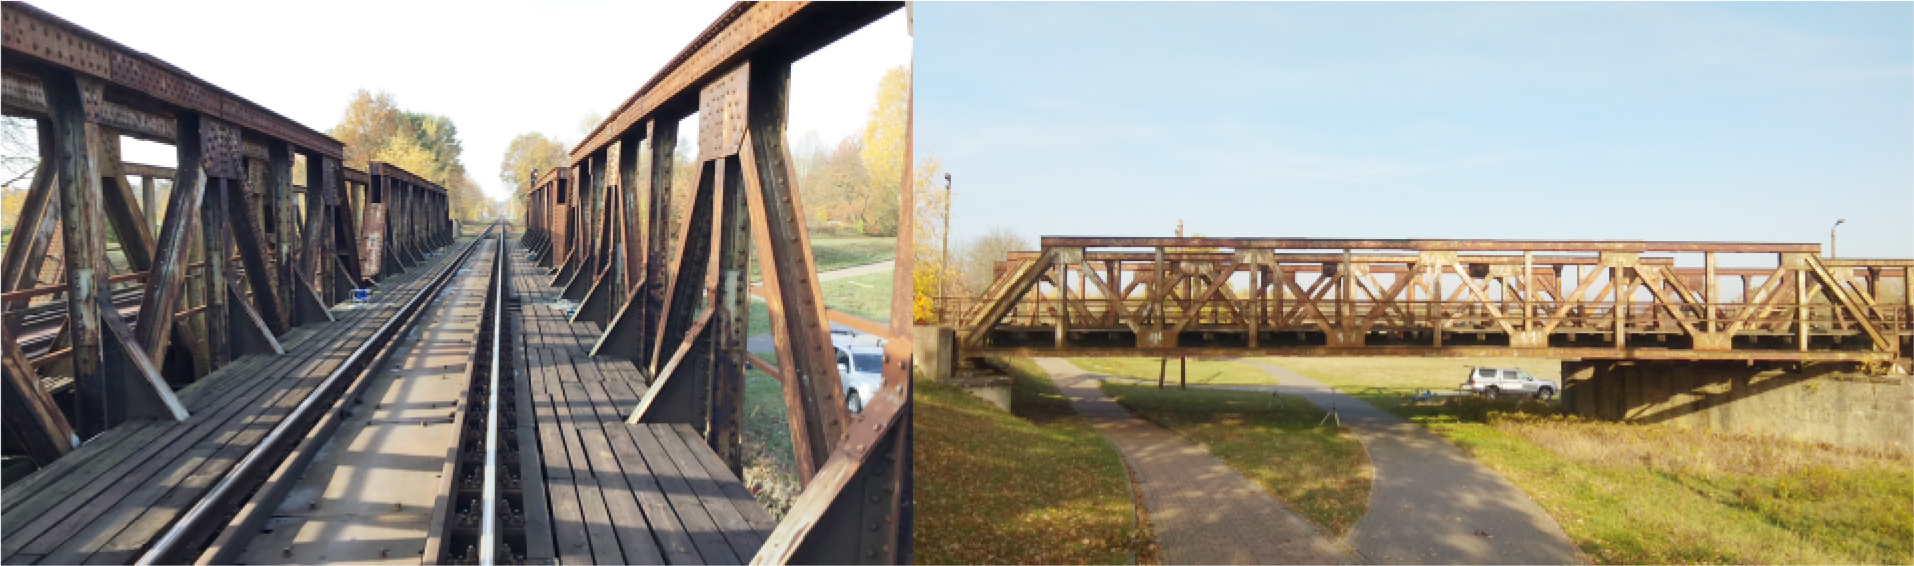
Figure 1.
Bridge under study
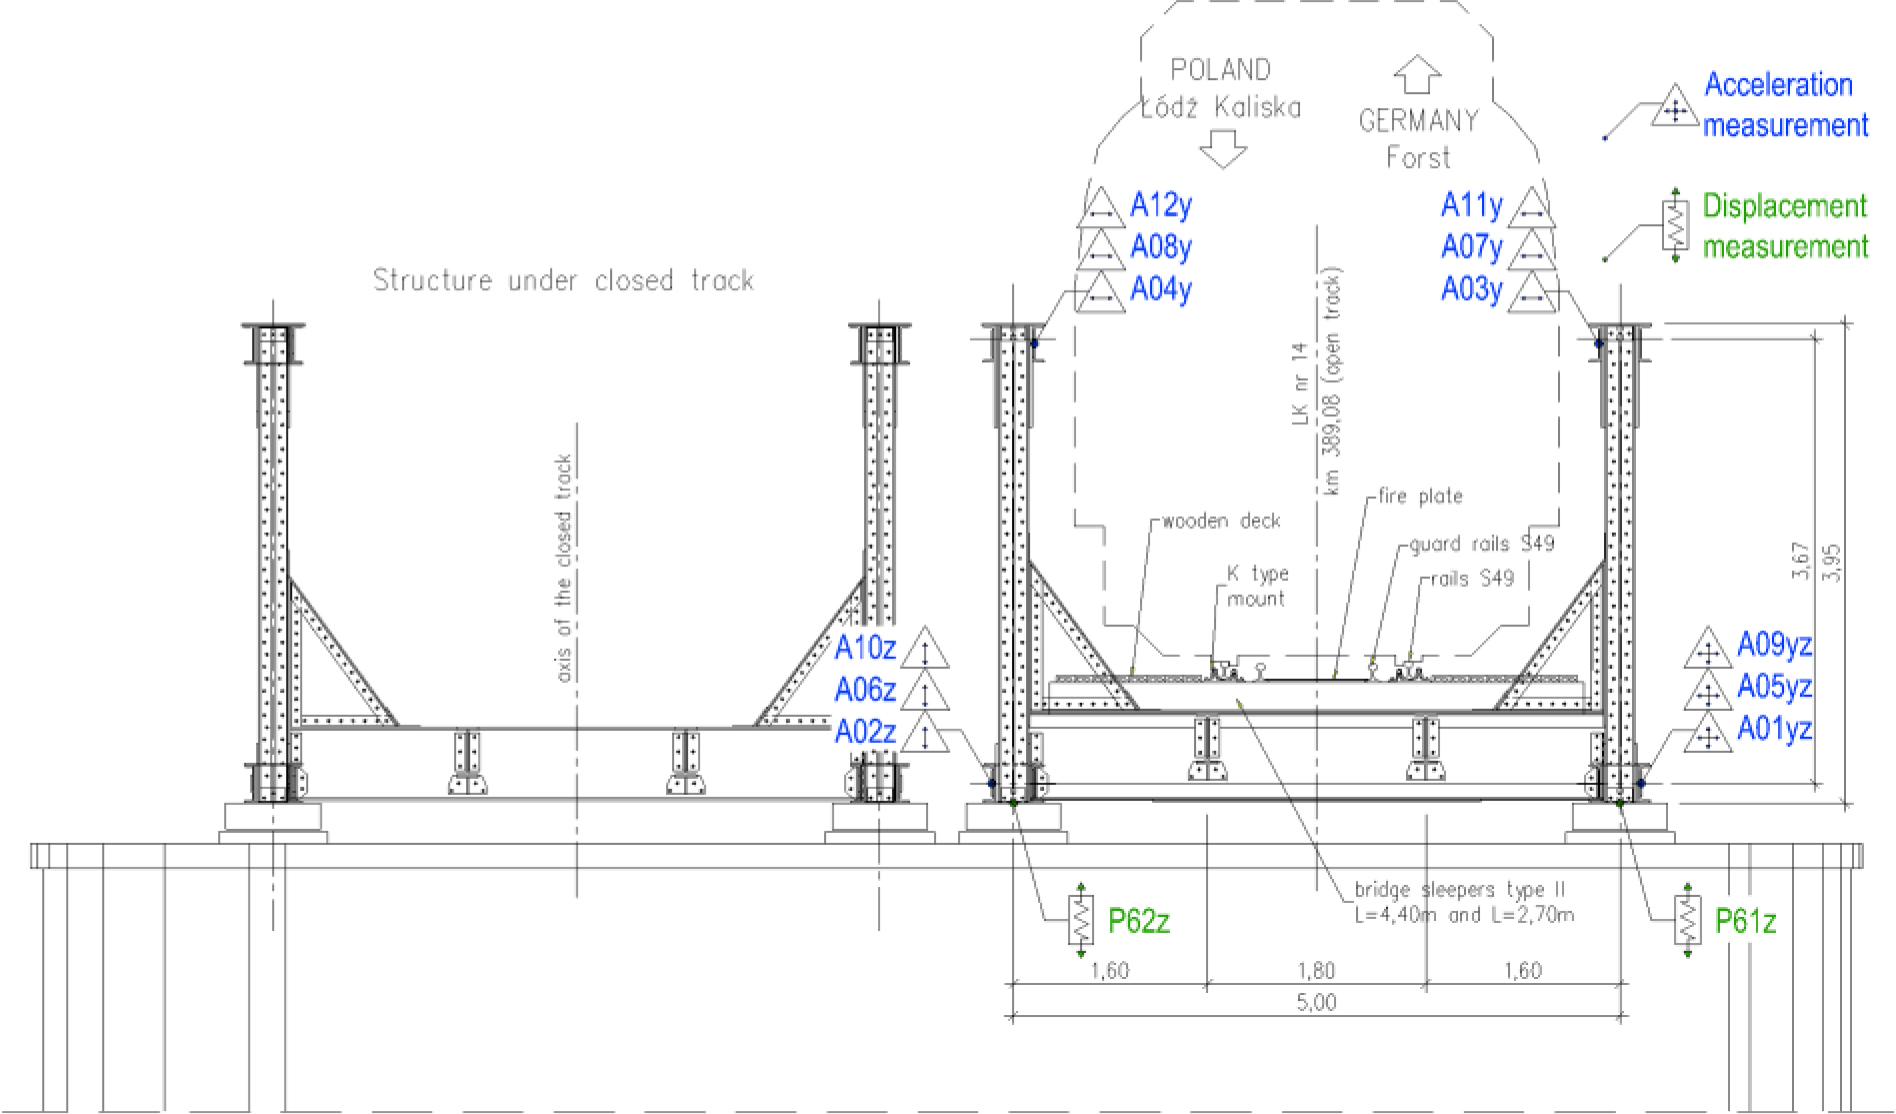
Figure 2.
Cross section of the the sixth span of discussed bridge with spatial transducer layout; suffix y denotes the transverse uniaxial sensor, z denotes the vertical uniaxial sensor and yz denotes the transverse and vertical biaxial sensor
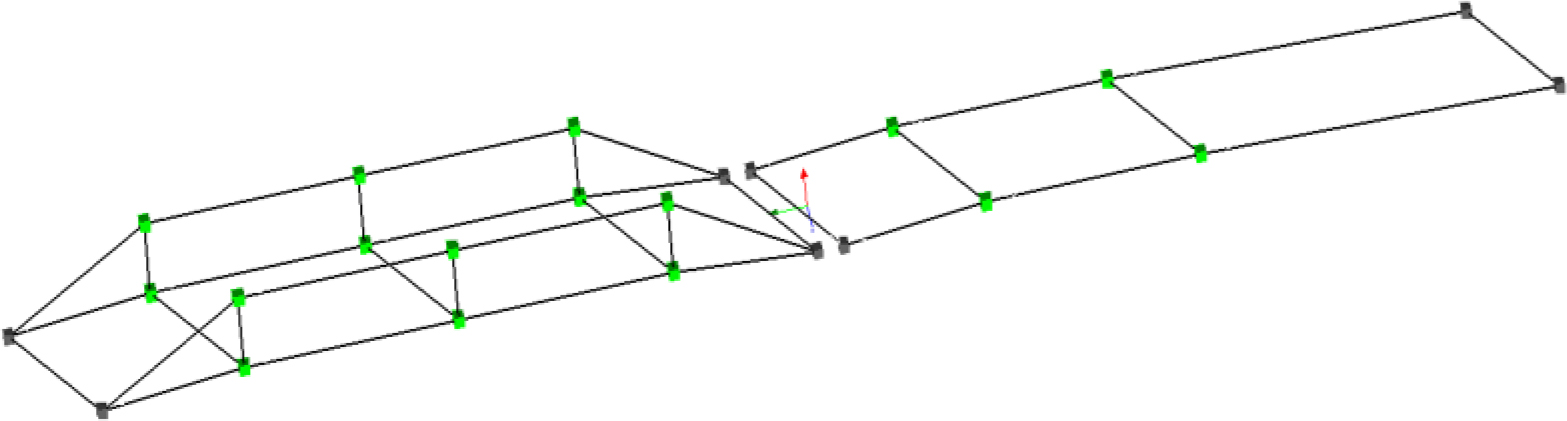
Figure 3.
Accelerometer layout in spans no. five (on the right) and six (on the left)
Tabela 1.
Summary of recorded real train passages
| No. | Code name | Description | direction of passage | Accelerometer setup | Hour of pasage |
|---|---|---|---|---|---|
| 1 | T1 | Freight train | Forst-Zasieki | U1 | 11:27 |
| 2 | T2 | Freight train | Forst-Zasieki | U1 | 13:11 |
| 3 | T3 | Freight train | Zasieki-Forst | U2 | 15:00 |
| 4 | L1 | Heavy locomotive | Forst-Zasieki | U2 | 15:16 |
| 5 | O1 | Railcar | Zasieki-Forst | U1 | 16:33 |
| 6 | O2 | Railcar | Forst-Zasieki | U1 | 16:41 |
Tabela 2.
FEM predicted and identified modes of vibration
| FEM | nOMA/nt | OMA | Times identified | Mode shape description | ||||
|---|---|---|---|---|---|---|---|---|
| No. | nt [Hz] | nOMA [Hz] | UnOMA [Hz] | ξ [%] | Uξ [%] | |||
| 1 | 5.70 | 0.81 | 4.60 | 0.02 | 0.66 | 0.28 | 9 | I lateral bending |
| 2 | 7.29 | 1,07 | 7.83 | 0.14 | 1.24 | 1.33 | 9 | I vertical bending |
| 3 | 10.50 | 0.97 | 10.14 | 0.11 | 0.38 | 0.13 | 8 | I torsional along x axis |
| 4 | 10.94 | 0.92 | 10.06 | - | 0.46 | - | 1 | II upper flange in phase |
| 5 | 11.43 | 0.96 | 10.95 | 0.10 | 0.29 | 0.09 | 9 | I upper flange out of phase |
| 6 | 11.76 | 1.03 | 12.11 | 0.03 | 0.28 | 0.16 | 9 | II upper flange out of phase |
| 7 | 12.44 | 1.08 | 13.40 | - | 0.41 | - | 2 | III upper flange out of phase |
| 8 | 12.78 | 1.07 | 13.68 | - | 1.38 | - | 1 | III upper flange in phase |
| 16 | 15.48 | - | - | - | - | 0 | IV upper flange in phase | |
| 17 | 15.51 | - | - | - | - | 0 | IV upper flange out of phase | |
| 19 | 17.98 | 0.95 | 17.06 | 0.12 | 0.79 | 0.46 | 9 | I torsional |
| 20 | 20.69 | - | - | - | - | 0 | II lateral bending | |
| 21 | 21.82 | - | - | - | - | 0 | V upper flange in phase | |
| 22 | 21.88 | - | - | - | - | 0 | V upper flange out of phase | |
| 23 | 22.47 | 0.95 | 21.27 | - | 0.34 | - | 3 | II lateral bending |
| 24 | 29.52 | - | - | - | - | 0 | III lateral bending | |
| 25 | 28.22 | - | - | - | - | 0 | II torsional | |
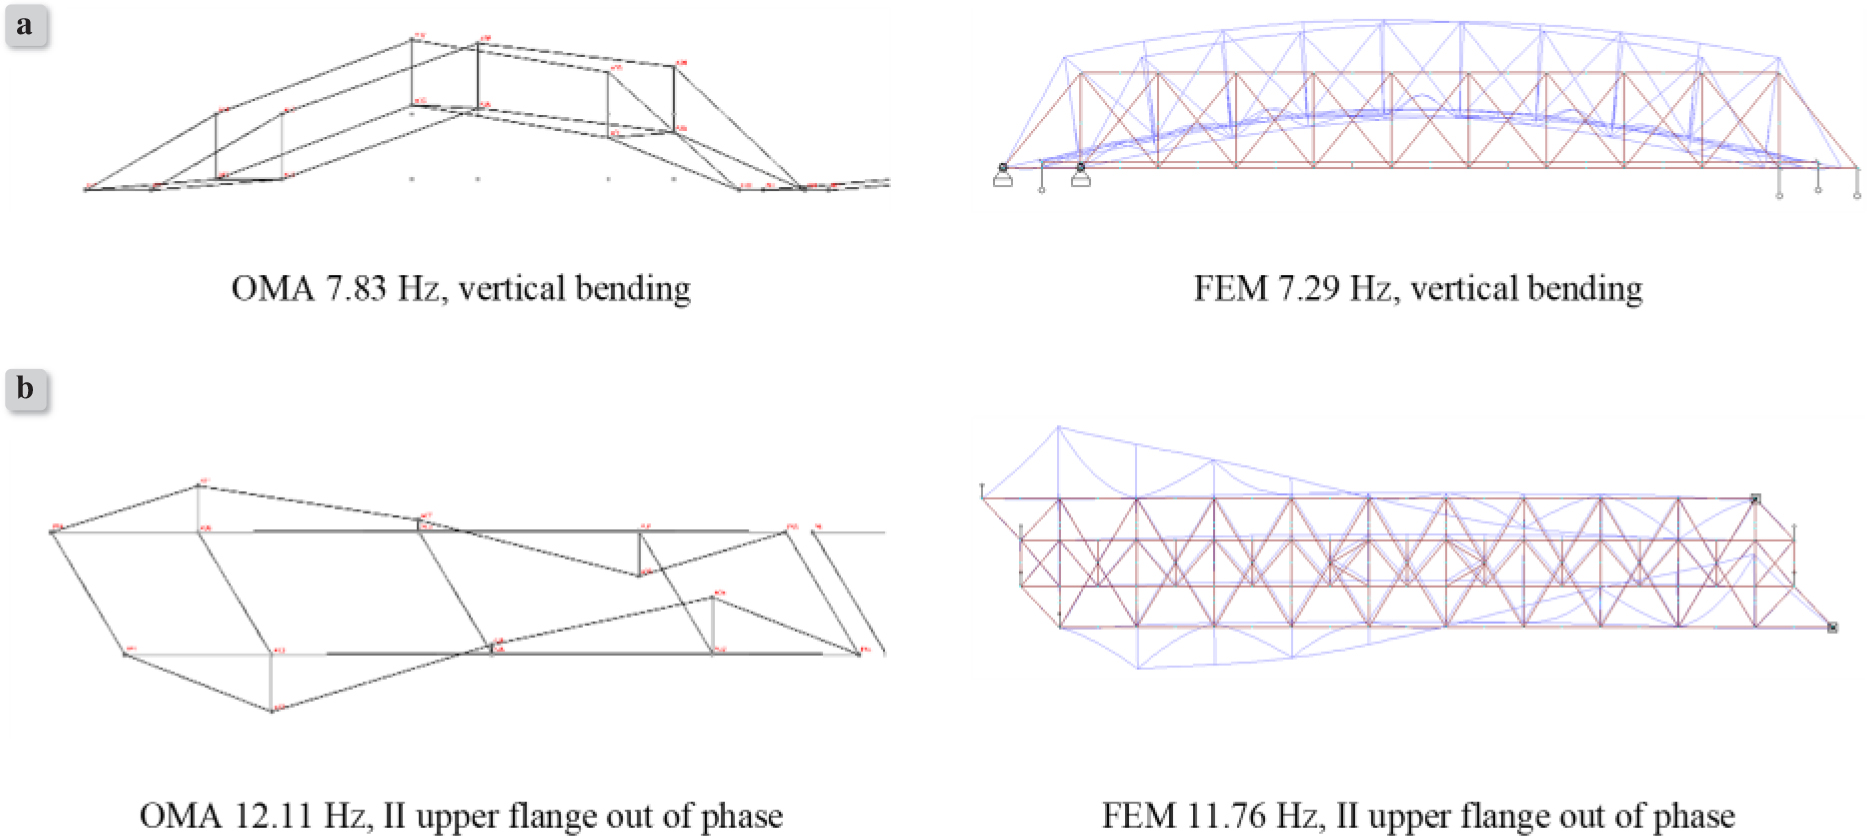
Figure 4.
Comparison of mode shapes estimated from experimental data and calculated using the FE model; a) low order mode shape; b) higher order mode shape
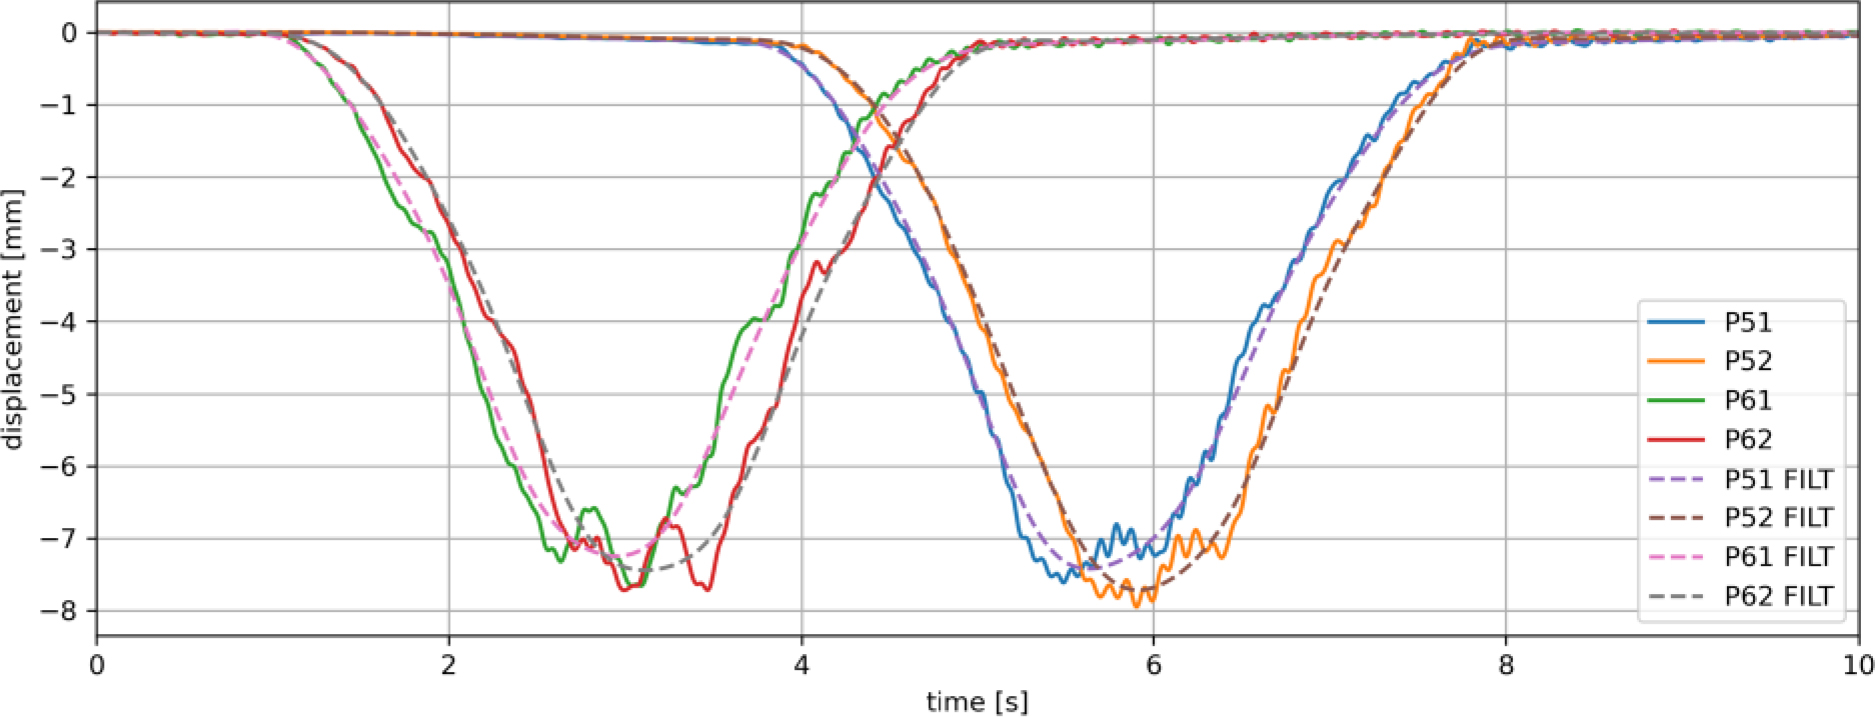
Figure 5.
Vertical displacements induced by a heavy locomotive (L1); span 6 – on the left, span 5 – on the right
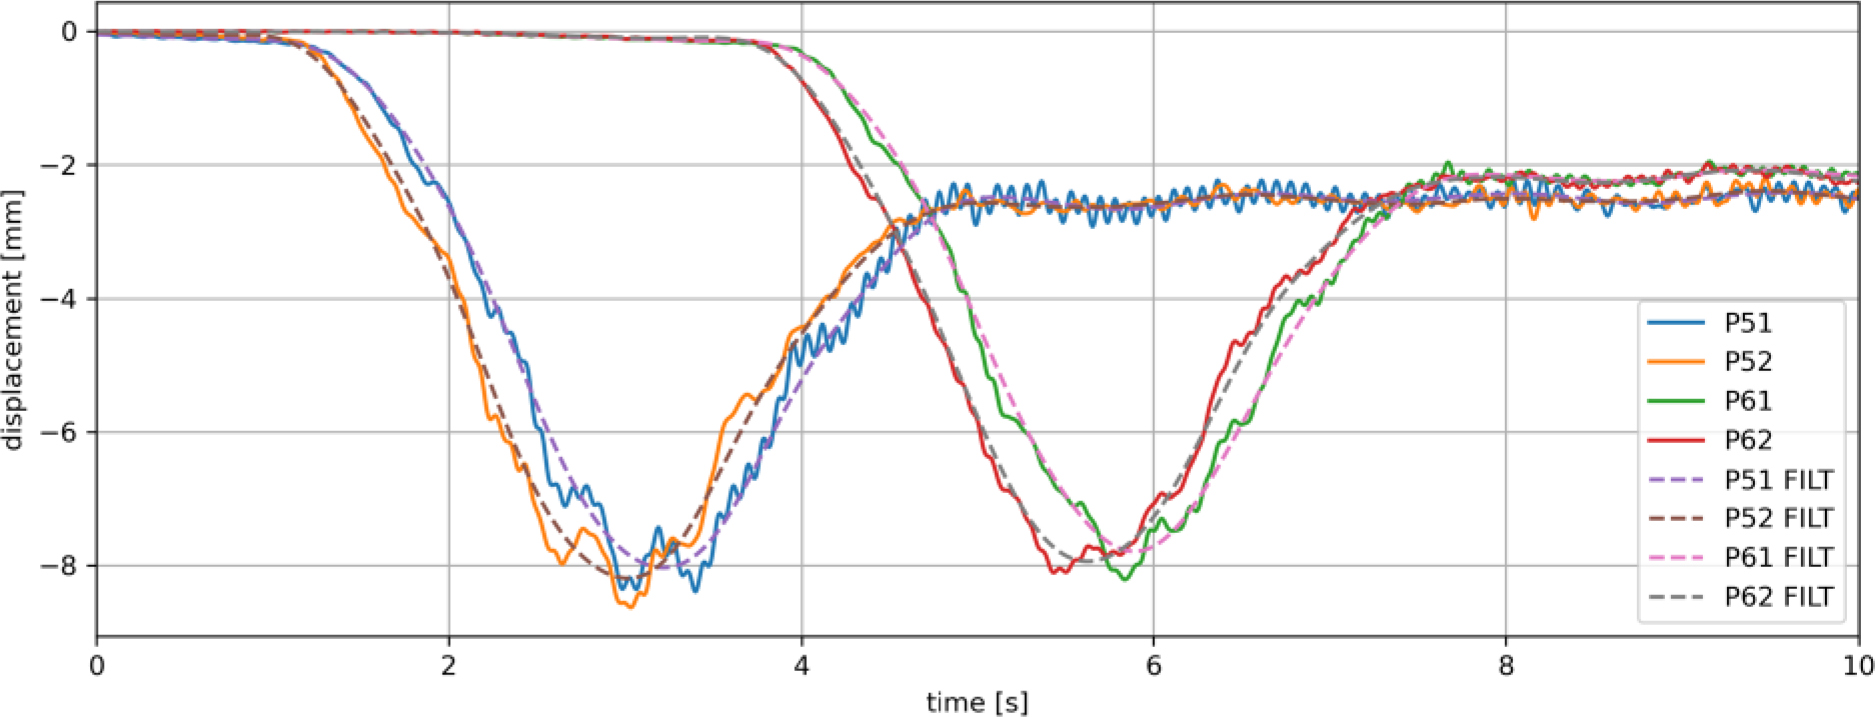
Figure 6.
Vertical displacements induced by a locomotive of a freight train (T3); span 6 – on the left, span 5 – on the right