
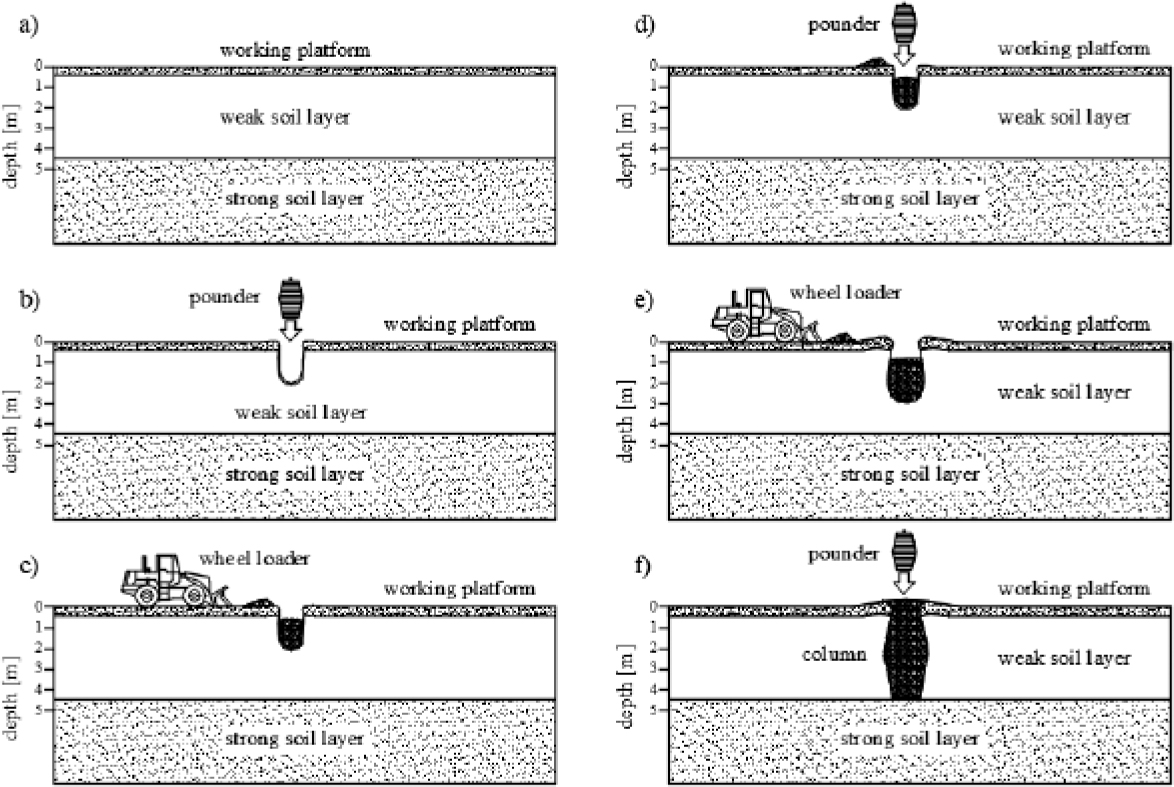
Figure 1.
Process of dynamic replacement: a) construction of the working platform, b) drop of pounder and crater creation, c) crater backfill, d-e) drop of pounder and crater backfill, f) complete DR column [15]
Table 1.
Literature review
| Author(s) | Ground conditions | Dc/Dp [-] | Mp/Hd [Mg] / [m] | Shapes of columns |
|---|---|---|---|---|
| Kumar [4] | 0–0.6 m: fill 0.6–1.5 m: medium stiff sandy silt 1.5–3.0 m: medium stiff silty clay 3.0–12.5 m: loose fine and medium sand | 1.0 – 1.25 | 19 / 21 | - |
| Varaksin and Hamidi [19] | 0–1.5 m: disturbed clay from 1.5 m: very stiff clay | 1.41 | 38.5 / 5 | - |
| Lo et al. [25] | 0–5.8 m: peaty clay from 5.8 m: old alluvium | - | 15 / 15 | Inverted truncated cone |
| Chua et al. [5] | 0–2 m: loose sand (fill) 2–3 m: soft clay 3–10 m: medium dense to dense sand | - | 24–26/10–20 | Inverted truncated cone |
| Sękowski et al. [27] | 0–1.5 m: working platform (semi-dense medium sand) 1.5–3.2 m: soft organic mud 3.2–5.0 m: semi-dense medium sand | 1.7–2.4 | 11 / 10 | Inverted truncated cone |
| Gunaratne et al. [26] | 0–1.2 m: working platform 1.2–3.0 m: organic soil from 3.0 m: silty sand | 2.46 | 4 / 12 | Cylindrical |
| Kwiecień and Sękowski [23] | various ground conditions (11 columns) | 1.5–2.7 | 10.5–12.0 / 15–25 | Cylindrical, Inverted truncated cone |
| Kwiecień [22], Kwiecień and Sękowski [24] | various ground conditions (34 columns) | 1.23–4.1 | 9–12 / 15–25 | Inverted truncated cone, Barrel-shaped |
| Kwiecień [15] | various ground conditions (65 columns) | - | 9–24 /15–25 | End bearing columns: cylindrical, truncated cone, barrel, asymmetrical barrel Floating columns: cylindrical, barrel, inverted truncated cone |
Table 2.
Geographic location and ground conditions at the sites
| Site No. | Location (Poland) | Ground conditions |
|---|---|---|
| 1. | S7 motorway, km 711+050 |
|
| 2. | A1 highway, km 516+715 |
|
| 3. | A1 highway, km 512+520 |
|
| 4. | A4 highway, km 467+260 |
|
| 5. | A4 highway, km 461+050 |
|
| 6. | A4 highway, km 462+600 |
|
| 7. | A4 highway, km 464+720 |
|
| 8. | A4 highway, km 461 + 150 |
|
1 IC – consistency index: IC = (wL – wn)/(wL – Wp), where: wn – natural water content, wL – liquid limit, Wp – plastic limit; depending on IC the soil is: very stiff (IC > 1), stiff (Ic = 0.75 – 1), firm (IC = 0.5 - 0.75), soft (IC = 0.25 – 0.5) or very soft IC < 0.25) [28]; ID – density index: ID = (emax - e)/(emax - emin), where emax – void ratio in the loosest state, emin – void ratio in the densest state, e – natural voids ratio of the deposit, Or – with organic content; depending on ID the soil is: very loose (ID = 0 – 15%), loose (ID = 15 – 35%), medium dense (ID = 35 – 65%), dense (ID = 65 – 85%) or very dense (ID = 85 – 100%) [28]
Table 3.
List of investigated columns, their diameters, lengths and technological information
| Site No. | Column | Diameters of the column (Dcmin – Dcmax) | Length of the column Hc | Shape, diameter (Dp), height (Hp) and mass (Mp) of the pounder | Number x height of the pounder drops/type, grading (d) and volume (V) of the aggregate |
|---|---|---|---|---|---|
| 1. | C1 C2 | 2.00–2.24 2.00–2.28 | 2.00 m 2.00 m | Barrel-shaped, Dp = 1.05 m, Hp = 2.00 m, Mp = 11.50 Mg | 1 x 5 m, 10 x 15 m, 1 x 5 m crushed sandstone d = 0 – 400 mm, V = 8.0 m3 |
| 2. | C3 C4 | 1.60–2.50 1.70–2.50 | 2.50 m 2.60 m | Barrel-shaped, Dp = 1.00 m, Hp = 1.80 m, Mp = 9 Mg | 1 x 5 m, 17 x 15 m, 1 x 5 m, blast furnace slag d = 10 – 120 mm, V = 9.5 m3 |
| 3. | C5 C6 C7 | 1.70–2.47 1.80–2.39 1.80–2.40 | 2.90 m 3.10 m 3.40 m | 1 x 5m, 22 x 15 m, 1 x 5 m blast furnace slag d = 10 – 120 mm, V = 11,5–13.0 m3 | |
| 4. | C8 C9 C10 | 1.40–2.39 1.90–2.27 1.50–2.26 | 3.20 m 3.10 m 3.50 m | 1 x 5 m, 22 x 15 m, 1 x 5 m blast furnace slag d = 0 – 350 mm, V = 12.0 m3 | |
| 5. | C11 C12 | 1.80–2.78 1.50–2.58 | 3.20 m 3.20 m | 1 x 5 m, 22 x 15 m, 1 x 5 m blast furnace slag d = 0 – 350 mm, V = 15.0 m3 | |
| 6. | C13 C14 | 1.73 - 2.80 2.00 - 2.69 | 3.40 m 3.40 m | 1 x 5 m, 23 x 15 m, 1 x 5 m blast furnace slag d = 0 – 350 mm, V = 18.0 m3 | |
| 7. | C15 C16 | 2.30 - 2.60 2.20 - 2.60 | 3.40 m 3.50 m | 1 x 5 m, 22 x 15 m, 1 x 5 m, blast furnace slag d = 0 – 350 mm, V = 17.0 m3 | |
| 8. | C17 C18 | 1.50 - 2.74 1.50 - 2.68 | 3.80 m 3.80 m | 1 x 5 m, 22 x 15 m, 1 x 5 m blast furnace slag d = 0 – 350 mm, V = 18.0 m3 |
Table 4.
Details on the shapes of the columns, ratio of the thickness of the improved layer and the height of the pounder, the maximum and mean consistency indexes of the soil layers along at the column length and relations to the diameters of the column and of the pounder
| Site No. | Column | Diameter variation / Shape | Hs/Hp [-] | Ic(min) [-] | Ic(m) [-] | Dcmax/Dp [-] | Dcmin/Dp [-] | Dcm/Dp [-] | Dcmax/Dcmin [-] |
|---|---|---|---|---|---|---|---|---|---|
| 1. | C1 | constant / cylindrical | 0.85 | 0.56 | 0.56 | 2.13 | 1.90 | 2.04 | 1.12 |
| C2 | 1.00 | 0.60 | 0.60 | 2.17 | 1.90 | 2.07 | 1.14 | ||
| 2. | C3 | increases with depth / truncated cone | 1.39 | 0.42 | 0.54 | 2.50 | 1.60 | 2.08 | 1.56 |
| C4 | 1.44 | 0.42 | 0.56 | 2.50 | 1.70 | 2.19 | 1.47 | ||
| 3. | C5 | the largest diameter at the bottom / asymmetrical barrel | 1.56 | 0.58 | 0.58 | 2.47 | 1.70 | 2.20 | 1.45 |
| C6 | 1.67 | 0.58 | 0.58 | 2.39 | 1.80 | 2.15 | 1.33 | ||
| C7 | 1.83 | 0.58 | 0.58 | 2.40 | 1.80 | 2.17 | 1.33 | ||
| 4. | C8 | the largest diameter at the mid-length / barrel-shaped | 1.77 | 0.50 | 0.50 | 2.39 | 1.40 | 2.09 | 1.71 |
| C9 | 1.72 | 0.50 | 0.50 | 2.27 | 1.90 | 2.10 | 1.19 | ||
| C10 | 1.94 | 0.50 | 0.50 | 2.26 | 1.50 | 1.99 | 1.51 | ||
| 5. | C11 | the largest diameter at the bottom / asymmetrical barrel | 1.78 | 0.56 | 0.62 | 2.78 | 1.80 | 2.36 | 1.54 |
| C12 | 1.78 | 0.52 | 0.66 | 2.58 | 1.50 | 2.27 | 1.72 | ||
| 6. | C13 | the largest diameter at barrelthe mid-length / | 1.89 | 0.44 | 0.45 | 2.80 | 1.73 | 2.45 | 1.62 |
| C14 | 1.89 | 0.44 | 0.45 | 2.69 | 2.00 | 2.45 | 1.35 | ||
| 7. | C15 | the largest diameter at the mid-length / | 1.89 | 0.37 | 0.52 | 2.60 | 2.30 | 2.44 | 1.13 |
| C16 | 1.94 | 0.37 | 0.51 | 2.60 | 2.20 | 2.38 | 1.18 | ||
| 8. | C17 | the largest diameter at the bottom / asymmetrical barrel | 2.11 | 0.40 | 0.68 | 2.74 | 1.50 | 2.30 | 1.83 |
| C18 | 2.11 | 0.30 | 0.54 | 2.68 | 1.50 | 2.37 | 1.79 |
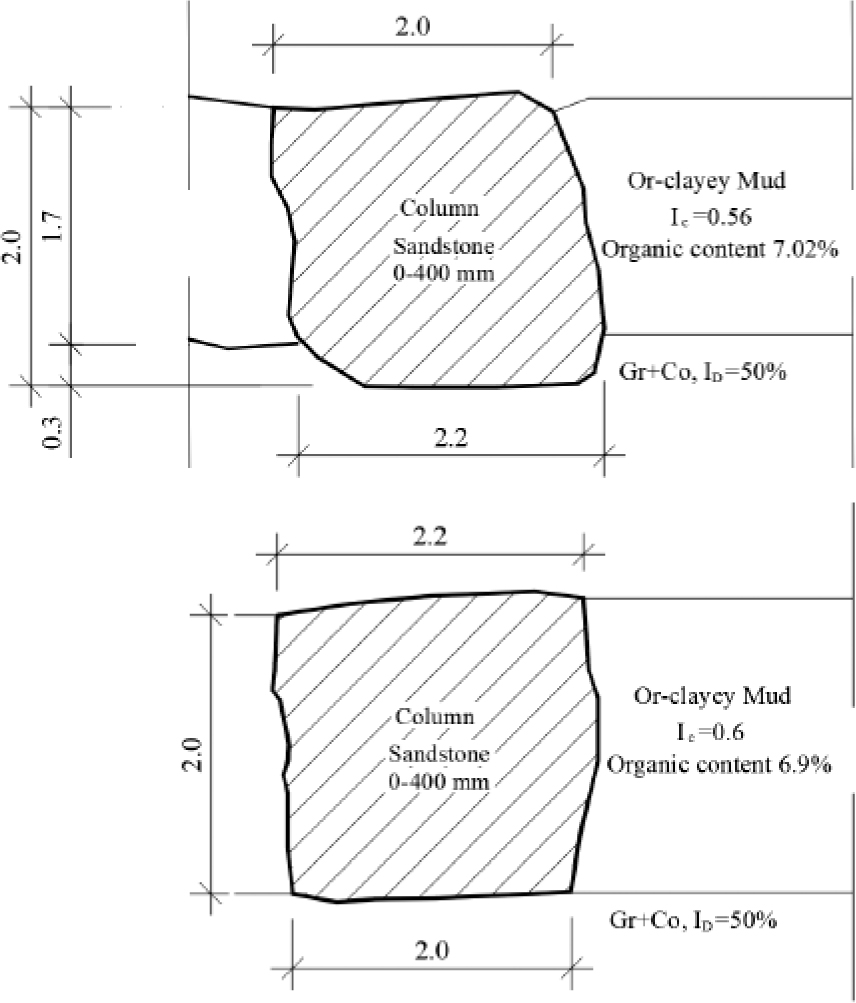
Figure 2.
Shapes of columns at site No. 1.: C1 (left), C2 (right)
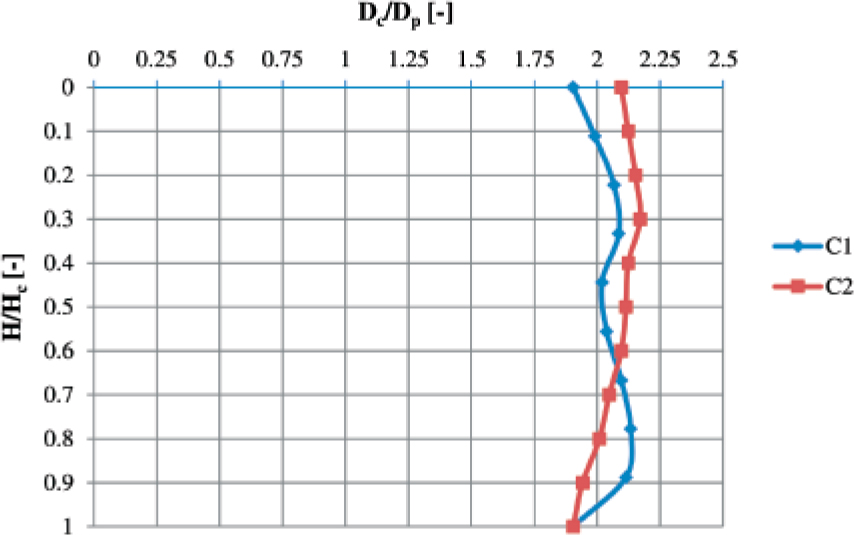
Figure 3.
Dependence between the ratio of the column and pounder diameters (Dc/Dp) and the relative depth (H/Hc) – Site No. 1, columns C1 and C2
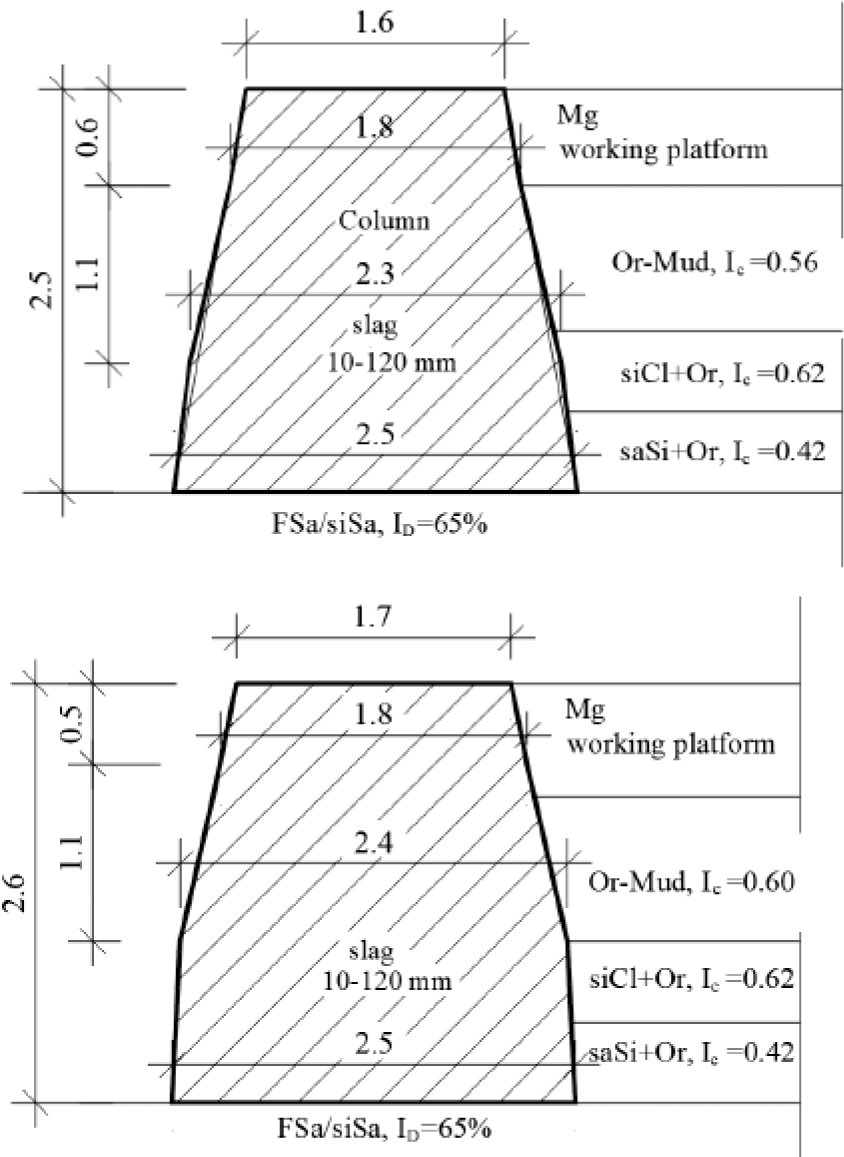
Figure 4.
Shapes of columns at site No. 2.: C3 (top), C4 (bottom)
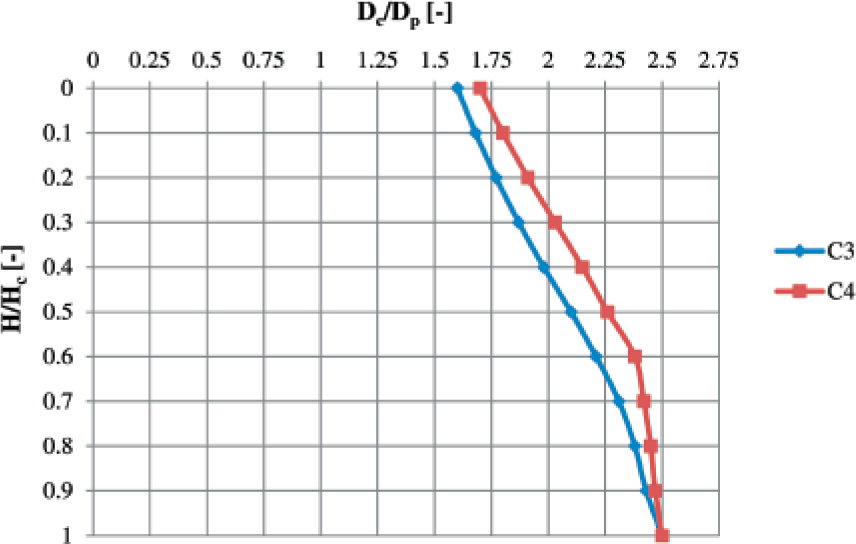
Figure 5.
Dependence between the ratio of the column and pounder diameters (Dc/Dp) and the relative depth (H/Hc) – Site No. 2, columns C3 and C4
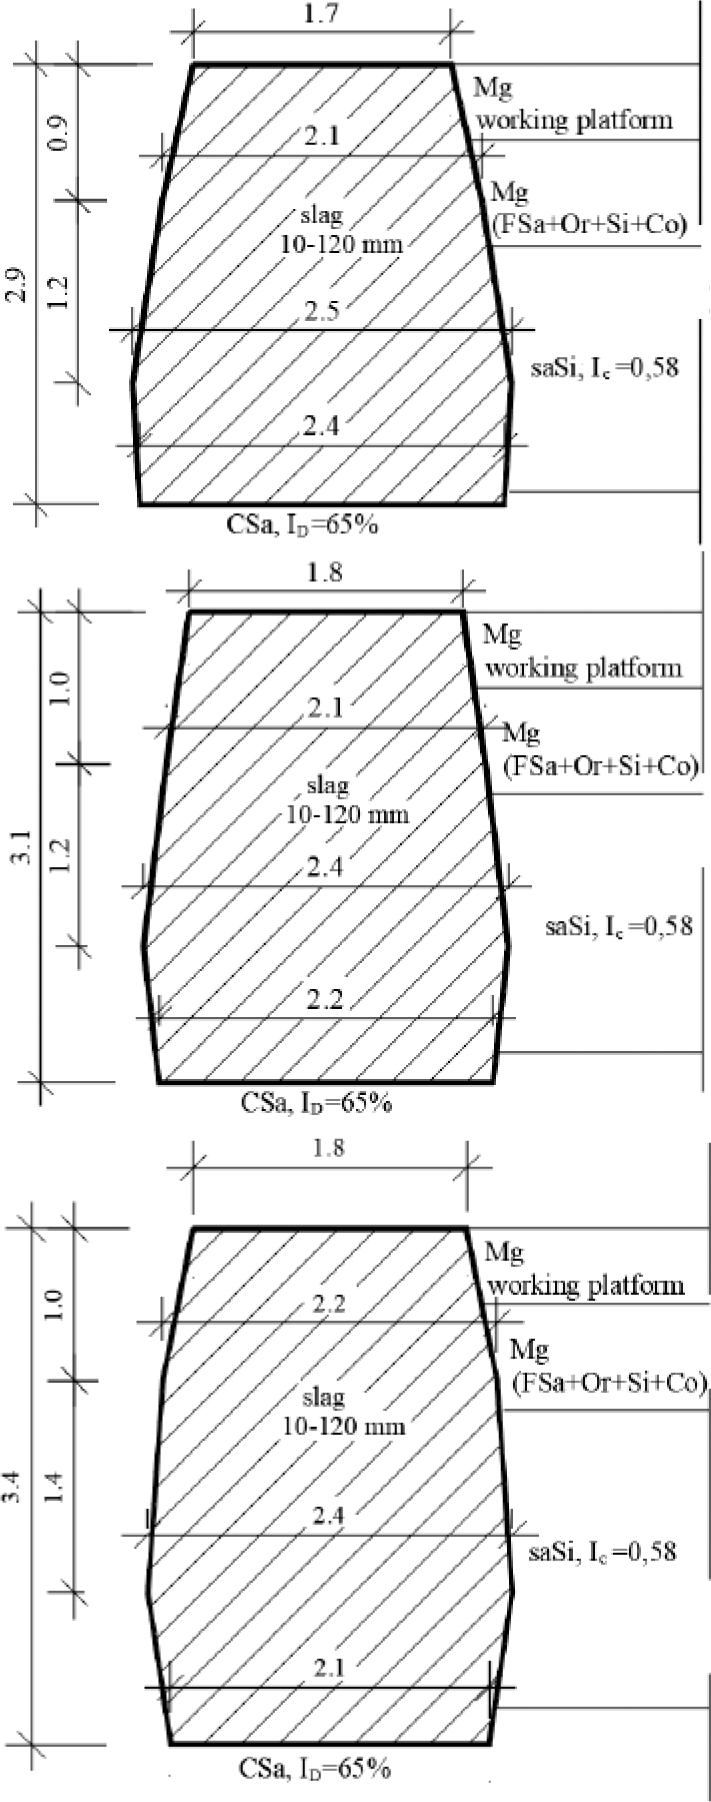
Figure 6.
Shapes of columns at site No. 3.: C5 (top), C6 (middle), C7 (bottom)
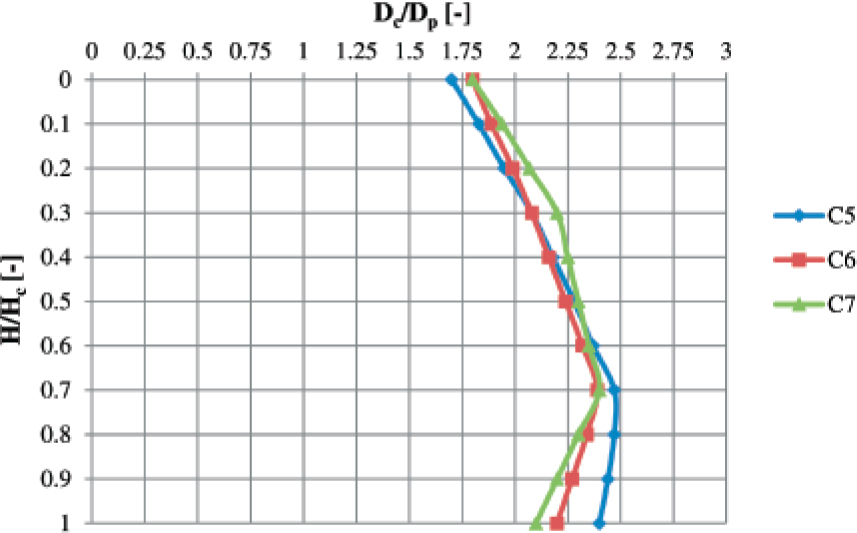
Figure 7.
Dependence between the ratio of the column and pounder diameters (Dc/Dp) and the relative depth (H/Hc) – Site No. 3, columns C5, C6 and C7
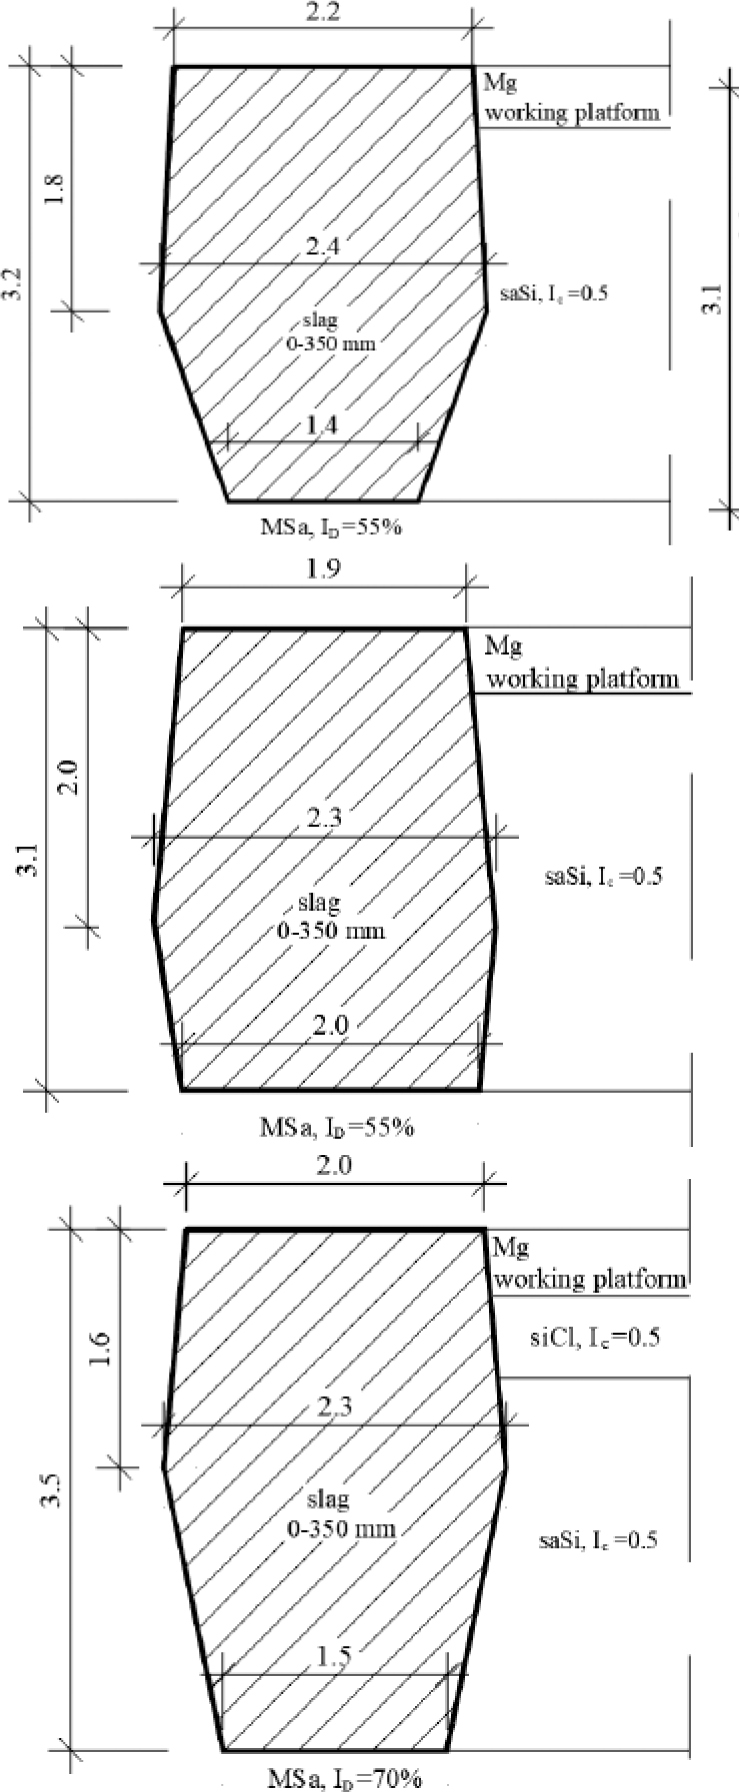
Figure 8.
Shapes of columns at site No. 4: C8 (top), C9 (middle), C10 (bottom)
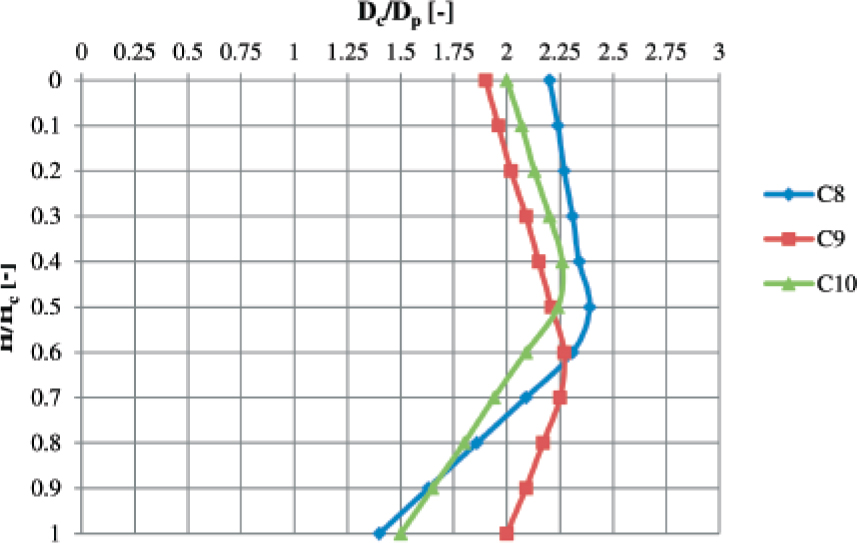
Figure 9.
Dependence between the ratio of the column and pounder diameters (Dc/Dp) and the relative depth (H/Hc) – Site No. 4, columns C8, C9 and C10
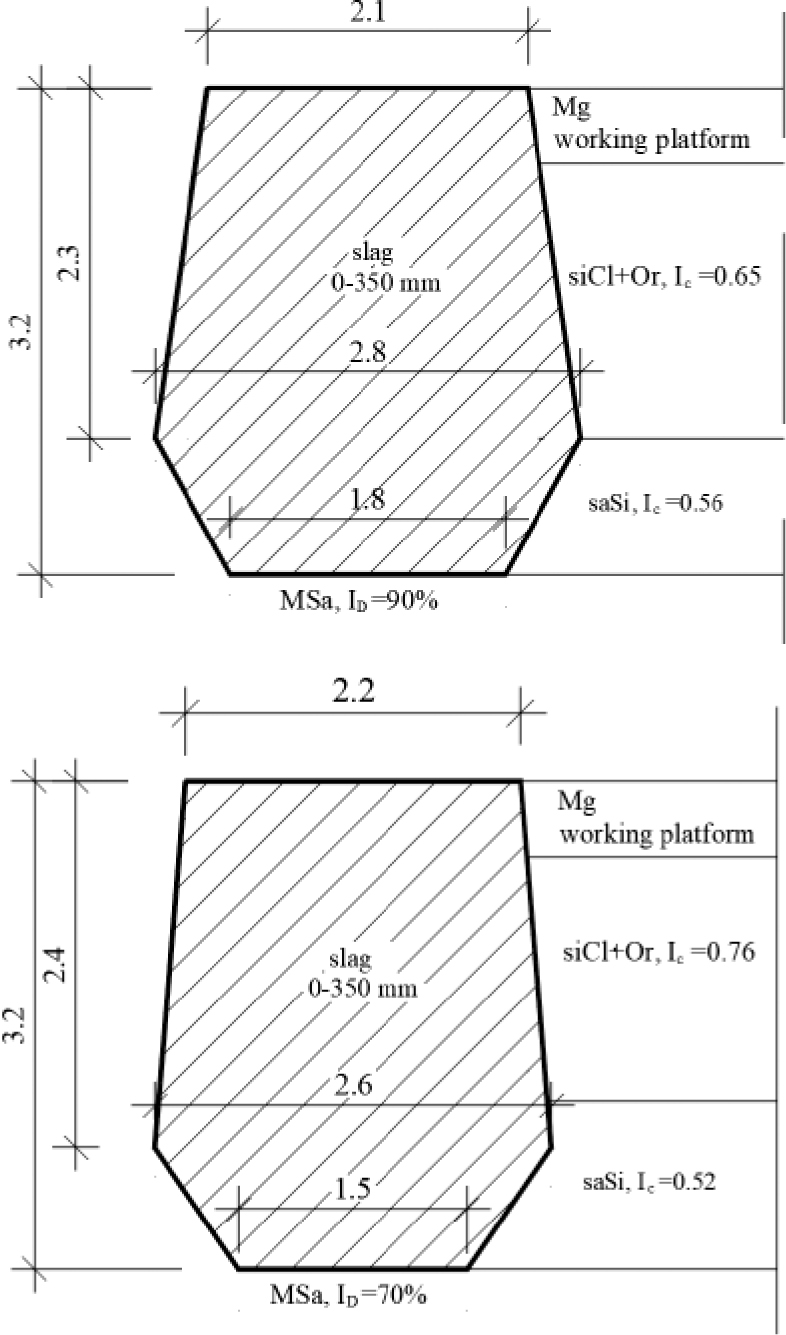
Figure 10.
Shapes of columns at site No. 5: C11 (top), C12 (bottom)
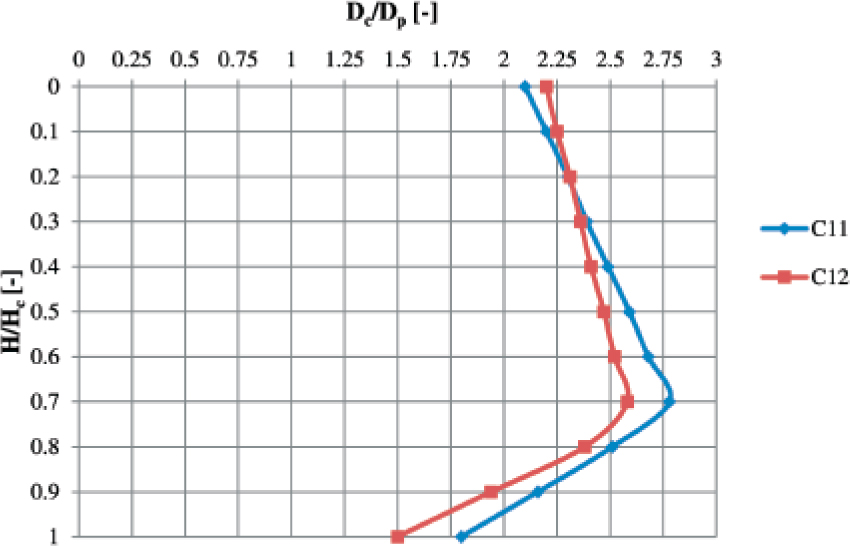
Figure 11.
Dependence between the ratio of the column and pounder diameters (Dc/Dp) and the relative depth (H/Hc) – Site No. 5, columns C11 and C12
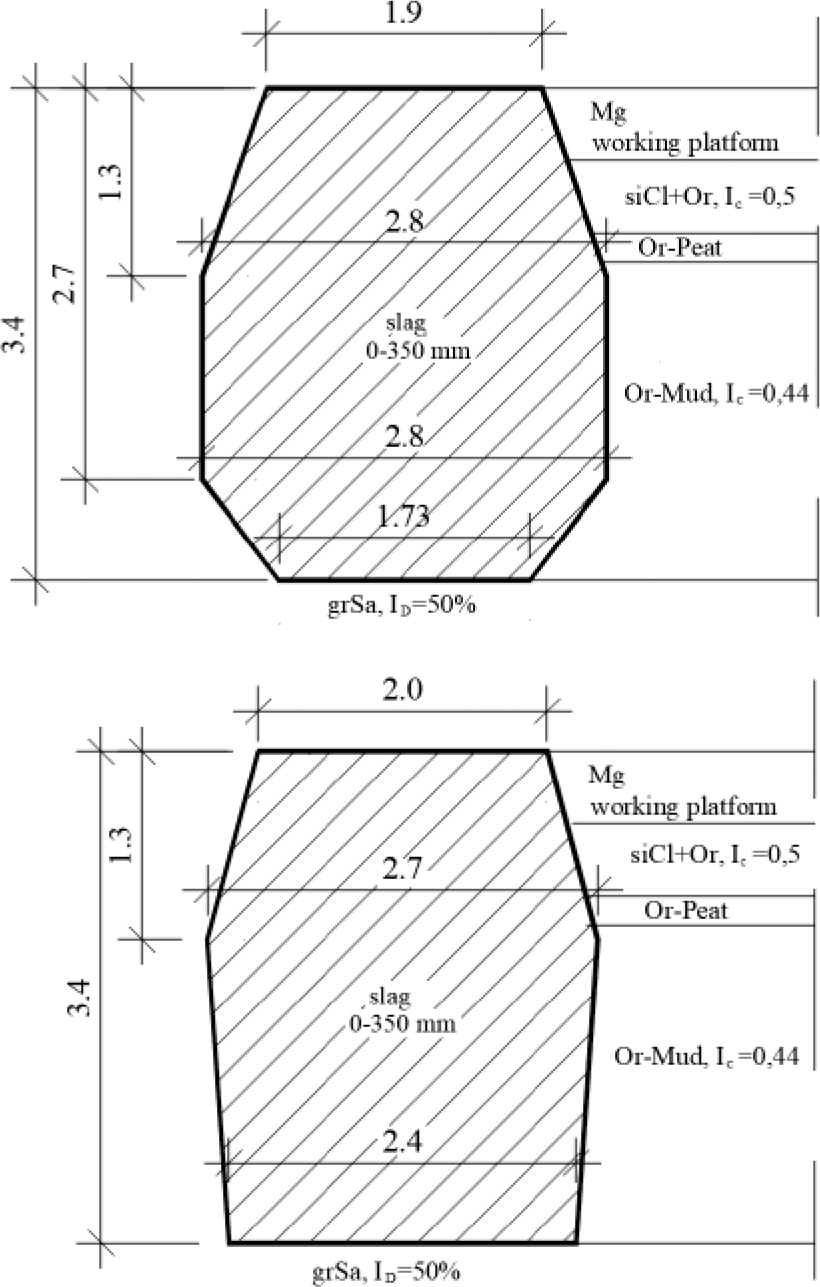
Figure 12.
Shapes of columns at site No. 6: C13 (top), C14 (bottom)
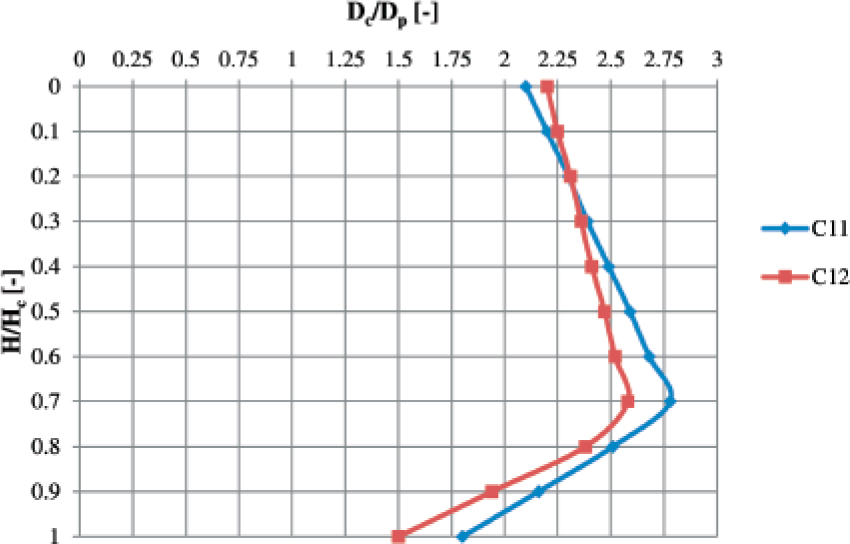
Figure 13.
Dependence between the ratio of the column and pounder diameters (Dc/Dp) and the relative depth (H/Hc) – Site No. 6, columns C13 and C14
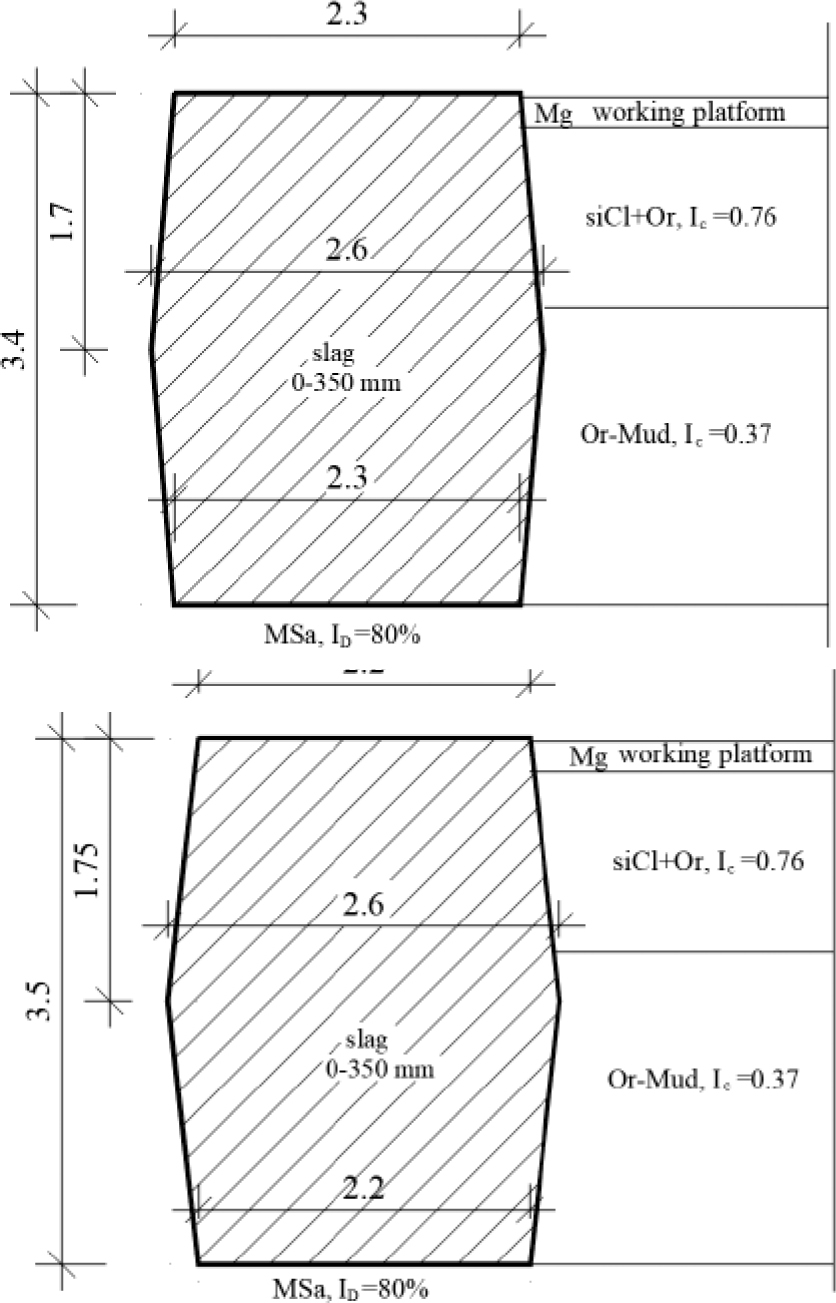
Figure 14.
Shapes of columns at site No. 7: C15 (top), C16 (bottom)
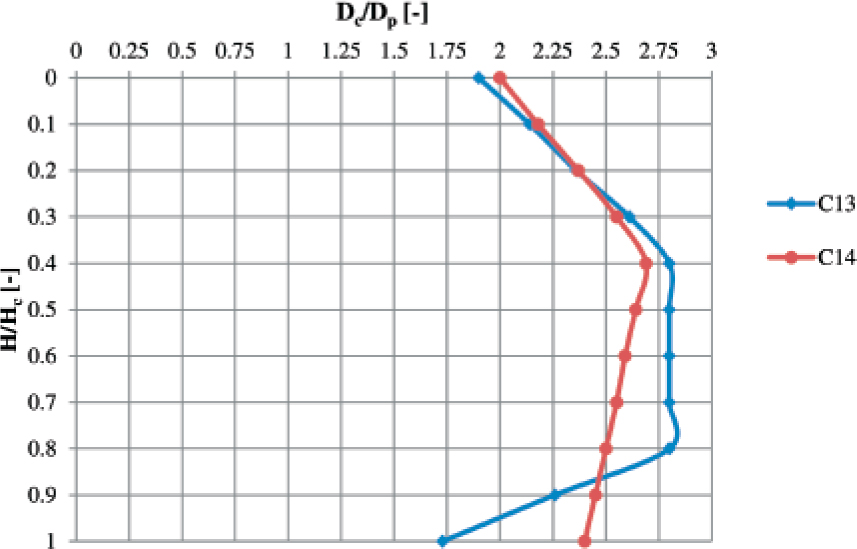
Figure 15.
Dependence between the ratio of the column and pounder diameters (Dc/Dp) and the relative depth (H/Hc) – Site No. 7, columns C15 and C16
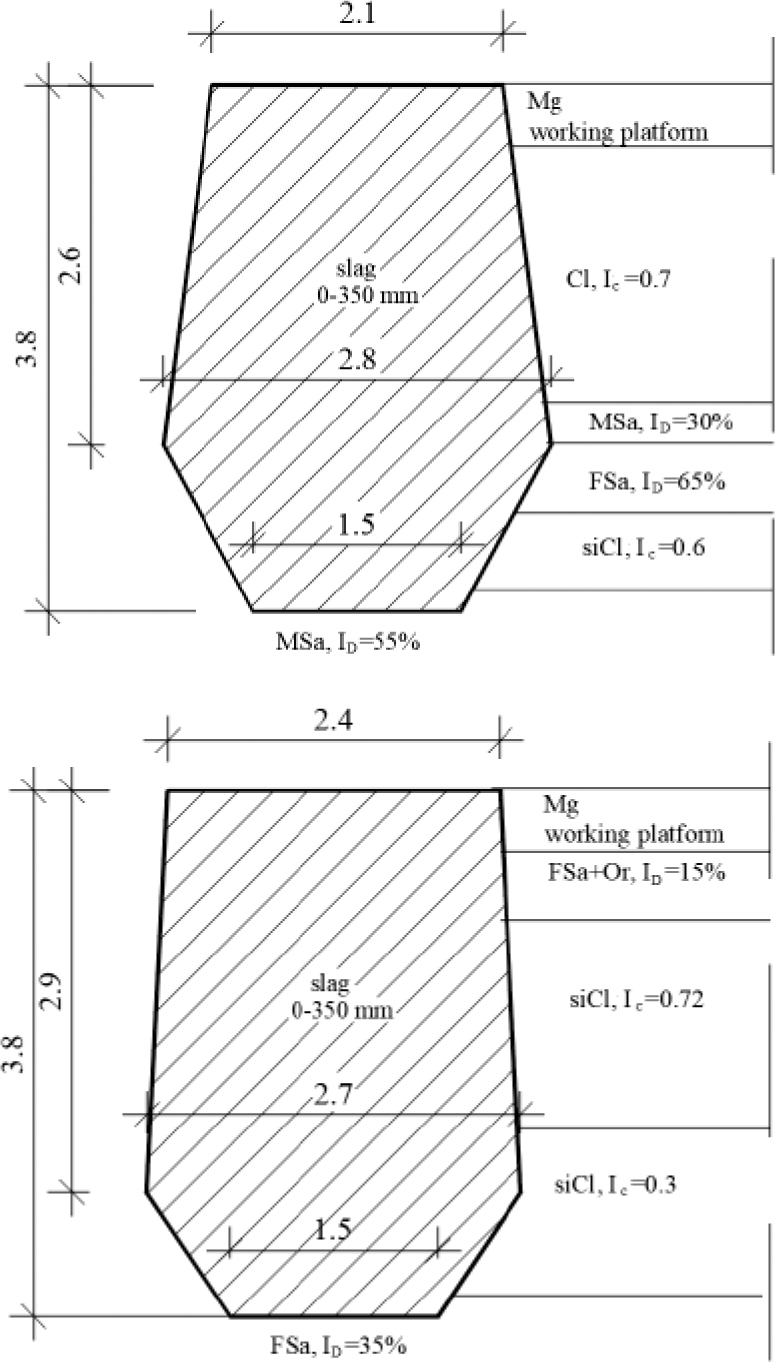
Figure 16.
Shapes of columns at site No. 8: C17 (top), C18 (bottom)
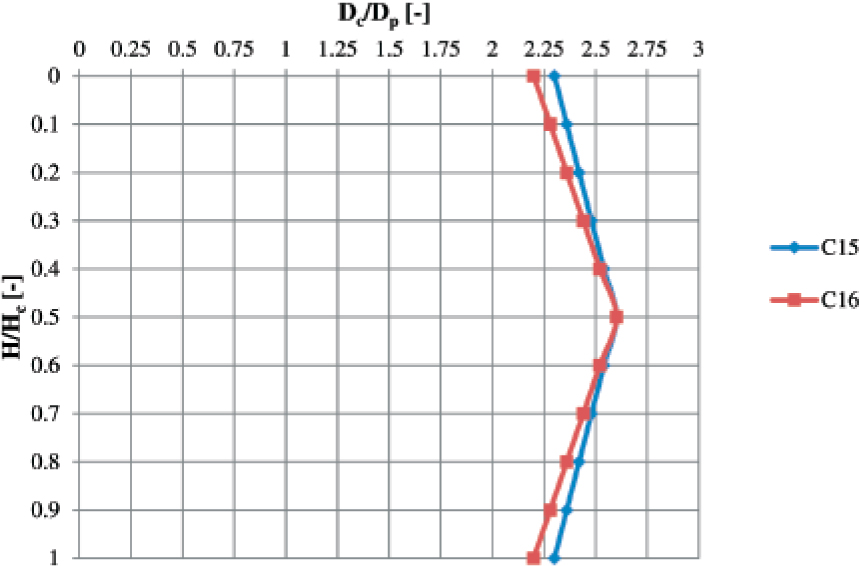
Figure 17.
Dependence between the ratio of the column and pounder diameters (Dc/Dp) and the relative depth (H/Hc) – Site No. 8, columns C17 and C18
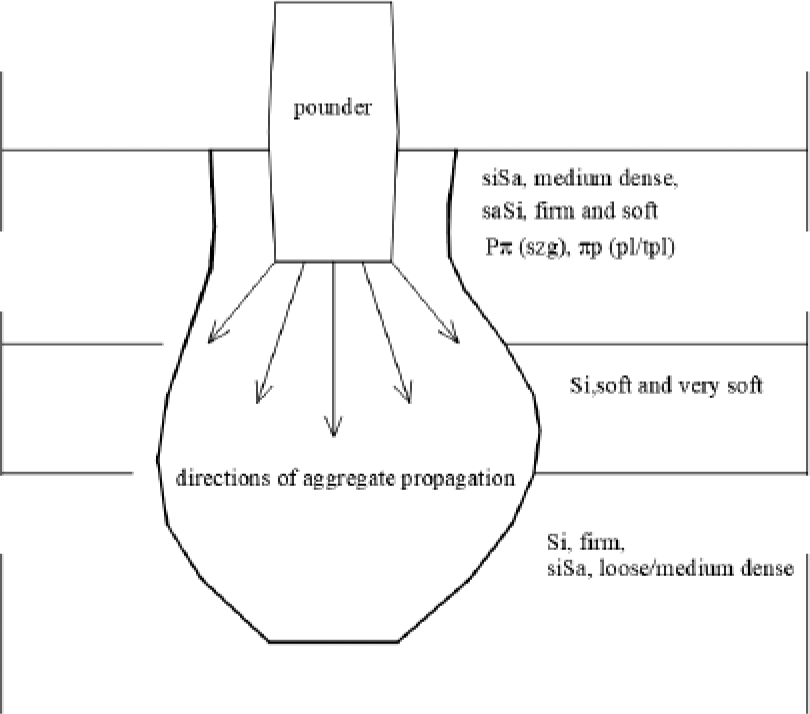
Figure 18.
Propagation of the aggregate during driving a floating DR column [15]
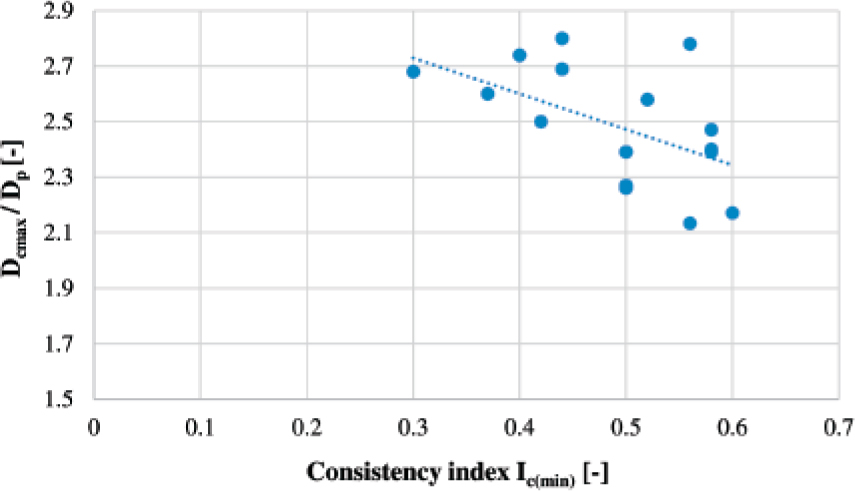
Figure 19.
Relation between the consistency of the weakest soil and the relative maximal diameters of the columns
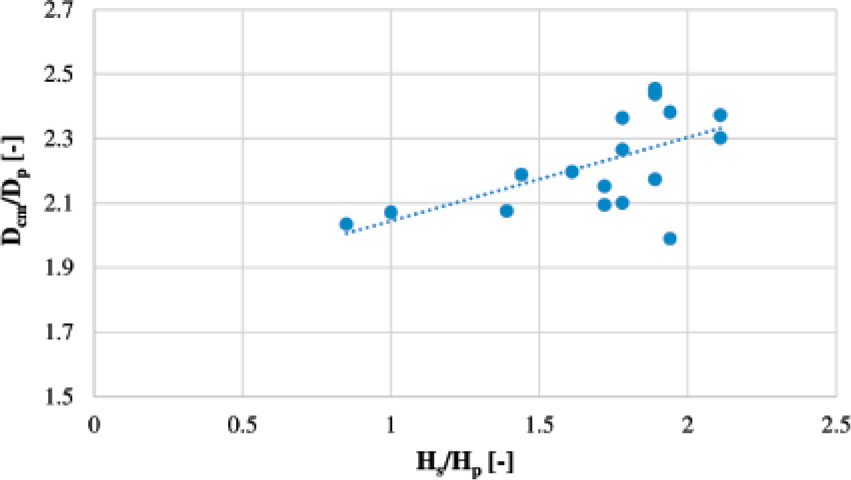
Figure 20.
Relation between the Hs/Hp ratios and the mean relative diameters of columns Dcm/Dp
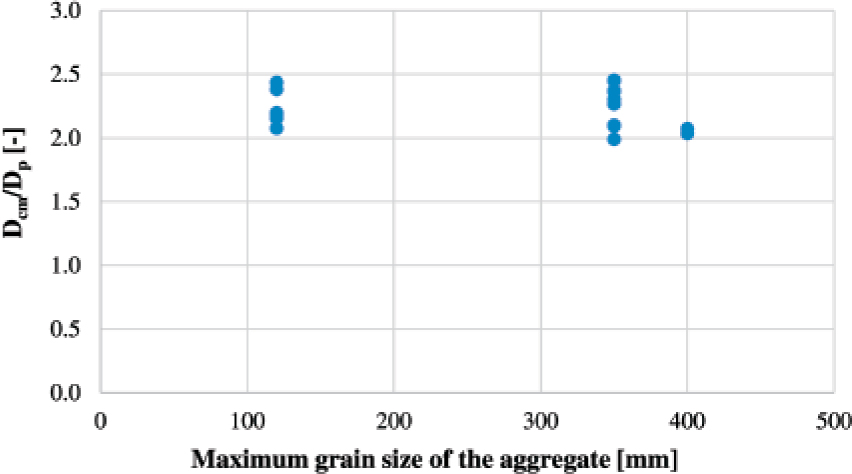
Figure 21.
Relation between the maximum grain size of the aggregate used as the replacement material and the mean relative diameters of the columns Dcm/Dp